
 Open Access Article
 This Open Access Article is licensed under a
 Creative Commons Attribution 3.0 Unported Licence
Isotopic separation of helium through graphyne membranes: a ring polymer molecular dynamics study†
Somnath
Bhowmick
 *ab,
Marta I.
Hernández
c,
José
Campos-Martínez
*c and
Yury V.
Suleimanov
*a
*ab,
Marta I.
Hernández
c,
José
Campos-Martínez
*c and
Yury V.
Suleimanov
*a
aComputation-based Science and Technology Research Center, The Cyprus Institute, 20 Konstantinou Kavafi Street, Nicosia 2121, Cyprus. E-mail: s.bhowmick@cyi.ac.cy; y.suleymanov@cyi.ac.cy; Fax: +357 22208625; Tel: +357 22397526
bClimate & Atmosphere Research Centre, The Cyprus Institute, 20 Konstantinou Kavafi Street, Nicosia 2121, Cyprus
cInstituto de Física Fundamental, Consejo Superior de Investigaciones Científicas (IFF-CSIC), Serrano 123, 28006 Madrid, Spain. E-mail: j.campos.martinez@csic.es; Fax: +34 915854894; Tel: +34 915616800
First published on 11th August 2021
Abstract
Microscopic-level understanding of the separation mechanism for two-dimensional (2D) membranes is an active area of research due to potential implications of this class of membranes for various technological processes. Helium (He) purification from the natural resources is of particular interest due to the shortfall in its production. In this work, we applied the ring polymer molecular dynamics (RPMD) method to graphdiyne (Gr2) and graphtriyne (Gr3) 2D membranes having variable pore sizes for the separation of He isotopes, and compare for the first time with rigorous quantum calculations. We found that the transmission rate through Gr3 is many orders of magnitude greater than Gr2. The selectivity of either isotope at low temperatures is a consequence of a delicate balance between the zero-point energy effect and tunneling of 4He and 3He. In particular, a remarkable tunneling effect is reported on the Gr2 membrane at 10 K, leading to a much larger permeation of the lighter species as compared to the heavier isotope. RPMD provides an efficient approach for studying the separation of He isotopes, taking into account quantum effects of light nuclei motions at low temperatures, which classical methods fail to capture.
1 Introduction
The use of two-dimensional (2D) materials is an open field for many technological applications as well as for basic science.1,2 Graphene, one of the pioneering materials that started this very active area of research, acts as an almost impermeable sheet for most atomic and molecular species due to its high electron density surrounding the aromatic rings.3,4 Some years ago, experiments by Lozada-Hidalgo et al.5,6 and recently by Creager et al.7 have shown that small charged particles such as the proton and its isotopes can penetrate through a monolayer of pristine graphene. There is no complete explanation despite many theoretical calculations,8–10 although some kind of chemical interaction seems to be responsible for this process. Even more recently, it has also be found that hydrogen can permeate pristine graphene.11 However, the penetration energy barrier for other neutral atoms is significantly higher and therefore supports the widely recognized notion of graphene impermeability.12 Introducing defects and moderate annealing into the membrane, and nanopores of different sizes, may enable graphene and other 2D layers to act as atomic and molecular sieves.12–20 The use of 2D materials as a filter at the molecular level is one of the most interesting applications.14 Besides using 2D membranes with fabricated nanopores, some compounds contain nanopores in their structures at different positions and sizes; therefore, they are more naturally suited for filtering at the molecular level.An interesting class of 2D nanoporous material is graphyne,21,22 which is composed of sp–sp2 hybridized C atoms and can be considered as a graphene derivative. In graphyne, one-third of C–C bonds have been replaced by mono- and poly-acetylenic units (–C![[triple bond, length as m-dash]](https://www.rsc.org/images/entities/char_e002.gif) C–)N. Baughman et al.,23 theoretically proposed the first stable structures of graphyne, which was two decades later synthesized on a copper substrate.24,25N defines the number of acetylenic linkages and, consequently, the size of the uniformly distributed and repeating sub-nanometer triangular pores. They are termed as graph-N-yne membranes, such as graphdiyne (Gr2), graphtriyne (Gr3), etc., for N = 2 and 3, respectively.26 The chemical and mechanical properties of these graphyne membranes have many useful features, such as they are chemically inert and stable at ambient temperatures,27–29 and flexible enough to withstand deformations induced by high pressures.30,31 The above-mentioned properties of graphynes, coupled with their unique geometrical structure, make them an excellent candidate to be utilized in gas separation and water filtration technologies. Indeed, one can find many reports on the purification of gases such as H2,32 N2,33 and O234 from a mixture of gases and desalination and filtration of water26,31,35 in the literature.
C–)N. Baughman et al.,23 theoretically proposed the first stable structures of graphyne, which was two decades later synthesized on a copper substrate.24,25N defines the number of acetylenic linkages and, consequently, the size of the uniformly distributed and repeating sub-nanometer triangular pores. They are termed as graph-N-yne membranes, such as graphdiyne (Gr2), graphtriyne (Gr3), etc., for N = 2 and 3, respectively.26 The chemical and mechanical properties of these graphyne membranes have many useful features, such as they are chemically inert and stable at ambient temperatures,27–29 and flexible enough to withstand deformations induced by high pressures.30,31 The above-mentioned properties of graphynes, coupled with their unique geometrical structure, make them an excellent candidate to be utilized in gas separation and water filtration technologies. Indeed, one can find many reports on the purification of gases such as H2,32 N2,33 and O234 from a mixture of gases and desalination and filtration of water26,31,35 in the literature.
There is a growing worldwide demand for helium purification from its natural resources due to the shortfall in its production.36 It has numerous industrial and scientific applications such as superconducting magnets, space rockets, arc welding, etc. In particular, the lighter isotope, 3He, also plays a pivotal role in fundamental research, for example, in neutron-scattering centers, ultracold physics and chemistry, etc.37 The relative abundance of 3He is low (≈1.34 × 10⁻⁶%)38 in comparison to its heavier isotope, and its extraction from natural gas is usually done by means of expensive cryogenic distillation and pressure-swing adsorption methods.39 An alternate and more energy-efficient process is to use the 2D porous membranes in isotopic gas separation since they usually do not involve costly liquefaction of the gases.40 Many theoretical works have been reported in the last decade on the separation of He isotopes using graphene derivatives, such as: polyphenylene (2D-PP),37,41–44 functionalized graphene pores,16,45–47 nanoporous multilayers,46,48 Gr2,37,49,50 Gr3,51 holey graphene50, and graphenylene membranes,52etc.
The light element He within the vicinity of subnanometer pores is an obvious environment for observing the important role of the quantum mechanical effects such as zero-point energy (ZPE) and tunneling effects. A wise approach for an effective isotopic separation maybe is to exploit these quantum properties that could run in the opposite directions. The heavier isotope with smaller ZPE will diffuse faster, while quantum mechanical (QM) tunneling favours the lighter species. Previously, some of us, using quantum three-dimensional wave packet calculations have shown that the 4He/3He selectivity increases with decreasing temperature for Gr2 and holey graphene membranes.49,50 It has also been reported that the effect of ZPE is more dominant than tunneling at low temperatures (20–40 K).49 On the contrary, within a low but acceptable gas flux and at low temperatures (10–30 K), separation on various functionalized membranes indicates increased selectivity for the lighter isotope due to QM tunneling.16,45,46,52
The ring polymer molecular dynamics (RPMD) method,53–56 based on the imaginary-time path integral formalism, is an efficient approach that can accurately and reliably describe the ZPE57 and deep quantum tunneling effects.53,58,59 RPMD method is essentially a classical molecular dynamics method in an extended ring polymer phase space. It can provide reliable estimates of thermal rate coefficients since the RPMD partition function rigorously converges to the QM partition function.60 The long-time limit of the ring polymer flux-side correlation functions is independent of the choice of the dividing surface that separates reactants from products, while its short-time limit is related to various quantum transition state theories.56 RPMD was introduced in an ad hoc manner by Craig and Manolopoulos to study the dynamics of the condensed phase processes,53,54 owing to its simplicity and efficiency (scales favorably with the dimensionality of the system). Examples of its successful application include diffusion in and inelastic neutron scattering from liquid para hydrogen,61,62 the translational and orientational diffusion in liquid water,63 proton transfer in water,64 diffusion of H and μ atoms in liquid water, hexagonal ice,65 and on Ni surface,66 electron transfer67 and proton-coupled electron transfer,68 enzyme catalysis,69etc. However, the RPMD method is not restricted to the condensed phases and also found wide application in calculating rate coefficients for the gas-phase bimolecular reactions70–72 as explored by Suleimanov and co-workers, see for instance, a review by one of us56 and a recent paper73 and references mentioned therein. The RPMD method has recently been used to describe phenomena such as atom scattering or sticking on surfaces74,75 and a related problem on permeation of H+ and D+ on pristine graphene.8 Nonetheless, in all cases, the authors point out, again, the importance of considering both ZPE and tunneling for isotopic separation.
In this work, we test the accuracy of the RPMD method compared to pure quantum results, with a similar model to make a fair and righteous comparison, providing evidence that RPMD can be used down to very low temperature and in conditions where quantum phenomena dominate, which has not been reported before. To this end, coupled with the major scientific and industrial appeal, in this paper, we examine the feasibility of separation of He isotopes using 2D Gr2 and Gr3 membranes at low temperatures (10–250 K) using the RPMD method. It is worth noting that the quantum rate of permeation of He isotopes through the pores of Gr2 at cold temperature regime (down to 10 K) has not been reported previously, probably because wave packet calculations are often difficult to converge at very low temperature. A significant part of the success of the RPMD method is attributed to the fact that it gives the exact quantum-mechanical rate coefficient for the transmission through a parabolic barrier,53 which is advantageous for the present investigation. The primary objective of this study is to provide a reliable estimate of the selectivity and to show that RPMD is a necessary alternative to study these processes where quantum effects are expected to be very important.
The paper is organized as follows: in the next Section (2), we provide the details of the RPMD approach along with the potential energy surface (PES) used in the present study. The results of RPMD rate coefficients and selectivity have been compared with earlier studies49–51 in Section 3. Concluding remarks are provided in Section 4.
2 Computational details
2.1 The simulation setup and potential energies
We investigate the rate of transmission of both 3He and 4He through 2D graphdiyne (Gr2) and graphtriyne (Gr3) membranes using the RPMD method. The unit cell of Gr2 and Gr3 has the dimensions (in x- and y-coordinates) of (16.37 Å, 9.45 Å) and (20.82 Å, 12.02 Å), respectively (see Fig. 1(a) and (b)). A comprehensive study on the geometry of the membranes can be found in ref. 37. All molecular dynamics simulations have been performed on graphyne membranes using same periodic unit as in ref. 50. | ||
| Fig. 1 Schematic representation of the unit cell of two-dimensional (a) graphdiyne and (b) graphtriyne membranes employed in this study. The x- and y-dimensions are in the unit of Å. The solid lines represent bonds between two neighboring C atoms. The filled gray circle denotes He atom penetrating through one of the four energetically most favorable and equivalent site(s) of the membrane (x = 0; y = 0). The four equivalent sites can be identified in the inset plot of Fig. 2b of ref. 50. | ||
The interaction potential between He–graphyne membranes is obtained as an additive improved Lennard-Jones (ILJ) He–C pair potentials, as described in detail in an earlier work.76 The optimized values of the parameters of the ILJ potentials have been determined from “coupled” supermolecular second-order Møller–Plesset perturbation theory (MP2C) theory77 using aug-cc-pVTZ and aug-cc-pV5Z basis set for C- and He-atoms respectively. These IJL potentials correspond to the same potentials as employed in previous studies of He transmission through graphyne membranes,37,49–51 and a detailed description can be found elsewhere.37,49 The accuracy of the MP2C method as well as the analytical potentials can be ascertained from rigorous comparison with previous force fields26 and ab initio calculations,37,49 respectively.
The potential energy curves of He along the transmission pathway (z-coordinates) to both membranes are illustrated in Fig. 2, while the contour plots in Fig. 3(a) and (b) highlight the in-pore displacements of He along x- and y-coordinates. It is quite evident from both these plots that the minimum energy path (MEP) for an effective He transmission may correspond to a straight line perpendicular to the center of the pore. For the transmission through the Gr2 membrane, the He atom lying at the center of a pore is the saddle point. The maximum potential barrier height (i.e. energy difference between the transition state, TS, (z = 0.0 Å) and at the asymptote (for example, z = 6.0 Å)) for the MEP is 37.85 meV, which is similar to the previous studies.37,49,50 In contrast, MEP for the He–Gr3 PES is devoid of any potential barrier; instead, a large well (of depth 17.74 meV) appears within the vicinity of the membrane.51 These results suggest that He penetration of larger Gr3 pores should be much easier than that of smaller Gr2 pores, analogous to the report on water permeation by Bartolomei et al.26 Furthermore, along this MEP and He atom–membrane perpendicular distance of around 6.0 Å, the interaction potential reaches a plateau and therefore can be characterized as an asymptotic reactant site. It is interesting to note that the interaction potential steeply rises to a high value for any movement along the in-pore x – and y – degrees of freedom [see Fig. 3(a) and (b)].
 | ||
| Fig. 2 Variation of the potential energies (in meV) for (a) He atom–graphdiyne and (b) He atom–graphtriyne interaction along the minimum energy transmission pathway (MEP) (in Å). The interaction energies are calculated by using improved Lennard-Jones (ILJ) potentials. The MEP corresponds to He atom perpendicularly approaching the geometric center of graphdiyne and graphtriyne pores with reaction coordinates (0,0, z). | ||
 | ||
| Fig. 3 Improved Lennard-Jones (ILJ) interaction potentials (in meV) for the displacement of He atom along x and y directions from the center of the pore (0,0,0) on (a) graphdiyne and (b) graphtriyne membranes. The z coordinate of He atom was held at the origin. The energy contour step value is 50 meV and 10 meV for (a) and (b), respectively. | ||
2.2 Ring polymer molecular dynamics (RPMD) method
The classical Hamiltonian for the system composed of 4He or 3He atom under the influence of external potential arising from M carbon atoms of fixed Gr2 or Gr3 membrane can be written in the atomic unit as: | (1) |
![[p with combining circumflex]](https://www.rsc.org/images/entities/b_i_char_0070_0302.gif) and
and ![[r with combining circumflex]](https://www.rsc.org/images/entities/b_i_char_0072_0302.gif) He are the momentum and position vector of the He atom of mass m, and C(i)'s are the position vectors of the C atoms of Gr2 or Gr3. In the RPMD method, the He atom is treated as n classical replicas of the original particle, each connected with its nearest neighbor by harmonic springs. The modified ring polymer Hamiltonian has the form:
He are the momentum and position vector of the He atom of mass m, and C(i)'s are the position vectors of the C atoms of Gr2 or Gr3. In the RPMD method, the He atom is treated as n classical replicas of the original particle, each connected with its nearest neighbor by harmonic springs. The modified ring polymer Hamiltonian has the form: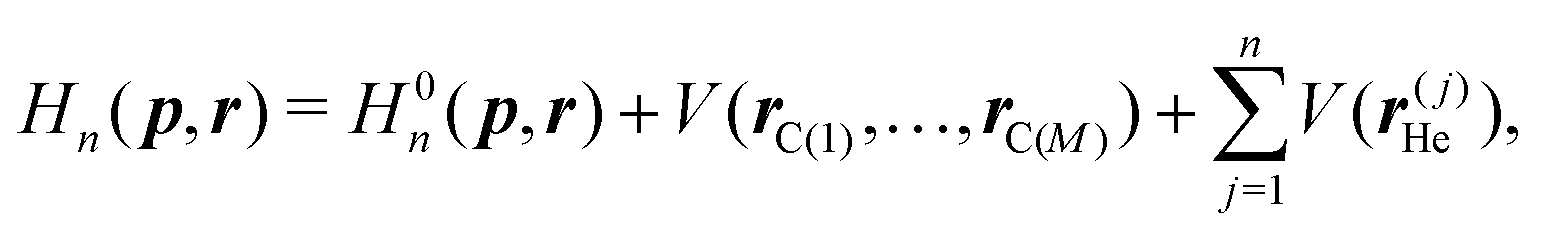 | (2) |
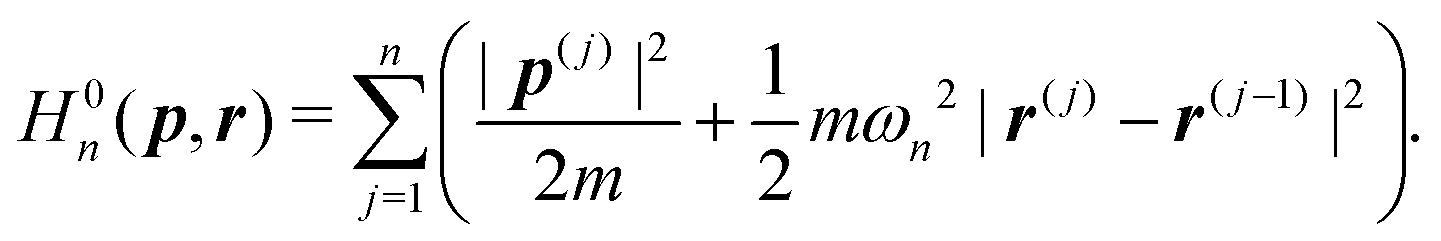 | (3) |
We perform the RPMD simulations at temperatures T below 250 K because, previously, it was observed that the maximum selectivity was obtained at low temperatures.49,50 We choose eight different T = 10, 20, 30, 50, 100, 150, 200, and 250 K, to study the variation of selectivities with T and to find an optimal temperature range for isotopic separation. Furthermore, the number of beads is a measure of the resolution of the path integral calculations, i.e., RPMD calculations scale linearly with n.56 However, since RPMD calculations are approximately n times slower than the purely classical calculations,56 after several trials, we have meticulously chosen the number of beads to be 128. This value of n gives a fair compromise between computational cost and accuracy (quantum effects of ZPE and tunneling) at low temperatures. Since the crossover temperature Tc(= ħωi/2πkB, where ωi is the imaginary frequency at the TS) on the Gr2–He PES is found to be 17 K, in order to obtain the reliability of the RPMD simulations at very low temperature, calculations at 10 K have been performed with a greater number of beads (n = 256). The value of n = 1, will correspond to a classical calculation.
Since RPMD is simply classical molecular dynamics in an extended (n-bead imaginary time path integral) phase space, the ring polymer rate coefficient can be expressed as:53,54,71
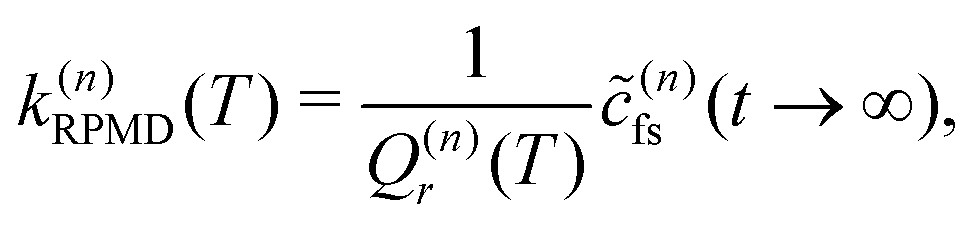 | (4) |
![[c with combining tilde]](https://www.rsc.org/images/entities/i_char_0063_0303.gif) (n)fs(t) is a ring polymer flux-side correlation function78
(n)fs(t) is a ring polymer flux-side correlation function78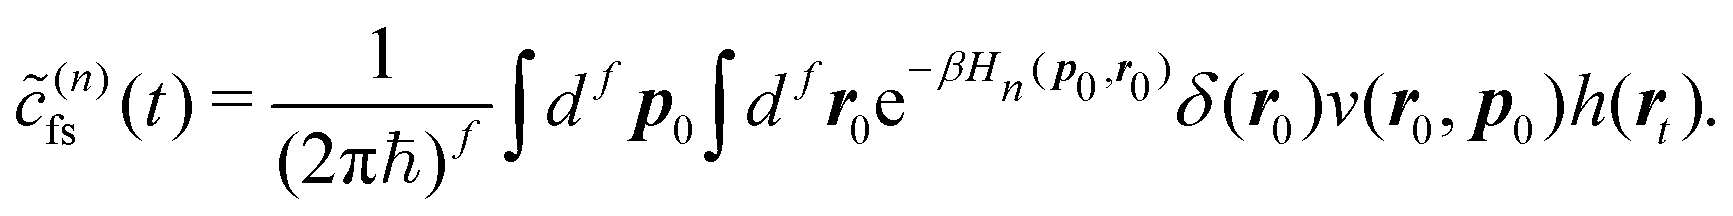 | (5) |
Here, subscript 0 and t indicates time, δ(r0) is a delta function centered at r0, v(r0,p0) is the velocity, and h(rt) is the Heaviside step function. The RPMD rate coefficient in eqn (4) is not straightforward to solve numerically. Therefore, we introduce the Bennett–Chandler factorization scheme79,80 to simplify eqn (4) that can be solved numerically without compromising its generality.80 The method has been extensively discussed previously54,70,71,81 and will not be repeated here. Briefly, in this approach, a reaction coordinate s(r) is defined, which monitors the progress of a reaction from the reactant (s > 0) to the product (s < 0) site. For the He transmission through 2D membranes, a reasonable reaction coordinate is s(r) = ![[z with combining macron]](https://www.rsc.org/images/entities/i_char_007a_0304.gif) , where is the z-component of the He atom centroid, which follows the minimum energy path of Fig. 2. Within the Bennett–Chandler approach, the RPMD rate coefficient for a process in which reactants and products separated by a dividing surface at s (in this work, at the center of the pore, s = 0.0 Å) can be expressed as a product of two terms:
, where is the z-component of the He atom centroid, which follows the minimum energy path of Fig. 2. Within the Bennett–Chandler approach, the RPMD rate coefficient for a process in which reactants and products separated by a dividing surface at s (in this work, at the center of the pore, s = 0.0 Å) can be expressed as a product of two terms:
| kRPMD(T) = kQTST(T)κ(tp). | (6) |
Here, the first factor, kQTST(T), is the centroid-density quantum transition-state theory (QTST) rate coefficient.54kQTST(T) can be calculated from the centroid potential of mean force (PMF),70–72W(s) along the reaction coordinate. If s∞ is the asymptotic distance in which the He – membrane interaction potential is negligible and then introduce a dividing surface carefully placed at the TS region, s‡, then kQTST(T) can be calculated as:66,81
 | (7) |
 | (8) |
 | (9) |
Here, Nwindows is the number of biasing windows placed along the reaction coordinate. The strength of the force constant (ki) of the harmonic biasing potential was chosen to be 2.72 × 10⁻³T (K) eV a0−2. Ni is the total number of steps sampled for window i, ![[s with combining macron]](https://www.rsc.org/images/entities/i_char_0073_0304.gif) i and σi2 are the mean value and variance for the trajectory calculated for the ith window. In each umbrella sampling windows, 100 trajectories with different initial configurations were propagated for 100 ps following an initial equilibration period of 20 ps in the presence of an Andersen thermostat.85 The ring polymer equation of motion were integrated using velocity Verlet integrator with a step size of 0.1 fs that involves alternating momentum updates and free ring polymer evolutions.60
i and σi2 are the mean value and variance for the trajectory calculated for the ith window. In each umbrella sampling windows, 100 trajectories with different initial configurations were propagated for 100 ps following an initial equilibration period of 20 ps in the presence of an Andersen thermostat.85 The ring polymer equation of motion were integrated using velocity Verlet integrator with a step size of 0.1 fs that involves alternating momentum updates and free ring polymer evolutions.60
The second term in eqn (6), κ(tp), is the long-time limit of a time-dependent ring polymer transmission coefficient or the ring polymer recrossing factor65,71,72,81 and is a dynamic correction to kQTST. Typically this factor is calculated at the top of the free energy barrier on the PMF profile so as to minimize the time required to reach plateau value.80 This factor ensures that the final kRPMD value is independent of the choice of the dividing surface.54,56 Therefore, finding an optimum location for transmission coefficient calculation is not essential within the RPMD formalism; a close approximation of the TS (for example, s = 0.0 Å in Fig. 4 and 5) will suffice for a smooth and efficient convergence of κ(tp). The mathematical expression for κ(tp) can be written as:66,72
 | (10) |
 | ||
| Fig. 4 Variation of the RPMD potential of mean force, W(s), (in meV) for (i) 3He (ii) 4He atom along the reaction coordinate s (in Å) perpendicular to the graphdiyne membrane within the temperature range (A) 10–250 K, (B) 20–30 K, and (C) 200 K. The legends correspond to (A)–(C). | ||
 | ||
| Fig. 5 Variation of the RPMD potential of mean force, W(s), (in meV) for (i) 3He (ii) 4He atom along the reaction coordinate s (in Å) perpendicular to the graphtriyne membrane within the temperature range (A) 10–250 K, (B) 20–30 K, and (C) 250 K. The legends correspond to (A)–(C). | ||
3 Results and discussion
3.1 Centroid potentials of mean force and ring polymer recrossing factor
The variation of the RPMD potential of mean force W(s) for 3He and 4He along the reaction coordinate s at T = 10–250 K are plotted in Fig. 4 (Gr2) and Fig. 5 (Gr3), and the corresponding kQTST values are reported in the Table S1 of ESI.† These PMF profiles include both potential energy and temperature-dependent entropic contributions. The barrier height at the TS, identified around the membrane plane, increases with increasing temperature. The free energy profiles enter a shallow well at around s = 2.0–3.4 Å from the reactant site before it steadily increases up to the TS. For the PMFs obtained for the transmission through Gr2, the calculated TS barrier height falls within 37–127 meV. It is evident that the PMF profiles at 10 K are markedly distinct from those obtained at other temperatures. At 10 K, the free energy profiles for both isotopes are almost flat within the vicinity of the pore (s = ±0.6 Å). The corresponding barrier heights at the TS are also significantly low (37–40 meV) compared to those obtained at 20 K (64–66 meV). The PMF profiles on Gr3, on the other hand, are more interesting from thermodynamic point of view. We recall that the He–Gr3 interaction potential does not have any barrier;51 rather, a well is built around the transmission zone. This behavior is reflected in the free energy profiles, particularly within the temperature range 10–30 K, in which the thermodynamic barrier in the TS region (at s = 0.0 Å) has a negative (or marginally positive) value compared to the reactant site. This energy barrier gradually takes the shape of a parabola with increasing temperature and reaches up to a height of 44 meV at 250 K.Since the RPMD method averages points in configurational space on both sides of the potential energy barrier, modeling the effects of the tunneling and ZPE and leaving a mark on the free energy profiles,59 we can roughly attempt to identify these properties. Comparing the PMF profiles of 4He at a particular temperature with the corresponding 3He's on Gr2 indicate the existence of a prominent ZPE effect; heavier isotope has a lower free energy at the TS than the lighter ones except at 10 and 20 K (see Fig. 4(B)), in which quantum tunneling may play a crucial role. In particular, at 10 K, the barrier height for 3He transmission is around 3 meV lower than that for 4He. Interestingly, at that temperature, the free energy barrier (37 meV) for 3He is marginally smaller than the pure potential energy at 0 K (38 meV), suggesting that the transmission of the lighter isotope may be driven by quantum mechanical tunneling. However, the difference between them at TS decreases with increasing temperature. For example, the difference at 30 K is 2.3 meV (see Fig. 4(B)), which decreases to 0.1 meV at 200 K (see Fig. 4(C)). Similarly, the 3He and 4He free energy comparison for Gr3 follows the same trend observed for Gr2, i.e., they decrease with increasing temperature. Within 10–30 K, 4He has a smaller TS free energy than 3He (≈1.0 meV, Fig. 5(B)), and with the increase in temperature in the range 50–150 K, the heavier isotope progressively requires more free energy to reach TS, i.e., PMF profiles for both isotope are almost identical. Within 200–250 K, the free energies of 4He are consistently larger than those obtained for 3He (see Fig. 5(C)). These observations can be notionally interpreted as follows: within 10–30 K, the free energy barrier is too broadened for effective tunneling, and consequently, the ZPE effect takes precedence.57 There is a competition between them at moderate temperatures (50–150 K). At still more elevated temperature (200–250 K), the greater tunneling probability of 3He may facilitate a smaller TS free energy compared to 4He. Note that this analysis is conceptual because these two quantum effects cannot be rigorously separated within the RPMD formalism.
There are considerable differences observed between the PMF profiles obtained by the RPMD method with the classical ones at low temperatures (see Fig. S1–S4 of ESI†). This, therefore, reinforces our earlier argument of the existence of quantum effects in these transmission processes, which the classical calculation fails to capture. For the He transmission through Gr2 membrane, the free energy barrier height in the classical calculations is always lower than those obtained by the RPMD method, except at 10 K. Moreover, the flat region in the free energy profile in the RPMD simulations found around the TS at 10 K is absent in the classical calculations. The maximum difference between classical and RPMD barriers is ≈10 meV for 3He (at 100 K) and ≈12 meV for 4He (obtained at 20 K). Note that the free energy values exponentially contribute to the rate coefficients. As expected, these PMF plots tend to merge with increasing temperature as the quantum effects fade. Comparison between the classical and RPMD method on Gr3 shows that, for both isotopes, the maximum free energy difference at the TS is found at the lowest temperature (≈4 meV), and this difference smoothly decreases with increasing temperature. It is worth noting that the classical PMFs within the 10–20 K temperature range do not have any barrier around the center of the pore. For 4He within 200–250 K, the difference between the RPMD and classical barrier heights becomes 1 meV.
The time-dependent transmission coefficients, κ(t), for all temperatures considered in this study are calculated at s‡ = 0.0 Å. The plots of κ(t) against time (t) are moved to the ESI† (Fig. S5 and S6). The corresponding plateau value of the transmission coefficients, κ(t → ∞), are provided in Table S1 (ESI†). The plateau value κ(t) on both membranes is always close to unity (0.98–1.00), except at 10 K on Gr2, where κ(t) falls within 0.63 (3He)–0.78 (4He). The greater recrossings of the lighter isotope at 10 K may be attributed to the fact that the slowly moving 3He can more readily tunnel back and forth through the potential barrier. On the other hand, at 20 K, κ(t) for 3He is marginally smaller than that obtained for 4He (0.98 and 0.99 respectively). Additionally, a longer propagation time is required to converge the transmission coefficients at 10 K (2 ps) than at any other temperatures (around 500 fs). Clearly, for temperatures above 10 K, recrossing dynamics do not play any significant role for the He transmission on both membranes, particularly from 50 K and higher temperature, where κ(t) value is always 1.00. This implies that most of the He trajectories that reach the center of the pore of either Gr2 or Gr3 would overcome the free energy barrier and transport to the other side of the dividing surface. On Gr3, if the recrossing trajectories are propagated for a more extended period of time (for example, 10 ps), then after around 1.1 ps (3He) or 1.2 ps (4He), κ(t) decays rapidly and eventually settle to a value close to zero (see Fig. S7 of ESI†). This decay is more prominent at low temperatures (10–20 K) than at higher temperatures (for example, 250 K). This phenomenon is apparently due to a “secondary event”, such as the He atom recrosses the dividing surface while performing “another” transmission.66 This exponential decay in the κ(t) values is missing for the transmission through Gr2; therefore, they may also be linked to the shape of the PMFs on Gr3 at low temperatures, which is devoid of a substantial free energy barrier and consequently easier to perform such motions. The signature of the “secondary event” on the κ(t) profile can be effectively eliminated by placing the dividing surface, s‡ around the asymptotic reactant site. However, the convergence of κ(t) at such separation would require a very large number of “child” trajectories to be propagated for an extended period of time (hundreds of ps for the present cases), thus incurring a substantial computational burden. As discussed previously, since the RPMD rate coefficient is independent of the position of this dividing surface; therefore, determination of κ(t) at the asymptotic reactant site would be disadvantageous in the present case. Note that the classical recrossing factor is always 1, even at low temperatures.
3.2 Thermal rate coefficient
Since the plateau of κ(t) is always close to unity, there is practically no significant difference between the values of kQTST and kRPMD on both membranes, except at 10 K on Gr2. The variation of kRPMD with temperature is plotted in Fig. 6 and Fig. S8 of ESI,† while the numerical values of kRPMD and kQTST are reported in Table S1 of ESI.† It is evident that kRPMD's on Gr3 is many orders of magnitude greater than that obtained on Gr2. The maximum difference was observed at the lowest temperature (by a factor of 1023–1020 at 10 K), and with the increase in temperature, this difference decreases rapidly (to 102 at 250 K) as the kRPMDvs. T curves start to converge. This is due to the fact that the value of kRPMD on Gr3 does not change drastically with temperature (confined within 3.63 × 10¹⁰–1.06 × 10¹¹ s−1). It starts to decrease slightly with temperature up to 50 K and then increases successively with increasing T. On Gr2, however, for both isotopes, kRPMD increases manifold with temperature, in agreement with the previous calculations.37,49,50 This increment in the rate coefficient is more pronounced at the modest rise in T in the low temperature regime than at the high temperature range. The increase in the value of kRPMD is in the order of 104–106 for the temperature rise from 10 K to 20 K, while for other cases (for example, 20 K to 30 K or 30 K to 50 K), the same raises by five orders of magnitude. However, kRPMD increases much less than an order for the consecutive 50 K temperature jumps, starting at 150 K. | ||
| Fig. 6 Variation of the ring polymer molecular dynamics, RPMD (kRPMD) and classical (kcl) rate coefficients (in s−1) for the transmission of 3He [red circle (RPMD) and green diamond (classical)] and 4He [blue square (RPMD) and orange pentagon (classical)] through (a) graphdiyne and (b) graphtriyne membranes with temperature T (in K). The legends correspond to both (a) and (b). | ||
The above observations can be explained by inspecting the corresponding PMF profiles. At low temperatures (10–50 K), there is practically no free energy barrier for the transmission of either isotope on Gr3. However, on Gr2, the free energy barrier is already about 40 meV at 10 K. The slowly moving He atoms do not have enough kinetic energy to overcome this barrier to reach the other side of the membrane. Therefore, it is not surprising that kRPMD's on Gr3 is many orders of magnitude greater than those obtained on Gr2, and the actual He flux through the pores of Gr2 membranes will be extremely slow.49,50 Similar arguments can be presented at higher temperatures, although the increased kinetic energy of the incoming He atom will contribute to smaller differences in the kRPMD values. We also point out the analogous quantum wave packet observation reported on the Gr2 and holey graphene (P7) sheet having a more diffused pore.50 Finally, when comparing the classical and RPMD rate coefficients, it is obvious that the classical method overestimates the rate coefficient within the whole temperature regime studied in this work, except at 10 K for Gr2, where they underestimate by factor of 104–106. This discrepancy is particularly more apparent at low temperatures, when the quantum effects dominate, and on the Gr2 membrane. For example, at 20 K and for Gr2 membrane, the classical rate coefficient is more than three orders of magnitude greater than the corresponding kRPMD. However, they do closely follow a similar temperature dependence as obtained by the RPMD calculations.
3.3 4He/3He selectivity
The 4He/3He selectivity, defined as the ratio between the RPMD rate coefficient of the heavier He isotope to the lighter one, kRPMD(4He)/kRPMD(3He), is plotted as a function of temperature in Fig. 7, and the corresponding values are reported in Table S1 of ESI.† For Gr2 membrane, 4He/3He selectivity increases for the temperature rise from 10 K to 30 K. At 10 K, the calculated selectivity corresponds to the lowest value found in this study (0.013). Conversely, it signifies that the rate of permeation of the lighter isotope is about 77 times faster than the heavier isotope due to the predominant tunneling of 3He atoms, as elaborated in Section 3.1. Therefore, it represents an optimum temperature for isotope separation on Gr2. Note that such high selectivity on either Gr2 or Gr3 membrane has not been reported in the literature. There is no significant preference for either isotope found at 20 K. While, at 30 K, the maximum selectivity for the heavier isotope is obtained (≈2), indicating pronounced quantum ZPE effect as discussed previously. However, these increased selectivities at low temperatures are usually accompanied by a decreased permeability.87 With the increase in temperature, this selectivity ratio progressively becomes smaller and starts to flatten out, commencing from 100 K. Although at higher temperatures (>100 K), the transmission of the lighter isotope is favoured to some extent. We note the analogous selectivity profile was obtained on the P7 sheet.50 Similarly, for the Gr3 membrane, the maximum 4He/3He selectivity obtained at 10 K (1.25), which gradually decreases till 50 K, and then remains almost constant (0.87 to 0.83) marginally preferring 3He for higher temperature regime. The variation of the selectivity is fully consistent with the nature of their PMF profiles that inherits quantum effects. It is interesting to note that the selectivity plot for both Gr2 and Gr3 approach each other with increasing T, one from the top and another from the bottom (see Fig. S9 of ESI†), and at 250 K, they almost become equal (≈0.8 and partially in favour of 3He). This is reasonable since as the quantum effects diminish with temperature and with fewer constraints, the lighter isotope transmission will be slightly favoured, governed by the factor (≈ 0.87).
 | ||
| Fig. 7 Variation of the 4He/3He rate coefficient ratio, k(4He)/k(3He), calculated using (i) classical (red filled circle) (ii) ring polymer molecular dynamics, RPMD (blue filled square) and (iii) three-dimensional wave packet propagation method, WP3D (green solid line) for the He transmission through (a) graphdiyne and (b) graphtriyne membranes with temperature T (in K). The legends correspond to both (a) and (b). | ||
The selectivity ratios obtained by the RPMD method show good agreement with those obtained by the quantum three-dimensional wave packet propagation (WP3D) results obtained by Gijón et al.50 and Hernández et al.51 for the whole temperature range studied in this work. In general, the RPMD selectivity profile closely resembles the WP3D results; however, they do overestimate and underestimate to some degree. For example, on Gr2, the RPMD selectivity ratio overestimates the quantum calculations for the whole temperature range. The maximum difference between these two methods is found at 30 K (0.2). Similarly, on Gr3, the RPMD method seems to overestimate the selectivity ratio within 20–250 K, but have an excellent agreement at 10 K (1.25 and 1.30, respectively). Overall, the difference between RPMD and WP3D results for the selectivity ratio lies within 9–23% on Gr2 and 4–36% on Gr3 in comparison to the quantum calculation. The discrepancy between RPMD and WP3D selectivity ratios on Gr3, particularly at low temperatures, may be attributed to the formation of long-lived resonances within the potential well, which the RPMD method is not completely able to capture.56 On the other hand, the classical selectivity shows no significant change with temperature and remains almost constant (0.80–0.91), slightly favoring 3He transmission. This is valid for both membranes. As expected, with the rise in temperature, the classical selectivity follows the RPMD and WP3D ones.
A natural question arises regarding the effect of the motion of the carbon atoms of Gr2/Gr3 on the 3He/4He permeation rates and the selectivity ratio. One way to foresee the importance of the membrane motion is to study the modifications that the penetrating atom produces on the membrane degrees of freedom at the atom–membrane transition state. It is known that the He atoms typically induce minute changes in the geometries of the pores, producing a small decrease in the barrier height upon relaxation of the membrane (of the order of few cm−1) as found, for instance, in the electronic energy calculations of the interaction between He with nanoporous graphene16 or for this very same system (see Fig. S1 of ref. 37). For this reason, it is not expected that the inclusion of the motion of the C atoms will significantly alter the results reported in this paper. However, it would be interesting to evaluate the effect of the layer motion on the RPMD rate coefficient provided that an adequate C–C force field for these membranes is available. Other processes at the gas-membrane interface do require an explicit treatment of the carbon atoms dynamics since they involve large deformations of the carbon framework, including rehybridization and formation of new bonds.8,88
4 Conclusions
In this work, we have calculated the thermal rate coefficient for the transmission of He isotopes through the pores of one atom thick graphdiyne (Gr2) and graphtriyne (Gr3) membranes using the ring polymer molecular dynamics (RPMD) method within the temperature range 10–250 K. Transmission through Gr2 has a substantial free energy barrier even at 10 K, and this barrier height increases with increasing temperature. Although, the free energy barrier at 10 K is smaller than the potential energy, signifying the presence of quantum mechanical tunneling. On the other hand, transmission through Gr3 can either have marginally negative (up to 30 K) or small positive (T ≥ 50 K) free energy barrier. The extent of the barrier height directly impacts the calculated rates, as evident from the fact that the rate coefficient on Gr3 is at least 1020 order of magnitude greater than on Gr2 at 10 K. The rate coefficient on Gr2 increases rapidly with temperature till 150 K (∼108 s−1); thereafter, it increases moderately. However, the rate coefficients on Gr3 do not vary appreciably with temperature and remain almost constant for the whole temperature range (3.63 × 10¹⁰–1.06 × 10¹¹ s−1). In general, the rate coefficient calculated for the transmission through Gr3 is always greater than the corresponding one on Gr2 over the whole temperature regime considered in this work. Moreover, we found that the recrossing dynamics have little or no effect on the final value of the rate coefficients for temperatures above 10 K.The selectivity ratio, which indicates the preference of either isotope for its permeation through the membranes, has been calculated as a function of temperature. From the values of the selectivity ratio, the quantum effects driving the He transmission, particularly at low temperatures, i.e., the zero-point energy (ZPE) favoring the heavier isotope and the tunneling of the more mobile lighter isotope, has been coarsely deduced. The maximum selectivity ratio found in this study was obtained on Gr2 membrane at 10 K in which the rate of transmission of 3He is almost 77 times the rate of 4He, seemingly due to a more dominant quantum mechanical tunneling. On the other hand, presumably as a result of the enhanced ZPE effect, the transmission of the heavier isotope is favored by a factor of ≈2 at 30 K. A similar conclusion can be derived on Gr3, where the 4He/3He selectivity is around 1.2 within the temperature range 10–20 K. However, on the Gr3 membrane, the selectivity ratio does not vary considerably with the temperature (0.8–1.2) as compared to what was observed for the transmission through the Gr2 membrane (0.01–2.0). With the increase in temperature, the permeation of the lighter isotope is marginally favored. The RPMD selectivity ratio is consistent with the quantum calculations for the entire temperature range studied in this work.50,51 On the other hand, the classical method failing to capture either of the quantum effects demonstrated a considerable discrepancy with the RPMD and quantum results, particularly at low temperatures. Therefore, it is of paramount importance to use robust and accurate methods, such as RPMD, that can correctly describe quantum effects such as ZPE and tunneling when studying physical processes for which strong quantum nature is expected.
In conclusion, in the present study, we have corroborated the efficient and rigorous nature of the RPMD method in a quantum sieving process within low to ambient temperature regime by determining thermal rate coefficients of physical processes of broad industrial and scientific significance. Previously unreported, an optimum temperature (10 K) has been found in this study that can be exploited for an efficient isotopic separation. We also hope that this work will stimulate future experimental measurements of the rate coefficients for the separation of He isotopes using graphene derivatives, taking advantage of quantum effects at low temperatures. As an extension to this work, we would like to investigate the influence of explicit motions of the membrane atoms as well as of surrounding He atoms on the RPMD rate coefficient. In such cases implementing QM methods is practically futile. It is to be noted that since the RPMD method does not take into account of the nuclear spin statistics, the bosonic and fermionic nature of the He isotopes will not be considered for a system consisting of many atoms. Despite this drawback, the superfluidity (formation of Bose–Einstein condensate) of the bosonic and the fermionic He initiates at far lower critical temperature or λ point (2.17 K89 and below 2.7 mK,90 respectively) than the proposed temperature regime (10–250 K). Recently, Parrinello and co-workers have shown that one can overcome the distinguishable nature and the explicit disregard of bosonic and fermionic exchange effects in path integral methods by avoiding the permutations of all identical particles.91,92 We also envisage to apply the RPMD method for isotopic He separation on other graphene derivatives such as polyphenylene, functionalized graphene pores, holey graphene, graphenylene membranes, etc. that were previously reported to serve as excellent atomic sieves.
Conflicts of interest
There are no conflicts to declare.Acknowledgements
Y. V. S. and S. B. acknowledge the support of the European Regional Development Fund and the Republic of Cyprus through the Research Promotion Foundation (Projects: INFRASTRUCTURE/1216/0070 and Cy-Tera NEA YPODOMH/STPATH/0308/31). Y. V. S. was also supported by the Russian Foundation for Basic Research grant number 20-03-00833. J. C.-M. and M. I. H. were supported by Spanish MICINN with Grant FIS2017-84391-C2-2-P and PID2020-114957GB-I00. We are also indebted to “Centro de Supercomputación de Galicia” (CESGA) and specially to the people in the help desk.References
- K. Khan, A. K. Tareen, M. Aslam, R. Wang, Y. Zhang, A. Mahmood, Z. Ouyang, H. Zhang and Z. Guo, J. Mater. Chem. C, 2020, 8, 387–440 RSC.
- C. Huang, Y. Li, N. Wang, W. Xue, Z. Zuo, H. Liu and Y. Li, Chem. Rev., 2018, 118, 7744–7803 CrossRef CAS PubMed.
- J. S. Bunch, S. S. Verbridge, J. S. Alden, A. M. Van Der Zande, J. M. Parpia, H. G. Craighead and P. L. McEuen, Nano Lett., 2008, 8, 2458–2462 CrossRef CAS PubMed.
- V. Berry, Carbon N. Y., 2013, 62, 1–10 CrossRef CAS.
- S. Hu, M. Lozada-Hidalgo, F. C. Wang, A. Mishchenko, F. Schedin, R. R. Nair, E. W. Hill, D. W. Boukhvalov, M. I. Katsnelson, R. A. W. Dryfe, I. V. Grigorieva, H. A. Wu and A. K. Geim, Nature, 2014, 516, 227–230 CrossRef CAS PubMed.
- M. Lozada-Hidalgo, S. Hu, O. Marshall, A. Mishchenko, A. N. Grigorenko, R. A. Dryfe, B. Radha, I. V. Grigorieva and A. K. Geim, Science, 2016, 351, 68–70 CrossRef CAS PubMed.
- S. Bukola and S. E. Creager, Electrochim. Acta, 2019, 296, 1–7 CrossRef CAS.
- J. W. Mazzuca and N. K. Haut, J. Chem. Phys., 2018, 148, 224301 CrossRef PubMed.
- M. Miao, M. B. Nardelli, Q. Wang and Y. Liu, Phys. Chem. Chem. Phys., 2013, 15, 16132–16137 RSC.
- M. Bartolomei, M. I. Hernández, J. Campos-Martínez and R. Hernández-Lamoneda, Carbon N. Y., 2019, 144, 724–730 CrossRef CAS.
- P. Z. Sun, Q. Yang, W. J. Kuang, Y. V. Stebunov, W. Q. Xiong, J. Yu, R. R. Nair, M. I. Katsnelson, S. J. Yuan, I. V. Grigorieva, M. Lozada-Hidalgo, F. C. Wang and A. K. Geim, Nature, 2019, 579, 229–232 CrossRef PubMed.
- L. Tsetseris and S. T. Pantelides, Carbon N. Y., 2014, 67, 58–63 CrossRef CAS.
- X. Zhao, S. Villar-Rodil, A. J. Fletcher and K. M. Thomas, J. Phys. Chem. B, 2006, 110, 9947–9955 CrossRef CAS PubMed.
- S. P. Koenig, L. Wang, J. Pellegrino and J. S. Bunch, Nat. Nanotechnol., 2012, 7, 728–732 CrossRef CAS PubMed.
- D. E. Jiang, V. R. Cooper and S. Dai, Nano Lett., 2009, 9, 4019–4024 CrossRef CAS PubMed.
- A. W. Hauser and P. Schwerdtfeger, J. Phys. Chem. Lett., 2012, 3, 209–213 CrossRef CAS.
- R. K. Joshi, P. Carbone, F. C. Wang, V. G. Kravets, Y. Su, I. V. Grigorieva, H. A. Wu, A. K. Geim and R. R. Nair, Science, 2014, 343, 752–754 CrossRef CAS PubMed.
- C. Owais, A. James, C. John, R. Dhali and R. S. Swathi, J. Phys. Chem. B, 2018, 122, 5127–5146 CrossRef CAS PubMed.
- E. Griffin, L. Mogg, G.-P. Hao, G. Kalon, C. Bacaksiz, G. Lopez-Polin, T. Zhou, V. Guarochico, J. Cai, C. Neumann, A. Winter, M. Mohn, J. H. Lee, J. Lin, U. Kaiser, I. V. Grigorieva, K. Suenaga, B. Özyilmaz, H.-M. Cheng, W. Ren, A. Turchanin, F. M. Peeters, A. K. Geim and M. Lozada-Hidalgo, ACS Nano, 2020, 14, 7280–7286 CrossRef CAS PubMed.
- O. Leenaerts, B. Partoens and F. M. Peeters, Appl. Phys. Lett., 2008, 93, 193107 CrossRef.
- J. Yeo, G. S. Jung, F. J. Martín-Martínez, J. Beem, Z. Qin and M. J. Buehler, Adv. Mater., 2019, 1805665, 1–24 Search PubMed.
- J. Kang, Z. Wei and J. Li, ACS Appl. Mater. Interfaces, 2019, 11, 2692–2706 CrossRef CAS PubMed.
- R. H. Baughman, H. Eckhardt and M. Kertesz, J. Chem. Phys., 1987, 87, 6687–6699 CrossRef CAS.
- G. Li, Y. Li, H. Liu, Y. Guo, Y. Li and D. Zhu, Chem. Commun., 2010, 46, 3256–3258 RSC.
- J. Zhou, X. Gao, R. Liu, Z. Xie, J. Yang, S. Zhang, G. Zhang, H. Liu, Y. Li, J. Zhang and Z. Liu, J. Am. Chem. Soc., 2015, 137, 7596–7599 CrossRef CAS PubMed.
- M. Bartolomei, E. Carmona-Novillo, M. I. Hernández, J. Campos-Martínez, F. Pirani, G. Giorgi and K. Yamashita, J. Phys. Chem. Lett., 2014, 5, 751–755 CrossRef CAS PubMed.
- S. W. Cranford and M. J. Buehler, Carbon N. Y., 2011, 9, 4111–4121 CrossRef.
- A. N. Enyashin and A. L. Ivanovskii, Phys. Status Solidi Basic Res., 2011, 248, 1879–1883 CrossRef CAS.
- S. W. Cranford, D. B. Brommer and M. J. Buehler, Nanoscale, 2012, 4, 7797–7809 RSC.
- Y. Yang and X. Xu, Comput. Mater. Sci., 2012, 61, 83–88 CrossRef CAS.
- S. Lin and M. J. Buehler, Nanoscale, 2013, 5, 11801–11807 RSC.
- Y. Jiao, A. Du, M. Hankel, Z. Zhu, V. Rudolph and S. C. Smith, Chem. Commun., 2011, 47, 11843–11845 RSC.
- L. Zhao, P. Sang, S. Guo, X. Liu, J. Li, H. Zhu and W. Guo, Appl. Surf. Sci., 2017, 405, 455–464 CrossRef CAS.
- Z. Meng, X. Zhang, Y. Zhang, H. Gao, Y. Wang, Q. Shi, D. Rao, Y. Liu, K. Deng and R. Lu, ACS Appl. Mater. Interfaces, 2016, 8, 28166–28170 CrossRef CAS PubMed.
- C. Zhu, H. Li, X. C. Zeng, E. G. Wang and S. Meng, Sci. Rep., 2013, 3, 3163 CrossRef PubMed.
- W. J. Nuttall, R. H. Clarke and B. A. Glowacki, Nature, 2012, 485, 573–575 CrossRef CAS PubMed.
- M. Bartolomei, E. Carmona-Novillo, M. I. Hernández, J. Campos-Martínez, F. Pirani and G. Giorgi, J. Phys. Chem. C, 2014, 118, 29966–29972 CrossRef CAS.
- Atomic Weights and Isotopic Compositions for Helium, https://physics.nist.gov/cgi-bin/Compositions/stand_alone.pl?ele=Heisotype=all.
- N. K. Das, H. Chaudhuri, R. K. Bhandari, D. Ghose, P. Sen and B. Sinha, Curr. Sci., 2008, 95, 1684–1687 CAS.
- P. Bernardo, E. Drioli and G. Golemme, Ind. Eng. Chem. Res., 2009, 48, 4638–4663 CrossRef CAS.
- S. Blankenburg, M. Bieri, R. Fasel, K. Müllen, C. A. Pignedoli and D. Passerone, Small, 2010, 6, 2266–2271 CrossRef CAS PubMed.
- J. Schrier, J. Phys. Chem. Lett., 2010, 1, 2284–2287 CrossRef CAS.
- J. Schrier and J. McClain, Chem. Phys. Lett., 2012, 521, 118–124 CrossRef CAS.
- A. M. Brockway and J. Schrier, J. Phys. Chem. C, 2013, 117, 393–402 CrossRef CAS.
- A. W. Hauser, J. Schrier and P. Schwerdtfeger, J. Phys. Chem. C, 2012, 116, 10819–10827 CrossRef CAS.
- M. Lalitha, S. Lakshmipathi and S. K. Bhatia, J. Phys. Chem. C, 2015, 119, 20940–20948 CrossRef CAS.
- X. Liu, X. Chang, L. Zhu and X. Li, Comput. Mater. Sci., 2019, 157, 1–5 CrossRef CAS.
- S. Mandrà, J. Schrier and M. Ceotto, J. Phys. Chem. A, 2014, 118, 6457–6465 CrossRef PubMed.
- M. I. Hernández, M. Bartolomei and J. Campos-Martínez, J. Phys. Chem. A, 2015, 119, 10743–10749 CrossRef PubMed.
- A. Gijón, J. Campos-Martínez and M. I. Hernández, J. Phys. Chem. C, 2017, 121, 19751–19757 CrossRef.
- M. I. Hernández, M. Bartolomei and J. Campos-Martínez, Nanomaterials, 2021, 11, 73 CrossRef PubMed.
- Y. Qu, F. Li and M. Zhao, Phys. Chem. Chem. Phys., 2017, 19, 21522–21526 RSC.
- I. R. Craig and D. E. Manolopoulos, J. Chem. Phys., 2005, 122, 084106 CrossRef PubMed.
- I. R. Craig and D. E. Manolopoulos, J. Chem. Phys., 2005, 123, 034102 CrossRef PubMed.
- S. Habershon, D. E. Manolopoulos, T. E. Markland and T. F. Miller, Annu. Rev. Phys. Chem., 2013, 64, 387–413 CrossRef CAS PubMed.
- Y. V. Suleimanov, F. Javier Aoiz and H. Guo, J. Phys. Chem. A, 2016, 120, 8488–8502 CrossRef CAS PubMed.
- R. Pérez De Tudela, F. J. Aoiz, Y. V. Suleimanov and D. E. Manolopoulos, J. Phys. Chem. Lett., 2012, 3, 493–497 CrossRef PubMed.
- J. O. Richardson and S. C. Althorpe, J. Chem. Phys., 2009, 131, 214106 CrossRef PubMed.
- R. Pérez De Tudela, Y. V. Suleimanov, J. O. Richardson, V. Sáez Rábanos, W. H. Green and F. J. Aoiz, J. Phys. Chem. Lett., 2014, 5, 4219–4224 CrossRef PubMed.
- I. R. Craig and D. E. Manolopoulos, J. Chem. Phys., 2004, 121, 3368–3373 CrossRef CAS PubMed.
- T. F. Miller and D. E. Manolopoulos, J. Chem. Phys., 2005, 122, 184503 CrossRef PubMed.
- I. R. Craig and D. E. Manolopoulos, Chem. Phys., 2006, 322, 236–246 CrossRef CAS.
- T. F. Miller and D. E. Manolopoulos, J. Chem. Phys., 2005, 123, 154504 CrossRef PubMed.
- J. W. Mazzuca and C. P. Schultz, J. Phys. Chem. A, 2017, 121, 819–826 CrossRef CAS PubMed.
- T. E. Markland, S. Habershon and D. E. Manolopoulos, J. Chem. Phys., 2008, 128, 194506 CrossRef PubMed.
- Y. V. Suleimanov, J. Phys. Chem. C, 2012, 116, 11141–11153 CrossRef CAS.
- A. R. Menzeleev, N. Ananth and T. F. Miller, J. Chem. Phys., 2011, 135, 074106 CrossRef PubMed.
- J. S. Kretchmer and T. F. Miller, J. Chem. Phys., 2013, 138, 134109 CrossRef PubMed.
- N. Boekelheide, R. Salomón-Ferrer and T. F. Miller, Proc. Natl. Acad. Sci. U. S. A., 2011, 108, 16159–16163 CrossRef CAS PubMed.
- R. Collepardo-Guevara, Y. V. Suleimanov and D. E. Manolopoulos, J. Chem. Phys., 2009, 130, 174713 CrossRef PubMed.
- Y. V. Suleimanov, R. Collepardo-Guevara and D. E. Manolopoulos, J. Chem. Phys., 2011, 134, 044131 CrossRef PubMed.
- Y. V. Suleimanov, J. W. Allen and W. H. Green, Comput. Phys. Commun., 2013, 184, 833–840 CrossRef CAS.
- S. Bhowmick, D. Bossion, Y. Scribano and Y. V. Suleimanov, Phys. Chem. Chem. Phys., 2018, 20, 26752–26763 RSC.
- Q. Liu, L. Zhang, Y. Li and B. Jiang, J. Phys. Chem. Lett., 2019, 10, 7475–7481 CrossRef CAS PubMed.
- H. Jiang, M. Kammler, F. Ding, Y. Dorenkamp, F. R. Manby, A. M. Wodtke, T. F. Miller, A. Kandratsenka and O. Bünermann, Science, 2019, 364, 379–382 CrossRef CAS PubMed.
- M. Bartolomei, E. Carmona-Novillo, M. I. Hernández, J. Campos-Martínez and F. Pirani, J. Phys. Chem. C, 2013, 117, 10512–10522 CrossRef CAS.
- M. Pitoňák and A. Heßelmann, J. Chem. Theory Comput., 2010, 6, 168–178 CrossRef PubMed.
- W. H. Miller, S. D. Schwartz and J. W. Tromp, J. Chem. Phys., 1983, 79, 4889–4898 CrossRef CAS.
- C. H. Bennett, Molecular Dynamics and Transition State Theory: The Simulation of Infrequent Events, 1977, vol. 46, pp. 63–97 Search PubMed.
- D. Chandler, J. Chem. Phys., 1978, 68, 2959–2970 CrossRef CAS.
- R. Collepardo-Guevara, I. R. Craig and D. E. Manolopoulos, J. Chem. Phys., 2008, 128, 144502 CrossRef PubMed.
- J. Kästner and W. Thiel, J. Chem. Phys., 2005, 123, 144104 CrossRef PubMed.
- J. Kästner and W. Thiel, J. Chem. Phys., 2006, 124, 234106 CrossRef PubMed.
- J. Kästner, J. Chem. Phys., 2009, 131, 034109 CrossRef PubMed.
- H. C. Andersen, J. Chem. Phys., 1980, 72, 2384–2393 CrossRef CAS.
- H. C. Andersen, J. Comput. Phys., 1983, 52, 24–34 CrossRef CAS.
- L. M. Robeson, J. Membr. Sci., 2008, 320, 390–400 CrossRef CAS.
- H. Jiang, X. Tao, M. Kammler, F. Ding, A. M. Wodtke, A. Kandratsenka, T. F. Miller and O. Bünermann, J. Phys. Chem. Lett., 2021, 12, 1991–1996 CrossRef CAS PubMed.
- P. Kapitza, Nature, 1938, 141, 74 CrossRef CAS.
- D. D. Osheroff, R. C. Richardson and D. M. Lee, Phys. Rev. Lett., 1972, 28, 885–888 CrossRef CAS.
- B. Hirshberg, V. Rizzi and M. Parrinello, Proc. Natl. Acad. Sci. U. S. A., 2019, 116, 21445–21449 CrossRef CAS PubMed.
- B. Hirshberg, M. Invernizzi and M. Parrinello, J. Chem. Phys., 2020, 152, 171102 CrossRef CAS PubMed.
Footnote |
| † Electronic supplementary information (ESI) available. See DOI: 10.1039/d1cp02121d |
| This journal is © the Owner Societies 2021 |