 Open Access Article
Electrical properties and charge compensation mechanisms of Cr-doped rutile, TiO2†
Yun
Dang
 a,
Xin Li
Phuah
 b,
Han
Wang
b,
Bo
Yang
b,
Han
Wang
b,
Bo
Yang
 b,
Haiyan
Wang
 bc and
Anthony R.
West
 *a
*a
aUniversity of Sheffield, Department of Materials Science & Engineering, Sheffield S1 3JD, UK. E-mail: a.r.west@sheffield.ac.uk
bPurdue University, School of Materials Engineering, West Lafayette, IN 47907, USA
cPurdue University, School of Electrical and Computer Engineering, West Lafayette, IN 47907, USA
First published on 28th September 2021
Abstract
Cr-doped rutile, Ti1−xCrxO2−x/2−δ, powders and ceramics with 0 ≤ x ≤ 0.05 were prepared by solid state reaction and sintered at 1350 °C. Cr distribution is homogeneous with no evidence of either segregation or crystallographic shear plane formation. For high x compositions, >∼0.01, Cr substitution is charge-compensated ionically by oxygen vacancies with two Cr3+ ions for each vacancy and the materials are electronically insulating. For low x compositions, the materials are semiconducting. This is attributed to a new charge compensation mechanism involving Ti3+ ions created in response to the local electroneutrality requirement for two trivalent cations to be in close proximity to each oxygen vacancy. At very low dopant concentrations, ≪0.01, the dopants are well-separated and instead, some Ti3+ ions act as a second dopant to preserve local electroneutrality. For intermediate x compositions, a core–shell structure is proposed consisting of semiconducting grain interiors containing Ti3+ ions surrounded by a more insulating shell with Cr3+ ions as the only acceptor dopant. Lattice parameters show unusual, non-linear Vegard's law behaviour characterised by a maximum in cell volume at intermediate x ∼ 0.005, that is attributed to the composition-dependent presence of Ti3+ ions.
1 Introduction
Rutile, TiO2 is an important functional material that has a wide variety of applications associated with its electrical properties which range from insulating to semiconducting, depending on dopants and defect structure. The thermodynamics of point defect equilibria in pure and doped rutile are well-documented1–3 but in addition, extended defects are present in many materials associated with crystallographic shear (CS) planes and their ordered arrangements in the homologous series of Magnéli phases.4–6TiO2 loses a small amount of oxygen spontaneously at high temperatures and this deficiency may either be preserved by quenching or eliminated by annealing at lower temperatures.7 Consequently, the electrical properties at room temperature depend very much on sample processing history, particularly the temperature and atmosphere during heating and the subsequent cooling rate.7,8 The lattice parameters at room temperature of quenched oxygen-deficient rutile show markedly non-linear Vegard's law behaviour.9 A change from chemical expansion to chemical contraction occurs with increasing oxygen loss. The reasons for this are not well-understood but may be associated with the formation of CS planes with increased oxygen deficiency.4,9
The aim of the present work was to determine how the electrical properties of rutile change in materials that have Cr3+ added as an acceptor (lower valency) dopant. If charge compensation is by means of oxygen vacancy creation, then insulating behaviour, with the possibility of some oxide ion conduction may be expected. If additional oxygen loss occurs during high temperature synthesis, then n-type electronic conductivity may be expected. Charge compensation for acceptor dopants sometimes involves hole creation and associated p-type electronic conduction is a possibility if oxygen atoms in the rutile lattice are redox-active. Also, the resulting structures may be electrically heterogeneous or homogeneous depending on the distribution of dopants and oxygen vacancies.
At present, there is little information in the literature on how electrical properties change on addition of an acceptor dopant such as Cr3+ and/or as a consequence of different processing conditions. Here, we use impedance spectroscopy to investigate the electrical properties and electrical homogeneity of samples; by also making measurements in atmospheres of different oxygen partial pressure, pO2, we gain information on the nature of conducting species, the doping mechanisms and associated defect structures. This is complemented by transmission electron microscopy to look for the presence of CS planes and determine the homogeneity of Cr dopant distribution.
2 Experimental
Samples of Ti1−xCrxO2−x/2−δ (x = 0, 0.0002, 0.001, 0.002, 0.004, 0.005, 0.006, 0.008, 0.01, 0.015, 0.02, 0.03 and 0.05) were prepared by solid state reaction using TiO2 (Sigma-Aldrich, 99.9%) and Cr2O3 (Johnson Matthey, 99%) which were dried prior to weighing at 900 °C and 600 °C, respectively. These were mixed in small quantities (1–2 g) in a mortar and pestle for ∼30 min, with acetone added periodically to form a paste. For most compositions, sample size was 1–2 g, but for those with smallest Cr content, samples up to 10 g were prepared and contained at least 1 mg Cr2O3 which was weighed out using a balance with 0.1 mg sensitivity. The possible impurities in the Cr2O3 reagent were the oxides of Al, Fe, Ca and Na with a total concentration of <1% of the Cr2O3 content. On reaction with TiO2, they may all be regarded as lower valence acceptors, similar to Cr. They would, therefore, be expected to have a similar effect to Cr on the doping mechanisms and associated electrical properties of TiO2 but to a much lesser extent because their concentration was <1% of the Cr content in each composition.The dried powders were heated in Pt boats at 1350 °C for 8 h in air, followed by a slow cool (5 °C min−1) inside the furnace. For electron microscopy and electrical property measurements, pellets (10 mm diameter and 1–2 mm thick) were prepared by either uniaxial pressing or cold isostatic pressing and fired at 1350 °C for 8 h to give a final density of ∼90%.
Powder X-ray Diffraction (PXRD) used a Siemens D5000 Diffractometer with a linear position-sensitive detector. Lattice parameters were determined by least-squares refinement for reflections in the range 10 < 2θ < 80°, using the software WinXPow version 2.10, and an internal Si standard. For electron microscopy, pellets were sectioned, mechanically ground and dimpled, followed by ion polishing in a precision ion milling system (PIPS II, Gatan) to give electron transparency. Transmission electron microscopy (TEM) was performed on an FEI TALOS F200X TEM/STEM with ChemiSTEM technology (X-FEG and SuperX EDS with four silicon drift detectors) at 200 kV.
For electrical property measurements, electrodes were fabricated on opposite pellet faces using Pt paste that was decomposed and hardened by heating to 900 °C for 2 h. Samples with electrodes attached were placed in a conductivity jig inside a horizontal tube furnace. Impedance measurements were made in either air, N2 or O2 using a combination of Modulelab XM Solartron and Solartron SI 1260 instrumentation over the frequency range 0.1 Hz to 1 MHz with an ac measuring voltage of 100 mV. For measurements in N2, the pO2 inside the conductivity rig was not measured but was estimated to be in the range 10−2 to 10−3 atm O2. Impedance data were corrected for overall pellet geometry and resistance values are reported in units of Ohm cm. Bulk resistivities correspond fairly well to measured sample resistances, therefore, but no additional geometrical correction was applied to the grain boundary resistance data to convert them to grain boundary resistivities. Data were also corrected for the blank capacitance of the empty conductivity jig and the inductance of the leads measured with the jig on closed circuit.
Oxide ion transport numbers were estimated using a Probostat system. A 20 mm-diameter pellet made by uniaxial pressing at 50 MPa followed by cold isostatic pressing at 200 MPa was sintered, coated with Pt electrodes on both sides and sealed over the end of an open, yttria stabilised zirconia, YSZ tube by a glass frit. The YSZ tube also had Pt contacts on both sides to act as a pO2 sensor and to confirm the leak-free nature of the experimental set-up. The atmosphere outside the YSZ tube was air with flowing O2 inside the tube. The voltage between inner and outer sample electrodes was measured and compared with the voltage across the YSZ tube to estimate the oxide ion transport number. Voltages were measured by a Keithley 175 Autoranging Multimeter in the range 600 to 800 °C.
3 Results and discussion
3.1 X-ray diffraction, TEM and possible doping mechanisms
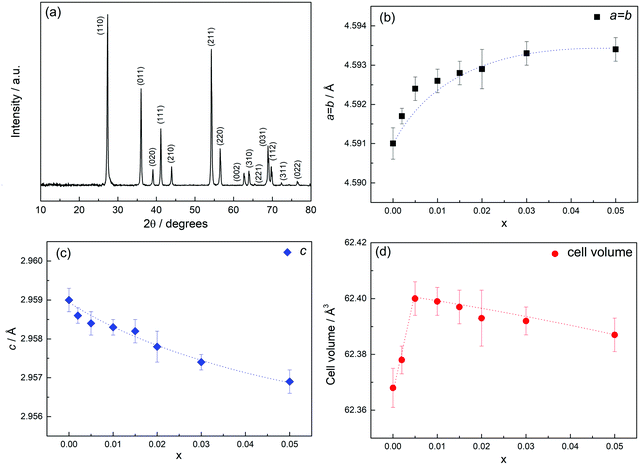 | ||
| Fig. 1 (a) PXRD pattern of composition x = 0.01 sintered in air followed by slow cooling, (b–d) lattice parameters and cell volume against x. | ||
Unit cell parameters obtained by least squares refinement of the d-spacings of the first 11 lines are shown in Fig. 1(b–d) as a function of x. For the composition range 0 ≤ x ≤ 0.05, a increases, c decreases and the cell volume passes through a maximum at x = ca. 0.005. This non-linear behaviour is very different from the linear Vegard's Law response typically seen in oxide solid solutions but is somewhat similar to that reported previously for undoped rutile, TiO2−δ quenched from different temperatures.9 (Those samples had different degrees of oxygen deficiency δ; the cell parameters and cell volume all passed through maxima at intermediate values of δ9). Data in Fig. 1(d) show a small overall increase in volume between x = 0 and x = 0.05; superposed on this is the maximum at intermediate compositions peaking around x = 0.005.
 | ||
| Fig. 2 (a) Bright-field TEM image of sample x = 0.006. (b) STEM image under HAADF conditions of a grain boundary and the corresponding Cr elemental mapping in (c). | ||
Fig. 2(b) shows the scanning transmission electron microscopy (STEM) image under high angle annular dark-field (HAADF) conditions and the corresponding Cr elemental mapping in Fig. 2(c). The Cr distribution throughout the grains was homogeneous and continuous across grain boundaries with no evidence of depletion or accumulation. This showed that the reaction conditions yielded products with a uniform cation distribution. It is highly likely, therefore, that samples were in thermodynamic equilibrium at the sintering temperature.
The homogeneity of the Cr distribution shown in Fig. 2(c) would perhaps be remarkable if it occurred by a mechanism dominated by slow, solid state inter-diffusion processes. However, a vapour phase transport mechanism may have been responsible in which the transporting agent was volatile CrO3, formed by reaction of Cr2O3 with O2. Such a mechanism was proposed for the reaction of NiO and Cr2O3 to form NiCr2O4.14
 in Kroger–Vink notation), electrons and holes, for which the overall electro-neutrality condition is:
 | (1) |
The simplest ionic compensation mechanism on substitution of Ti4+ by Cr3+ on the octahedral sites would involve oxygen vacancy creation with the formula:
| Ti1−xCrxO2−x/2 | (2) |
| Ti1−2δ4+Ti2δ3+O2−δ | (3) |
| Ti1−x−2δ4+Crx3+Ti2δ3+O2−x/2−δ | (4) |
An additional electronic mechanism of charge compensation for the acceptor dopant Cr3+ is the possibility of hole creation. If the holes are localised on an atomic species rather than delocalised in a conduction band, the possible locations are on: (i) Ti4+, (ii) Cr3+, (iii) O2−, (iv) unidentified impurity cations. As discussed later, we find evidence for p-type conductivity in some compositions and believe that (iii) is the only realistic possibility for location of holes in the present materials. A general formula that involves holes on oxygen, ideally as O− ions, is:
| Ti1−y4+Cry3+O2−y2−Oy− | (5) |
However, this does not involve oxygen vacancy creation to compensate for the substitution of Cr3+ and indeed, would require oxygen uptake by the TiO2/Cr2O3 reaction mixture. A second possibility is internal redox electron transfer:
| O2− + Ti4+ ↔ O− + Ti3+ | (6) |
 | (7) |
The reason why a lattice oxide O2− ion may ionise readily to form O− is attributed to the under-bonding that results on substitution of an adjacent Ti4+ ion by a lower valence acceptor, i.e., Ti3+ or Cr3+, as discussed for creation of p-type conductivity in acceptor-doped BaTiO3.15,16 Oxide ions at sample surfaces and interfaces may also be similarly under-bonded because they are not surrounded by the full complement of positive charge required for local electro-neutrality.
We see no evidence for the need to consider that Cr may change its valence in the doped materials, especially to create Cr4+. CrO2 itself has the rutile structure and has a high electronic conductivity but its synthesis requires oxidising conditions and it is not thermally stable. The composition-dependence of electrical properties would not be explained readily by the presence of Cr4+dopant.
We had considered, initially, the possibility that CS plane formation may have been responsible for the reduction in cell volume for x > ∼0.005, Fig. 1(d). The absence of CS planes in the TEM results enables us to discount this possibility and therefore, to exclude CS plane formation from consideration of possible doping mechanisms and defect formation. We consider that the anomalous change in lattice parameters, Fig. 1, involves initially a lattice expansion as Ti3+ ions are created in response to the need to preserve local electroneutrality. As the Cr3+ content increases further, there is less need for the double doping mechanism of charge compensation and as δ → 0 with increasing x, the Ti3+ content also decreases to zero. Octahedral Cr3+ ions are of similar size to Ti4+; the creation of O− ions may involve a small reduction in cell volume since O− ions are likely to be smaller than O2− ions. Since Ti4+ ions are substituted exclusively by Cr3+ at larger x values, together with the creation of oxygen vacancies, an overall reduction in electrostatic attraction and (Ti,Cr)–O bond strength is expected and may explain the small increase in cell volume between x = 0 and x = 0.05 shown in Fig. 1(d), superposed on which is the maximum associated with the presence of Ti3+ ions at intermediate values of x.
An additional factor that may affect the compositional dependence of lattice parameters is the formation of defect complexes. Two broad categories of departure from linear Vegard's Law behaviour involve either a tendency to defect clustering and a net reduction in cell parameters or a tendency to phase separation leading to an effective increase in cell parameters.17 A well-studied example of the first category is Gd-doped CeO2 with the fluorite structure, for which defect clustering at high Gd contents leads to smaller cell parameters than those expected for a random defect distribution.18,19 In Cr-doped TiO2, while the presence of Ti3+ ions is thought to be the main cause of anomalous cell parameter changes at low x, other factors such as cluster formation by the association of oppositely charged defects and/or the apparent two-phase nature of a range of low x compositions, may complicate the overall composition- dependence of the cell parameters and also influence the concentration of mobile charge carriers.
3.2 Impedance data
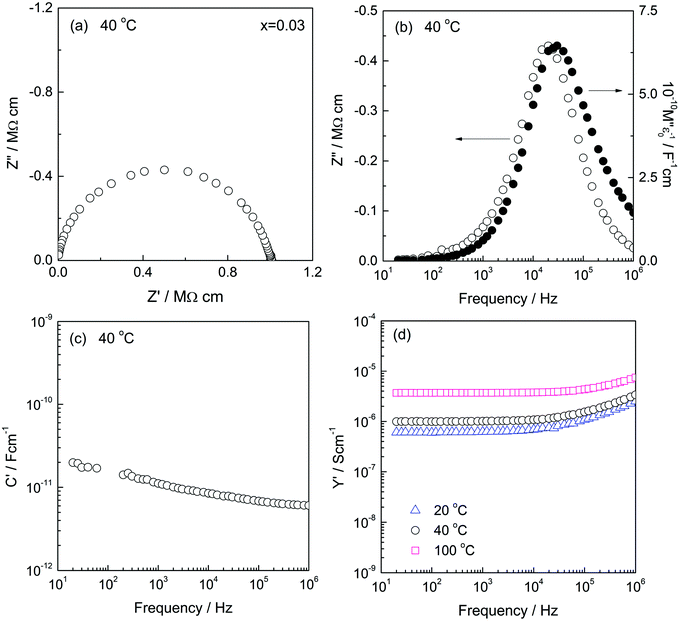
Impedance data were collected for 13 compositions with x values in the range 0 ≤ x ≤ 0.05. Most measurements were made in air over the temperature range 25 to 550 °C. The data fall into two groups, 0 ≤ x ≤ 0.008 (low x) and 0.01 ≤ x ≤ 0.05 (high x). A typical set of data for each, with x = 0.002 and 0.03, is shown in Fig. 4 and 6; representative data for all samples and temperatures are given in ESI,† Fig. S1–S11.Initial evaluation of all data sets showed them to be consistent with the idealised master circuit shown in Fig. 3 that contains four components in series, although all four components were never observed simultaneously in a given data set. For low x samples, this was due to limitations of the available frequency range, 0.1 to 106 Hz, whereas for high x samples, not all components appeared to be present. For accurate fitting of the data, it was necessary to add one or more constant phase element, CPE, to the parallel RC elements representing each component, as discussed later. To aid presentation of the data and discussion of the results, we first describe some general features of the data and draw initial conclusions.
The four components were characterised by their capacitance values with C1 < C2 < C3 < C4 from which, the initial assignments made were as follows. C1 and C2 appear to be bulk components with volume fractions dependent on overall composition. C3 appears to be a typical grain boundary capacitance. C4 is a sample–electrode contact capacitance. Each component can be represented in the first instance by an ideal, parallel RC element and these are connected in series in Fig. 3.
A useful parameter in data analysis is the time constant, τ, of each component, given by the RC product, τ = RC. τ is an intrinsic property of an RC element since it is independent of the geometry and dimensions of the region responsible, i.e., τ = RC = ρε, where ρ and ε are the resistivity and permittivity of the region. This means that, for instance, all the electrically homogeneous grains in a ceramic material would have the same τ value, independent of any variation in grain size. For convenience, we label the four components by their τ values, τ1 to τ4.
Impedance data can be presented in four complex formalisms: impedance, Z*, modulus, M*, admittance, Y* (or A*) and permittivity, ε*,20 which are inter-related by:
| Z* = (Y*)−1 | (8) |
| M* = jωC0Z* | (9) |
| ε* = (M*)−1 | (10) |
| Y* = jωC0ε* | (11) |
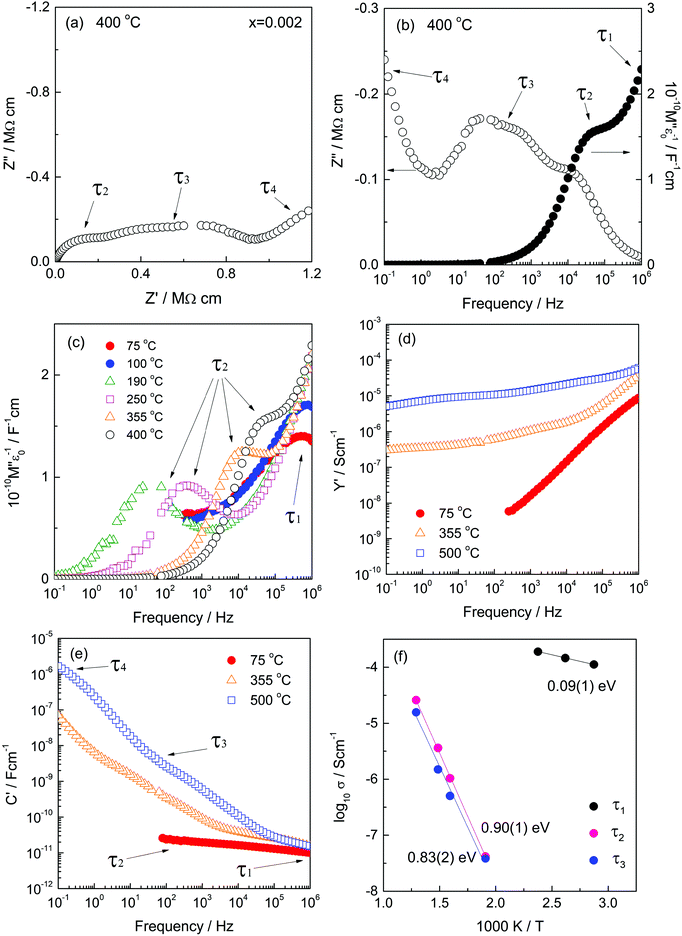
The impedance complex plane plot, Z*, Fig. 4(a), shows three features with two broad, overlapping arcs at higher frequencies and an inclined spike at the lowest frequencies; these are attributed to components τ2 to τ4. Evidence for a fourth component τ1 is seen in the M′′ plot (b) at highest frequencies. Data are shown at 400 °C and include all the features seen at other temperatures. C′ plots (e) show plateaux, often poorly-resolved, from which capacitance values can be obtained and assignments to sample characteristics made. Thus, the low frequency spike in (a) with capacitance >1 μF is attributed to the sample–electrode impedance, τ4. The lower frequency arc in (a) with capacitance ∼2–3 nF, (e), is attributed to the grain boundary impedance, τ3. The higher frequency arc with capacitance ∼50 pF, is attributed to a minor bulk component, τ2. The main bulk component, τ1, is hidden in the Z* complex plane plot close to the origin in (a) since the value of R1 is several orders of magnitude smaller than R2 and R3, (f), but is seen in the corresponding M′′ plot (b). Element τ1 has the smallest capacitance and is attributed to highly conducting grain cores. The total sample resistance, (R1 + R2 + R3), is given by the intercept of either the combination of arcs at low frequencies, or the spike, on the Z′ axis.
M′′ plots for a selection of temperatures are shown in (c); the peak maximum for τ1 is seen at the lowest temperatures, but this moves off-scale with increasing temperature at the same time as the peak maximum for τ2 appears on-scale at lower frequencies. There is no evidence of peak τ1 in either the Z′′ or Z* plots because its resistance is too small to be seen clearly on the linear Z′/Z′′ scales that are used, but the peak for τ2 is seen at similar frequencies in both Z′′ and M′′ plots (b). In summary, all four components are seen in the combined M′′/Z′′ plots: the high capacitance components τ3 and τ4 are too small to see in M′′ whereas the high conductivity component, τ1 is too small to see in Z′′ and Z*.
Plots of log![[thin space (1/6-em)]](https://www.rsc.org/images/entities/char_2009.gif) Y′ vs. log
Y′ vs. log![[thin space (1/6-em)]](https://www.rsc.org/images/entities/char_2009.gif) f, (d), support these conclusions. They give a wide, poorly-defined plateau for τ2 and/or τ3 at 355 and 500 °C; at 75 °C, a large high frequency dispersion towards much higher conductivity values dominates the presentation, leading to the likelihood of a high frequency plateau associated with τ1 that is off-scale. The implication from this, and the high frequency peaks in M′′ plots, is that the sample grains contain a conductive core, τ1, in series with more resistive components τ2 and/or τ3.
f, (d), support these conclusions. They give a wide, poorly-defined plateau for τ2 and/or τ3 at 355 and 500 °C; at 75 °C, a large high frequency dispersion towards much higher conductivity values dominates the presentation, leading to the likelihood of a high frequency plateau associated with τ1 that is off-scale. The implication from this, and the high frequency peaks in M′′ plots, is that the sample grains contain a conductive core, τ1, in series with more resistive components τ2 and/or τ3.
The C′ spectroscopic plots (e) show the same four main features τ1 to τ4 and their magnitudes help greatly in assigning them to sample characteristics. The broad low frequency dispersion in C′ levels off at still lower frequencies, as shown more clearly for x = 0.001 in Fig. S3(d) (ESI†), and is a characteristic feature of a blocking capacitance associated with oxide ion conduction. The inflexion around 2–3 nF is attributed to a grain boundary capacitance, τ3. The plateau around 40 pF, attributed to τ2 and seen most clearly at 355 °C, is too small to be a typical grain boundary component and instead, is attributed to a secondary bulk component. The gradual decrease at highest frequencies with a limiting capacitance of ∼8 pF seen at 75 °C and more clearly for x = 0.005 in Fig. S5(d) (ESI†), is attributed to τ1, the main bulk component.
The data sets in the low x range 0.0002 ≤ x ≤ 0.008, including Fig. 4, are unusual in showing evidence of two frequency-independent regions that have small capacitance values: ∼8 pF (C1) and ∼40 pF (C2) for x = 0.002, but whose values change with x. Such low values are typical of components that occupy a large volume fraction of the sample. A value of 8 pF, corresponds to a permittivity of ∼90 (from the relation ε′ = C/e0, where e0 is the permittivity of free space, 8.854 × 10⁻¹⁴ F cm−1) and is typical of rutile-based materials. τ1 therefore, is the main bulk component. For composition x = 0.002, the value of component C2 represents a second bulk component, τ2 that occupies approximately 20% of the sample volume.
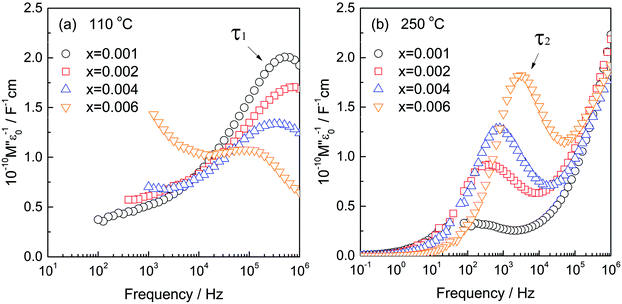
Both components C1 and C2 are seen in low x compositions and capacitance C1 increases at the same time that C2 decreases with increasing x. This is shown by the change in relative heights of the two M′′ peaks, Fig. 5, that represent τ1 and τ2 and have an opposite dependence of peak height on composition, x. Specifically, peak τ1 is the main peak at low x, 0.001, (a) but is gradually replaced by peak τ2 as the composition increases to x = 0.006, (b). M′′ peak height depends inversely on capacitance (for an ideal parallel RC element, Mmax′′ = e0/2ε′) and therefore, is approximately proportional to volume fraction. We conclude from Fig. 5 that component τ1 has a composition x < 0.001 which is very close to that of undoped rutile but contains an essential, small amount of Cr dopant. Component τ2 has a composition estimated as x = 0.009(1), which corresponds to replacement of <1% Ti by Cr. The resistances of components τ1 and τ2 have very different activation energies, as shown in Fig. 4(f); resistances were obtained from the frequency maxima of M′′ spectroscopic plots at which, ideally, the relation 2πfRC = 1 holds. R1 has a small activation energy, 0.09(1) eV, consistent with the much higher conductivity of region τ1. Further discussion of activation energies and conductivities of all compositions is discussed later.
Electrically, therefore, low x compositions appear to be two-phase. By contrast, high x compositions appear to be single phase: C′ data show evidence for only a single bulk capacitance in high x compositions, x ≥ 0.01, Fig. 6, discussed next.
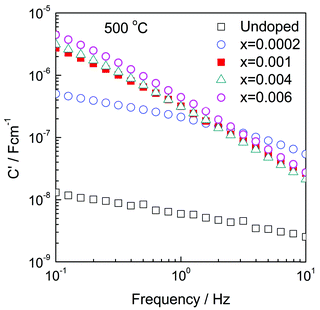
First, C′ data for some low x compositions are shown in Fig. 7. We interpret their magnitude, which increases with increasing x in the range 0.0002–0.006 and with decreasing frequency, to indicate a certain amount of ionic conduction. For materials that are exclusively ionic conductors, a double layer capacitor is created at the sample–electrode interface whose magnitude depends on contact area and sample–electrode separation with typical value around 1 × 10⁻⁵ F cm−1. On the other hand, for conduction that is exclusively electronic, the contact capacitances are small, associated instead with the rough nature of sample–electrode interfaces and double layer capacitance phenomena are not seen in impedance data.
For sample x = 0.0002, the C′ values, e.g., 500 nF at 0.1 Hz, Fig. 7, are attributed to a combination of a double layer capacitor in parallel with an electronic pathway across the sample–electrode interface. This value of C′ increases with x to reach a maximum of ∼5 μF for x = 0.006 and continues with a high value through composition x = 0.008. For higher x values, however, C′ decreases, but is still high in e.g., x = 0.02 at 300 °C, Fig. S10(c) (ESI†). At these high x compositions, the materials show increased electronic conductivity, Fig. 10, leading to reduction in the effective transport number of oxide ions and significance of the blocking double layer capacitance.
The initial conclusion, therefore, is that the Cr-doped rutile samples are mixed conductors in which the oxide ion component arises as a consequence of the mechanism of Cr doping which involves oxygen vacancy creation, mechanisms (2)–(4). Both regions τ1 and τ2 are mixed conductors, but the transport numbers are composition-dependent.
Second, confirmation that the ionically conducting component in regions τ1 and τ2 is due to oxide ions was obtained from EMF measurements over the temperature range 600–800 °C for a cell that had air and O2 in contact with opposite faces of a pellet of x = 0.005; EMF data are compared with those for YSZ in Fig. 8, from which approximate oxide ion transport numbers in the range 0.02–0.06 were obtained. These transport numbers should be treated with care since the sample of x = 0.005 contained both regions τ1 and τ2 whose transport numbers are likely to be different, as well as the grain boundary region, τ3 and therefore, the transport data may depend on sample microstructure as well as composition. There is also the possibility of some residual porosity, either in the 90% dense ceramic, or associated with the seals, that may act to reduce the oxide ion transport numbers.
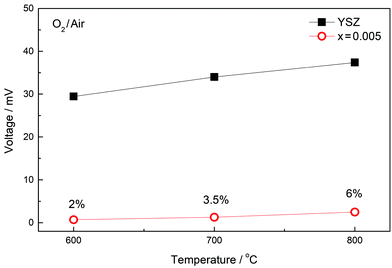 | ||
| Fig. 8 EMF measurement of composition x = 0.005 at various temperatures; data for YSZ are also shown. | ||
Third, impedance measurements in atmospheres of different pO2 showed clear evidence of electronic conductivity, both n-type and p-type, depending on composition:
(a) In undoped rutile, the electronic conduction is primarily n-type. Impedance measurements showed a decrease in resistance with decreasing pO2, in the sequence: O2 → air → N2, Fig. 9(a). This is attributed to loss of O2 from sample surfaces and release of electrons according to:
| 2O2− ↔ O2 + 4e′ | (12) |
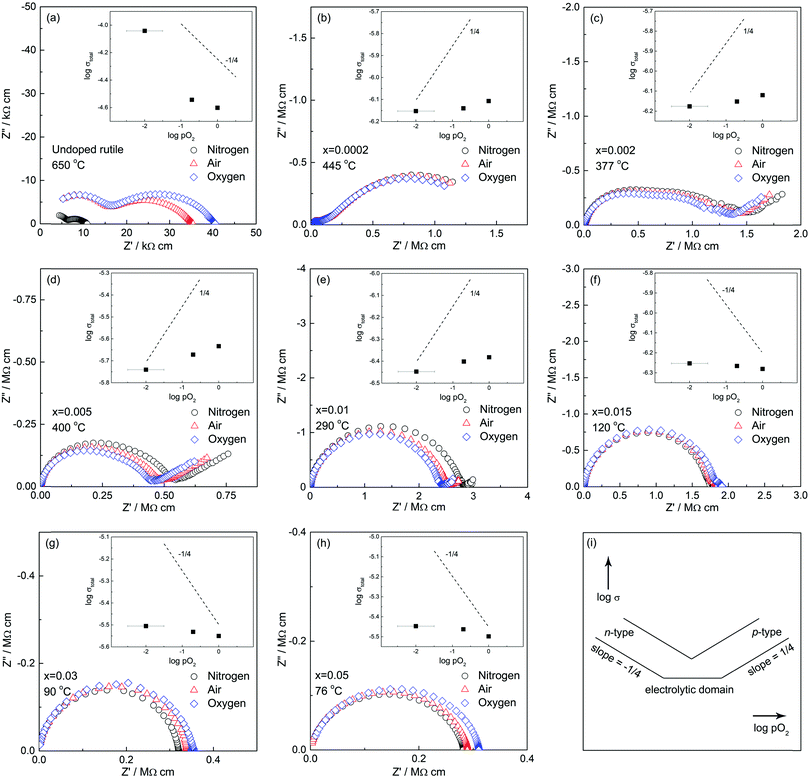 | ||
| Fig. 9 (a–h) Effect of atmosphere on the impedance of pure and Cr-doped TiO2 and (i) schematic dependence of conductivity on atmosphere. | ||
(b) With x = 0.0002, Fig. 9(b), impedance data show almost no dependence on pO2, but with increasing x: 0.002 (c), 0.005 (d) and 0.01 (e), the data show p-type behaviour in which the resistance decreases with increasing pO2. In such cases, holes are created by the absorption and dissociation/ionisation of oxygen molecules, eqn (7). The system is then in the p-type domain, (i), with a slope, ideally, of +1/4; the evidence for p-type behaviour is seen most clearly in (d) for x = 0.005. This pO2 dependence refers to the total sample resistance. It clearly applies to region τ2 but is not known whether it also applies to the grain cores, τ1.
(c) At still higher x: 0.015 (f), 0.03 (g) and 0.05 (h), the behaviour appears to return to n-type but the variation with pO2 is small, unlike that shown by undoped rutile, and may therefore have a different explanation.
The data shown in Fig. 9 cover a wide range of Cr contents but also a wide range or measuring temperatures. In this discussion, we focus on the pO2-dependence but recognise that a more extensive study of the effect of temperature is required to obtain a complete picture of the transition between the different conductivity regimes and also to separate the behaviour of regions τ1 and τ2.
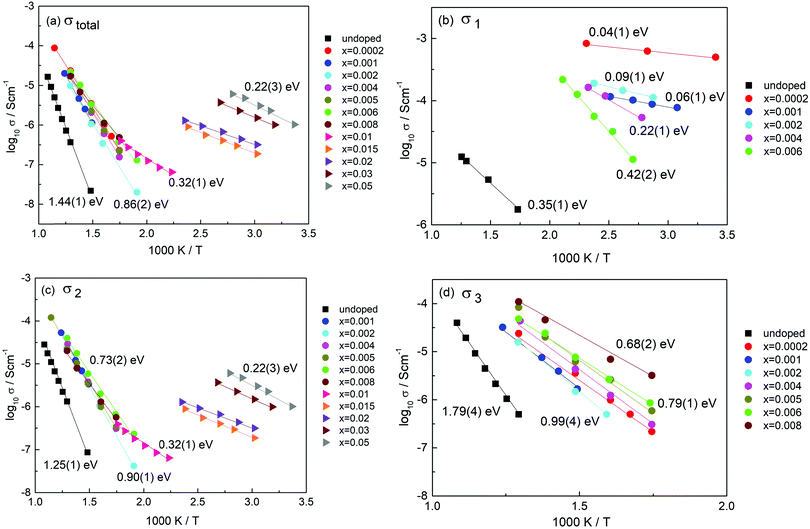
The remarkable transition from n-type to p-type conductivity with increasing Cr content may be rationalised as follows. Undoped rutile is, as-expected, n-type if there is a residual deficiency of oxygen in the samples after sintering, Fig. 9(a). The dramatic rise in electronic conductivity of region τ1 on addition of Cr3+ was, however, unexpected: the conductivity σ1 at very low x is many orders of magnitude higher than that of undoped rutile prepared under the same conditions and has much smaller activation energy, Fig. 10(b). It is attributed to double doping by Ti3+ and Cr3+ and therefore, to a large increase in n-type electron content associated with the Ti3+ ions.
As a consequence of doping Cr3+ and Ti3+ into the rutile lattice, the number of oxygen vacancies exceeds greatly the number associated with oxygen loss at high temperatures. Under these conditions, the defect equilibria associated with oxygen loss from un-doped rutile are modified by the additional mechanism, associated with the co-dopant Ti3+ ions, that controls both the oxygen vacancy content and the electron content. The n-type conductivity and probably the Ti3+ content, pass through a maximum around x = 0.0002. At higher x, the oxygen vacancy content increases further, but (i) the Ti3+ content decreases and (ii) there is increasing absorption of atmospheric oxygen by the vacancies giving rise to holes on oxygen, eqn (7). Consequently, there is a gradual change from n-type behaviour associated with the decreasing number of Ti3+ ions to p-type behaviour associated with the increasing number of O− ions. It is quite common for materials that have oxygen vacancies to absorb O2 and show p-type conductivity.16,21 We do not know whether this is a major equilibrium reaction at high temperatures or is promoted by oxygen uptake during cooling.
The electronic conductivity that results is therefore a combination of n-type conduction associated with the residual Ti3+ content and hole conductivity associated with O−. No pO2 dependence is seen for x = 0.0002 but this may be because σ1 is too high, ≤10−3 S cm−1 to be sensitive to small changes in electron concentration caused by changes in pO2 at sample surfaces. For x in the range, 0.002 to 0.01, the value of σ1 decreases significantly, Fig. 10(b), but also the volume fraction of region τ1 decreases and at the same time, that of τ2 increases, Fig. 4(c) and 5. Regions τ2 and τ3 dominate the impedance data for this composition range and the pO2-dependence indicates that these regions are p-type, Fig. 9.
Data for σ1 are shown in (b); these cover the composition range below x = 0.01 since component τ1 is not detected at higher Cr contents. The conductivity is greatest and the activation energy least for the composition with the lowest Cr content, x = 0.0002. The values of the Arrhenius parameters change systematically with increasing x: conductivity decreases and activation energy increases.
These doped conductivities, σ1 are all very much greater than that of un-doped rutile pellets prepared under the same conditions, (b). The conductivity of undoped rutile is extremely sensitive to oxygen loss and the associated presence of Ti3+ ions, as shown by samples quenched from different temperatures whose conductivity can vary by many orders of magnitude.7 The activation energy is also a good indicator of oxygen deficiency, although a quantitative scale of activation energy vs. δ has not been established. The value of 0.35(1) eV for undoped rutile, (b), is similar to what would be expected for a sample quenched after heating in air at 800 °C.7 Since the rutile pellet used here was furnace-cooled after sintering at 1350 °C, it appears that the pellet core, τ1, had maintained equilibrium with the furnace atmosphere down to ∼800 °C but that a residual oxygen deficiency remained in the pellets at the end of the cooling cycle.
We attribute the dramatic increase in conductivity of component τ1 for x = 0.0002, (b), to the presence of Ti3+ as a co-dopant on Cr doping. The condition that 2x = δ applies at very low x because each substitutional Cr3+ ion requires one associated Ti3+ ion in order to charge-compensate for one oxygen vacancy. As x increases beyond 0.0002, δ becomes increasingly smaller than x as the mechanism gradually changes to (2) until finally, δ = 0 at x = ∼0.01; at this point there appears to be no Ti3+ co-dopant present. If we regard the conduction electrons associated with Ti3+ as polarons, the polaron size may decrease with x at the same time as their number decreases, thus accounting for both the decrease in conductivity and increase in activation energy with increasing x.
Conductivity data for σ2 are shown in Fig. 10(c). For the low x compositions, 0.001–0.008, data are similar with activation energy in the range 0.73(2) to 0.90(1) eV. The general similarity in the data for σtotal and σ2, a and c, indicates that region τ2 controls the overall impedance for most compositions. An abrupt change occurs between x = 0.008 and 0.01, at which point σ2 becomes the main bulk conductivity and has values that increase with x although all have a similar, small activation energy of ∼0.25 eV. Composition x = 0.01 is at the cross-over between the low x and high x conductivity regimes for σ2, which are characterised by activation energies of approximately 0.73 and 0.22 eV, respectively. In the low x range, it appears that conductivity σ2 is a mixture of p-type and ionic although the ionic conductivity component may not be high enough to impact significantly the measured values and activation energy.
For the high x compositions, conduction is also mixed, but appears to change from p-type to n-type around x = 0.01–0.015, Fig. 9; some residual oxide ion conductivity is still seen at x = 0.02, as shown by high capacitance at low frequency and high temperature in Fig. S10(c) (ESI†). The constancy of the activation energy of σ2 for different compositions in the high x region implies a single predominant conduction mechanism, in which an increase in carrier concentration is responsible for the increase in conductivity with increasing x. We therefore attribute this to a mechanism associated with the Cr3+ ions. The variation of conductivity with atmosphere in this region may arise because some of the O− ions absorbed by oxygen vacancies desorb with decreasing pO2, giving rise to apparent n-type conductivity, but from the small dependence of conductivity on pO2 shown in Fig. 9(f–h), this is not the main source of the conductivity; further work is required to understand that result.
Conductivity data for σ3 are shown in Fig. 10(d). There is a gradual increase in conductivity with x, although the data for x = 0.0002 are somewhat out of line with this trend. From its capacitance value, τ3 appears to be a grain boundary component that has significant ionic conductivity since region τ3 is not seen for high x compositions which are mainly electronic conductors. The activation energy for τ3 is in the range 0.68(2) to 0.99(4) eV and probably represents mixed conductivity. The similarity in conductivities and activation energies of τ2 and τ3, such as shown in Fig. 4(f), indicates a strong similarity in the nature of the two regions; possibly, τ3 represents a constriction impedance between grains in samples that are not fully dense;22 alternatively, it may be due to a space charge layer that develops if there is an in-balance between defect distributions throughout the τ2 grains.
The second component, τ2 has composition x = 0.009(1) and has a more modest level of semi-conductivity compared to component τ1. Electrically, τ2 with composition x = 0.009(1) is the end-member of a range of homogeneous solid solutions extending to x = 0.05 and perhaps beyond whose conductivity is controlled by the Cr content and is mainly electronic with a small amount of oxide ion conductivity. Composition x = 0.009(1) represents the composition at which there is sufficient Cr3+ present to avoid the need for the additional double substitution mechanism of charge compensation; it corresponds to substitution of ∼1% of the Cr acceptor dopant into the rutile structure.
For the range of compositions 0.0002 ≤ x ≤ 0.009, the impedance data and the equivalent electrical circuit, Fig. 3 that represents the data, indicate that τ1 and τ2 are in series. This is especially clear since the conductivity of τ1 is many orders of magnitude greater than that of τ2 and therefore, there is no percolation conduction pathway through regions τ1 alone. The conclusion is that, in this composition range, a core–shell structure exists with a highly conducting grain core, τ1 surrounded by a resistive shell, τ2. The relative thicknesses of core and shell regions depend on composition x. Region τ3 is identified as either a typical grain boundary or a space charge layer from the magnitude of its capacitance and appears to be a modest conductor of oxide ions and p-type electrons.
There is no evidence that the region 0.0002 ≤ x ≤ 0.009 is a traditional two-phase region in which the two components have the specified end-member compositions. Thus, there is no evidence of Cr segregation from the TEM results and therefore, the Cr contents appear be the same in core and shell regions for a given sample. Instead, the two components may be distinguished by their mechanism of charge compensation. This also accounts for the variation with x of conductivity and activation energy for region τ1 with the implication that the composition of τ1 changes although it is in a region that, electrically, is two-phase.
4 Conclusions
Synthesis of Cr-doped rutile was carried out by solid state reaction. A single-phase product with general formula, Ti1−xCrxO2−x/2−δ with homogeneous distribution of Cr was obtained; the synthesis may have been facilitated by vapour phase transport of Cr with volatile CrO3 as a transporting agent.The defect structure and electrical properties of Cr-doped rutile are remarkably dependent on composition. Lattice parameters show very non-linear composition-dependence. The main substitution mechanism involves oxygen vacancy creation, but to achieve local charge balance, each oxygen vacancy requires two trivalent acceptor dopants. At very low Cr contents, the statistical distribution of Cr3+ ions does not allow two Cr3+ ions to be present near each oxygen vacancy; instead, it is proposed that Ti3+ acts as an additional acceptor dopant, even though Ti3+ ions are not expected to be present under oxidising synthesis conditions. There are two variables in the expanded formula,  , the Cr content, x and oxygen loss, δ associated with Ti3+ ions. At the lowest x studied, 0.0002, ideally δ = 2x, but with increasing x, δ decreases and is zero for x ≥ 0.009. The unit cell volume passes through a maximum at x ∼ 0.005, attributed to the presence of large, co-doped Ti3+ ions and is superposed on a more gradual increase associated with oxygen vacancy creation and weakening of the Ti,Cr–O bond strength.
For low x compositions, 0.0002 ≤ x ≤ 0.008, the materials are electrically heterogeneous and consist of two regions of approximate composition 0.0002 and 0.009. These regions appear not to be classic two-phase in nature but instead refer to regions where the two charge compensation mechanisms, involving co-doping by Cr3+, Ti3+ in region τ1 and doping by Cr3+ alone in region τ2, predominate, both of which involve oxygen vacancy creation for charge balance. The conductivity of the main, low x bulk component, σ1 was a maximum for the composition with the smallest Cr content that was studied, x = 0.0002; with increasing x, σ1 decreased and activation energy increased, but the volume fraction of τ1 also decreased; τ1 was not seen at all in high x compositions.
Two types of electronic conductivity were observed and included a remarkable switch from n-type to p-type conductivity with increasing x. First, n-type behaviour in undoped rutile is associated with a small oxygen deficiency introduced during sintering which was not fully regained during cooling. This n-type conductivity increases greatly with small x, 0.0002 and is associated primarily with co-doped Ti3+ ions. Second, at higher x, as the extent of co-doping by Ti3+ and Cr3+ decreases, but oxygen vacancies continue to be created, p-type behaviour was observed. This is attributed to the absorption of oxygen, ionisation of under-bonded O2− ions located near to Cr3+ acceptor dopants and hole location on oxide ions. As well as p-type conductivity, oxide ion conductivity associated with oxygen vacancies is observed, giving rise to a range of compositions that show mixed p-type and oxide ion conductivity.
The compositional limit of co-doping with two acceptors, Cr3+ and Ti3+ appears to be x ≤0.009(1). For compositions with x > 0.01, the materials are electrically homogeneous and have only one electrical component that shows composition-dependent conductivity, attributed to hopping electrons associated with the Cr3+ dopant. A limited amount of oxide ion conductivity still occurs, but conduction is mainly electronic.
We see no evidence for CS planar defects for compositions x ≤ 0.03.
Author contributions
ARW conceived and planned the project, YD synthesised the materials, characterised them by XRD and made the impedance measurements. XLP, HW and BY did the electron microscopy with guidance from HYW. All authors contributed to discussion of the results. ARW with input from YD contributed the main conclusions of the work. All authors reviewed and approved the final version of the manuscript.Conflicts of interest
The authors declare no conflicts of interest.Acknowledgements
X. P., Han W., B. Y. and H. W. would like to acknowledge the support from the U.S. Office of Naval Research (Contract numbers: N00014-17-1-2087 and N00014-20-1-2043) for the TEM work at Purdue University.References
- J. Nowotny, M. Alim, T. Bak, M. Idris, M. Ionescu, K. Prince, M. Sahdan, K. Sopian, M. Teridi and W. Sigmund, Chem. Soc. Rev., 2015, 44, 8424–8442 RSC.
- K. Rahman, T. Bak, A. Atanacio, M. Ionescu and J. Nowotny, Ionics, 2018, 24, 309–325 CrossRef CAS.
- X. Li, Z. Guo and T. He, Phys. Chem. Chem. Phys., 2013, 15, 20037–20045 RSC.
- A. Stoneham and P. Durham, J. Phys. Chem. Solids, 1973, 34, 2127–2135 CrossRef CAS.
- M. Blanchin, P. Faisant, C. Picard, M. Ezzo and G. Fontaine, Phys. Status Solidi A, 1980, 60, 357–364 CrossRef CAS.
- R. Gibb and J. Anderson, J. Solid State Chem., 1972, 4, 379–390 CrossRef CAS.
- Y. Liu and A. R. West, J. Am. Ceram. Soc., 2013, 96, 218–222 CrossRef CAS.
- M. Nowotny, T. Bak and J. Nowotny, J. Phys. Chem. B, 2006, 110, 16270–16282 CrossRef CAS PubMed.
- Y. Dang and A. R. West, J. Am. Ceram. Soc., 2019, 102, 251–259 CrossRef CAS.
- S. Somiya, S. Hirano and S. Kamiya, J. Solid State Chem., 1978, 25, 273–284 CrossRef CAS.
- H. D. Werner, Neues Jahrb. Mineral. Mh., 1974, 5, 218–234 Search PubMed.
- S. Andersson, A. Sundholm and A. Magnéli, Acta Chem. Scand., 1959, 13, 989–997 CrossRef CAS.
- D. K. Philp and L. Bursill, J. Solid State Chem., 1974, 10, 357–370 CrossRef CAS.
- M. Binnewies, R. Glaum, M. Schmidt and P. Schmidt, Z. Anorg. Allg. Chem., 2013, 639, 219–229 CrossRef CAS.
- P. Ren, N. Masó and A. R. West, Phys. Chem. Chem. Phys., 2013, 15, 20943–20950 RSC.
- P. Ren, N. Masó, Y. Liu, L. Ma, H. Fan and A. R. West, J. Mater. Chem. C, 2013, 1, 2426–2432 RSC.
- M. Castellanos and A. R. West, J. Chem. Soc., Faraday Trans. 1, 1980, 76, 2159–2169 RSC.
- S. R. Bishop, K. L. Duncan and E. D. Wachsman, Electrochim. Acta, 2009, 54, 1436–1443 CrossRef CAS.
- S. Grieshammer and M. Martin, J. Mater. Chem. A, 2017, 5, 9241 RSC.
- A. R. West, D. C. Sinclair and N. Hirose, J. Electroceram., 1997, 1, 65–71 CrossRef CAS.
- N. Masó and A. R. West, Chem. Mater., 2012, 24, 2127–2132 CrossRef.
- P. G. Bruce and A. R. West, J. Solid State Chem., 1982, 44, 354–365 CrossRef CAS.
Footnote |
| † Electronic supplementary information (ESI) available. See DOI: 10.1039/d1cp01735g |
| This journal is © the Owner Societies 2021 |


