
 Open Access Article
 This Open Access Article is licensed under a
 Creative Commons Attribution 3.0 Unported Licence
A computational study of the properties of low- and high-index Pd, Cu and Zn surfaces†
Lara
Kabalan
 a,
Igor
Kowalec
a,
C. Richard A.
Catlow
abc and
Andrew J.
Logsdail
*a
a,
Igor
Kowalec
a,
C. Richard A.
Catlow
abc and
Andrew J.
Logsdail
*a
aCardiff Catalysis Institute, School of Chemistry, Cardiff University, Park Place, Cardiff, CF10 3AT, Wales, UK. E-mail: LogsdailA@cardiff.ac.uk
bDepartment of Chemistry, University College London, 20 Gordon Street, London, WC1E 6BT, UK
cUK Catalysis Hub, Research Complex at Harwell, Rutherford Appleton Laboratory, Didcot, OX11 OFA, UK
First published on 22nd June 2021
Abstract
We report a detailed Density Functional Theory (DFT) based investigation of the structure and stability of bulk and surface structures for the Group 10–12 elements Pd, Cu and Zn, considering the effect of the choice of exchange–correlation density functional and computation parameters. For the initial bulk structures, the lattice parameter and cohesive energy are calculated, which are then augmented by calculation of surface energies and work functions for the lower-index surfaces. Of the 22 density functionals considered, we highlight the mBEEF density functional as providing the best overall agreement with experimental data. The optimal density functional choice is applied to the study of higher index surfaces for the three metals, and Wulff constructions performed for nanoparticles with a radius of 11 nm, commensurate with nanoparticle sizes commonly employed in catalytic chemistry. For Pd and Cu, the low-index (111) facet is dominant in the constructed nanoparticles, covering ∼50% of the surface, with (100) facets covering a further 10 to 25%; however, non-negligible coverage from higher index (332), (332) and (210) facets is also observed for Pd, and (322), (221) and (210) surfaces are observed for Cu. In contrast, only the (0001) and (10−10) facets are observed for Zn. Overall, our results highlight the need for careful validation of computational settings before performing extensive density functional theory investigations of surface properties and nanoparticle structures of metals.
I Introduction
Computer simulation and computer-assisted design provide a powerful approach for understanding and optimizing functional materials;1,2 and detailed knowledge of surface properties is necessary in understanding the applied chemistry, including catalytic behaviour, of materials. A particularly important quantity is the surface energy,3 which is crucial in determining surface structure, including for nanoparticulate systems with high surface areas or non-crystalline cores. In experiment, the surface energy is measured from a set of liquid/solid contact angles when liquids are brought in to contact with the solid of interest. Materials with a high surface energy show good wetting and a low contact angle, whilst low surface energy materials exhibit poor wetting and a higher contact angle. Due to the specific nature of surface interactions, reactivity and solubilities, it is not possible to choose a universal set of liquids for use in testing solid surfaces.3–6 As a result, such measurements are difficult and provide an incentive for the development of reliable computational modelling procedures.The surface energy can be calculated through the use of interatomic potentials or, as in most recent work, quantum mechanical methods, especially density functional theory (DFT).7–11 Such is the ease and availability of high-throughput density functional theory, Vitos et al. have recently created a database of surface energies computed for the low index surfaces of 60 metals, computed using a full charge density (FCD) approach9 that provides efficient and accurate energetics. In this approach, the Hartree and exchange correlation part of the energy functionals are calculated from the charge density, using LDA or GGA functionals, while the kinetic energy is calculated from the Kohn–Sham kinetic energy, using full potential linear muffin-tin orbitals (LMTO) with the atomic-sphere approximation. The results compare well with other computational investigations that used density functionals (DF) for the surface energy and the work function.9 Cramer et al.12 reviewed the accuracy of GGA, meta-GGA, hybrid, hybrid meta- and range-separated hybrid DFs for the simulation of transition metals, discussing the implications for bulk band structures, structural and spectroscopic properties; and reactivity. Tran et al.10 also published a database of surface energy calculations for 70 elements, with properties calculated employing the GGA approach of Perdew, Burke and Ernzerof (PBE)13 and compared broadly to computation and experiment. Patra et al.14 studied the (111), (110) and (100) surfaces of metals from Groups 8 to 11 of the periodic table (Pd, Pt, Cu, Ag, Ru, Rh, and Au), as well as the main group metal Al, which are all face centered cubic (FCC) metals, using six various DFs: LDA, PBE, PBEsol, SCAN, SCAN+rVV10 and RPA. The investigators concluded that the SCAN functional complemented by non-local van der Waals (vdW) corrections from the revised Vydrov–Van Voorhis 2010 (rVV10) DF, SCAN+rVV10,15 gave the most accurate agreement with experiment for both surface energies and mean work functions.
Despite these detailed computational studies of metal surfaces, there remains a need for a systematic and uniform study of the importance of choice of functional and simulation parameters when modelling both low and high index surfaces of densely packed FCC and HCP metals, as commonly applied to catalytic chemistry, in order to identify how the choice of DF and numerical settings can impact the validity of these simulations. In the context of catalysis, high index surfaces are particularly important as they can exhibit high activity16 when used as catalysts in fuel cells, petrochemical reforming and automotive catalytic converters, due to the higher density of low coordinated sites; and metal catalysts with high-index planes can display enhanced activity relative to close-packed low-index facets such as (111), (110) and (100) planes, such as for Pt.17 High-index facets and high surface-energy nanocrystals also have wider applications such as in drug treatment, sensing and optics,18 stimulating further attention for both simulation and experiment. Quan et al.19 studied high index surfaces for Pd and Pt metals and found that (730) and (411) facets of Pt show improved reactivity towards acid and ethanol oxidation, while the (720) facet offers improved rates for oxygen reduction reaction compared to the low index (100) and (111) surfaces. The Pd(730) facet also shows improved reaction yield when used as a catalyst for electro-oxidation of formic acid and in the Suzuki coupling reaction.20
In this work, we address two key aspects of computational modelling of metal surfaces, namely the choice of simulation settings and functionals, and their use in investigating the properties of high-index surfaces. We present a thorough analysis of the parameters needed for accurate bulk and surface calculations, including for high index surfaces, with specific focus on late-transition FCC (Pd, Cu) and HCP (Zn) metals, representing elements from Group 10, 11 and 12 of the periodic table. In the following section we summarize our methodology; subsequently, results for bulk calculations with 22 exchange–correlation DFs are compared to experimental lattice parameters and cohesive energies, and the best performing DFs are then used to calculate surface energies and work functions for relevant low- and high-index surfaces. We discuss the effect of variation in calculation parameters for surfaces, such as slab thickness, in order to highlight the attention to detail necessary when configuring such simulations. Finally, we present and discuss Wulff constructions of nanoparticles formed with the differing choices of DF, in order to highlight the impact of such approximations.
II Methodology
i. Density functional theory (DFT) simulations
All calculations have been performed with the “Fritz Haber Institute ab initio molecular simulations” (FHI-aims) all-electron full potential software package,21 coupled with the LibXC DF library,22 using the light basis set and a k-grid density of one k-point per (0.018 × 2π) Å−1 unless otherwise stated. The self-consistent field (SCF) cycle was deemed converged when the changes in total energy and density were less than 1 × 10⁻⁶ eV and 1 × 10⁻⁶e a03, respectively. Throughout, a spin-paired configuration has been used with scalar relativity included via the atomic zero order regular approximation (ZORA).23 The exchange–correlation density functionals considered in this study are presented in Table 1. To check the effect of non-local van der Waals corrections, the Tkatchenko–Scheffler (TS)24 and the non-local many-body dispersion (MBD-NL)25 corrections were applied with PBE; the TS correction was also tested with PBE0.ii. Bulk and surface models
Optimal lattice parameters for bulk Pd, Cu, and Zn were obtained with equation-of-state calculations on the primitive cell.44 Using optimal lattice parameters, surface slab models have been created in the Atomic Simulation Environment (ASE) Python package.45 For Pd and Cu, which are FCC, the (111), (100), (110) surface facets were constructed; for Zn, which is HCP, the (0001) and (10−10) facets have been constructed (Fig. S1–S5, ESI†). Unless otherwise stated, the slabs models have 7 atomic layers in the z-direction perpendicular to the surface, and a converged 20 Å vacuum has been added in the z-direction to prevent interaction between periodic surfaces. The top 4 atomic layers are unconstrained during geometry optimization, with constraints applied to the remaining 3 layers, unless otherwise stated. The Broyden–Fletcher Goldfarb–Shanno (BFGS) algorithm is employed for geometry optimizations,46 with a force convergence of 1 × 10⁻² eV Å−1. A dipole correction is applied in the z-direction to eliminate any electrostatic effects that could result from an asymmetric slab relaxation.iii. Energy analysis
The cohesive energy of the bulk material, Ecoh, is defined as: | (1) |
The surface energy, Esurf, is calculated as a combination of the surface cleavage energy, Ecleav, and the subsequent stabilizing relaxation energy, Erelax, which are obtained as:47
 | (2) |
 | (3) |
| Esurf = Ecleav + Erelax | (4) |
iv. Work function
The work function (Φ) of a material is defined as the minimum energy required to move an electron from the surface to a far distance (i.e. vacuum). The work function is given by:48| Φ = Vvac − εFermi | (5) |
v. Wulff construction
The Wulff construction of nanoparticles has been performed using the Wulffpack Python package.50 The morphology of equilibrium crystals is obtained, according to the Gibbs thermodynamic principle, by minimizing the total surface free energy (here approximated by electronic energy) associated to the crystal-medium interface.III Results
i. Bulk lattice parameters and cohesive energy
The calculated lattice parameters (a0) and cohesive energy (Ecoh) using each DF, as well as the percentage difference with respect to room temperature experiment,51 are reported in Tables S1–S3 of the ESI.† Thermal corrections to the experimental data are not explicitly considered in the analysis here, having been recognized in previous work to decrease only marginally the mean percentage absolute errors (MPAE) for geometric distances and cohesive energies, by 0.04% and 0.2%, respectively.52,53In order to assemble the results for each DF for collective analysis here, the MPAE is calculated for each XC and material, considering both a0 and Ecoh, with respect to the experiment values:
 | (6) |
 | ||
| Fig. 1 The MPAE of each density functional as calculated for bulk Pd, Cu and Zn. | ||
For all the exchange–correlation DFs considered, the error in Ecoh is generally higher than the error for a0 and c0, especially in the case of Zn. The poor accuracy of Ecoh for Zn has been observed previously by Lejaeghere et al.,52 who highlighted a difference of 20% when using PBE; similar observations are reported by Janthon et al.,53 who reported a difference of 29%. In an attempt to address the discrepancies highlighted, Lejaeghere et al.52 applied zero point and finite temperature phonon corrections to the experimental data; however, these corrections result in only marginal improvements against experiment, thus failing to resolve the significant error. For PBE, the addition of a vdW correction (PBE+TS) provides better agreement between the calculated lattice parameters and experiment; however, the resulting cohesive energies are much greater than experiment, especially for Cu (calculated: 4.14 eV, experiment: 3.49 eV). Similar results are observed for the PBE0 functional with TS included, which highlights the complexity in identifying DFs that can accurately model structure and energetics for multiple systems.
Of the DFs considered, BLYP, B97-D, HCTH-407, B3LYP, R48PBE and RPBE functionals have a high MPAE for Zn (31.23, 30.78, 27.86, 27.26, 21.38, and 19.46% respectively), which contributes strongly to an overall high average MPAE. PBEsol, HSE06, revTPSS and PBEint have an intermediate average MPAE, in the range from 6 to 10%, while PBE, PBE+TS, PBE+MBD-NL, TPSS, SCAN, revSCAN, and mBEEF have an average MPAE of <6%. The lowest average MPAE is obtained for mBEEF, at 2.56%. The accuracy of mBEEF arises from a combination of machine learning with a Bayesian concept to generalize the fitting procedure for a broad range of material properties,40 providing generally accurate cohesive energies and lattice parameters.
ii. Surface energy
Our investigation is motivated by a desire to identify DFs that can accurately model both bulk and surface properties of the materials of interest, and the ability of a DF to provide accurate surface energetics can be argued as intimately linked to the ability of a DF to provide accurate bulk cohesive energies. Previously, Janthon et al. highlighted this link, and showed that LDA and GGA DFs that underestimate the strength of bulk bonding interactions typically also provide underestimations of surface energies. In some cases, such as the RPBE DF, underestimation of surface energies may be beneficial for accuracy when calculating adsorption chemistry; however, this is beyond the scope of the current study. We focus our surface studies herein on the DFs that provide highest accuracy in the study above of bulk systems. DFs with an MPAE < 6% for bulk structure and energetics have been taken forward for surface energy studies; these include the PBE, PBE+TS, PBE+MBD-NL, TPSS, SCAN, revSCAN and mBEEF exchange–correlation DFs.Fig. 2 presents our results using the PBE DF to calculate surface energies as function of slab depth. We considered the Pd(111), (100) and (110) facets, and oscillations in the surface energy are observed with varying numbers of layers; the oscillations are most pronounced for sparser k-grid densities of one k-point per (0.039 × 2π) Å−1, with variation of 0.06 J m−2 between 9- and 10-layer slab (111) models. The oscillations decrease with increasing k-grid density, and are reduced across all facets for a k-grid density of one k-point per (0.018 × 2π) Å−1; however, even with a dense k-grid sampling of one k-point per (0.011 × 2π) Å−1, oscillations of 0.01 J m−2 are present for the models of the (110) facet. Structural analysis shows these minor fluctuations are due to the crystallographic cleaving creating a ‘crenulation’, which causes the electronic structure to alternate between even and odd layer numbers, resulting in changes in the electrostatic potentials and therefore the onsite energies.55 An equivalent analysis for Cu(111), (100), and (110) facets, and Zn(0001) and (10−10) facets, shows similar oscillations in the surface energy are reduced when increasing the k-grid density (Fig. S6 and S7, ESI†). Comparing all systems, a slab thickness of seven layers, with a k-grid density of one k-point per (0.018 × 2π) Å−1, is deemed necessary to minimise the QSE in our slab calculations.
 | ||
| Fig. 2 The surface energy (J m−2) for Pd(111), (100) and (110) facets, given in the top, middle and bottom graphs, respectively, as function of k-grid sampling (Å−1) in the x- and y-directions. A key is given to show how many layers (5–10) were considered in the respective models. | ||
| DF | Facet | ||||
|---|---|---|---|---|---|
| (111) | (100) | (110) | (111)/(100) | (111)/(110) | |
| a The value were calculated using linear regression for a set of slabs with different thicknesses. | |||||
| PBE | 1.36 | 1.54 | 1.60 | 0.86 | 0.85 |
| Da silva et al.2 | 1.36 | ||||
| Patra et al.14 | 1.36 | 1.79 | 1.61 | 0.76 | 0.84 |
| Tran et al.10 | 1.36 | 1.52 | 1.57 | 0.89 | 0.86 |
| Singh-Miller et al.48 | 1.31 | 1.49 | 1.55 | 0.88 | 0.84 |
| Lin et al.56 | 1.33 | 1.51 | 1.60 | 0.88 | 0.83 |
| Janthon et al.57 | 1.25 | ||||
| 1.27 ± 0.04a | |||||
| PBE+TS | 1.52 | 1.64 | 1.74 | 0.92 | 0.87 |
| PBE+MBD-NL | 1.64 | 1.72 | 1.80 | 0.95 | 0.91 |
| TPSS | 1.67 | 1.82 | 1.95 | 0.92 | 0.86 |
| SCAN | 1.67 | 1.80 | 1.88 | 0.92 | 0.89 |
| Patra et al.14 | 1.54 | 2.08 | 1.83 | 0.74 | 0.84 |
| revSCAN | 1.75 | 1.90 | 1.97 | 0.92 | 0.89 |
| mBEEF | 1.32 | 1.50 | 1.58 | 0.88 | 0.83 |
| Experiment, Tyson et al.: | |||||
| T = 0 K58 | 1.63 | — | — | ||
| T = 1828 K3 | 1.74 | — | — | ||
For all the exchange–correlation DFs considered here, the surface energy of the (111) facet is lower than the (100) and (110) surfaces, agreeing with other theoretical work.10,48 The agreement of our PBE results with previous simulations is good (±0.05 J m−2) with the exception of the investigations of Patra et al.14 who report the (100) surface energy to be greater than (110), contrary to all other studies. The addition of the Tkatchenko–Scheffler vdW correction to PBE (PBE+TS) increases the surface energies for the (111), (100) and (100) facets by 0.16, 0.1 and 0.14 J m−2, respectively, bringing the energies closer to the experimental values. The same increases in surface energy are observed for PBE+MBD-NL, relative to PBE, with increases of 0.28, 0.18 and 0.20 J m−2, for the (111), (100) and (110) surfaces, respectively. For the meta-GGA DFs, TPSS and SCAN give almost identical surface energies for (111) and (100) facets, which are similar to experimental results, whilst the surface energy of the (110) facet is slightly greater with TPSS. revSCAN gives larger surface energies compared to SCAN and is further from the experimental measurements; in contrast, mBEEF gives the lowest surface energies of 1.32, 1.50 and 1.58 J m−2 for the (111), (100) and (110) facets, respectively.
Direct comparison for each Pd surface facet with experiment is not straightforward, as experimental surface energies are averaged over the various crystal facets (1.63 J m−2 at 0 K, and 1.74 J m−2 at the 1828 K3,58); however, broad comparison of each DF with experiment can be made. Comparing our average results for each DF with experiment leads to the conclusions, firstly, that PBE and mBEEF underestimate the surface energies of Pd by a small amount (averages of 1.50 and 1.46 J m−2, respectively); secondly, that PBE+TS and PBE+MBD-NL compare well with experiment (averages of 1.63 and 1.72 J m−2, respectively); and finally, that all other DFs overestimate the surface energy of Pd.
The ratio of surface energies is an alternative metric of DF accuracy. Such ratios are important as they determine the equilibrium nanoparticle shape and the dominant facets; for instance, the smaller the ratio of (111)/(100) surface energies, the more the (111) facet dominates the nanoparticle surface. Recently, Chen et al.59 reported experimental measurements for Pd of 0.77 ± 0.02 for the (111)/(100) surface energy ratio, obtaining the equilibrium nanoparticle shape by annealing at 450 °C. From our calculations, closest agreement with experiment is for the PBE (0.86) and mBEEF (0.88) DFs; all other approaches predict a ratio >0.92. We also present in Table 2 the calculated (111)/(110) ratio for Pd, and note that the trends are inconsistent compared to the (111)/(100) ratio, with the lowest ratio obtained with mBEEF (0.83) and the highest with PBE+MBD-NL (0.91).
The surface energies calculated for Cu(111), (100) and (110) facets are reported in Table 3, where they are compared with previous computational and experimental work. It is noted for Cu that Tyson et al. report experimental surface energies at T = 0 K of 1.79 J m−2 and then 1.57 J m−2 at the melting temperature (T = 1357 K), i.e. a decrease in the surface energy with increasing temperature, in contrast to results for Pd (Table 2).
| DF | Facet | ||||
|---|---|---|---|---|---|
| (111) | (100) | (110) | (111)/(100) | (111)/(100) | |
| a The value were calculated using linear regression for a set of slabs with different thicknesses. | |||||
| PBE | 1.37 | 1.51 | 1.58 | 0.91 | 0.87 |
| Da silva2et al. | 1.41 | ||||
| Da silva60et al. | 1.32 | 1.48 | 1.59 | 0.76 | 0.83 |
| Patra et al.14 | 1.36 | 1.79 | 1.61 | 0.91 | 0.84 |
| Tran et al.10 | 1.34 | 1.47 | 1.56 | 0.90 | 0.86 |
| Janthon et al.57 | 1.31 | ||||
| 1.30 ± 0.11a | |||||
| PBE+TS | 2.57 | 2.72 | 2.77 | 0.94 | 0.93 |
| PBE+MBD-NL | 1.80 | 1.93 | 1.99 | 0.93 | 0.90 |
| TPSS | 1.60 | 1.77 | 1.93 | 0.90 | 0.83 |
| SCAN | 1.58 | 1.78 | 1.90 | 0.93 | 0.83 |
| Patra et al.14 | 1.49 | 1.71 | 1.84 | 0.87 | 0.80 |
| revSCAN | 1.75 | 1.93 | 2.02 | 0.90 | 0.67 |
| mBEEF | 1.43 | 1.56 | 1.63 | 0.92 | 0.88 |
| Experiment, Tyson et al.: | |||||
| T = 0 K58 | 1.79 | — | — | ||
| T = 1357 K3 | 1.57 | — | — | ||
For the GGA functionals, again PBE provides low surface energies, with 1.37, 1.51 and 1.58 J m−2 for the (111), (100) and (110) facets; these are marginally below the experimental values, also. Inclusion of van der Waals correlation corrections, using the TS approach (PBE+TS), results in seemingly poor agreement with experiment, as the surface energies increase dramatically to 2.57, 2.72 and 2.77 J m−2 for the (111), (100) and (110) facets, respectively. For the meta-GGA DFs, SCAN and TPSS again give very similar results, as observed for Pd; mBEEF also gives relatively low surface energies, compared to contemporary meta-GGA methods, of 1.43, 1.56 and 1.63 J m−2 for (111), (100) and (110) facets, respectively; these are again similar to the PBE results. As a consequence, the average surface energy for the three facets obtained by PBE (1.49 J m−2) and mBEEF (1.54 J m−2) are similar, again being lower than the experimental results, while TPSS and SCAN give results closer to experiment. The average result for PBE+TS (2.68 J m−2) is anomalously large compared to experiment, and further investigation is warranted to understand the cause of this result.
Previous measurement of the ratios for (111)/(100) surface energies for Cu facets are absent from the current literature; in the present work, the ratio of (111) to (100) surface energies is calculated to range from 0.88 (PBEsol) to 0.94 (PBE+TS). The (111)/(110) ratio has a similar range, from 0.82 to 0.94.
Table 4 reports the surface energies calculated for the (0001) and (10−10) facets of HCP Zn, together with computational work by Tran et al.10 and the experimental data of Tyson et al.3,58
The Zn surface energies presented in Table 4 span a wide range of energies. revSCAN and PBEsol give the lowest surface energies for the (0001) facet, of just 0.06 J m−2 and 0.14 J m−2 respectively, while PBE+TS gives the highest value of 0.92 J m−2. All other DFs give surface energies for the (0001) facet between 0.24 J m−2 to 0.50 J m−2, seemingly well below the experimental results; the results obtained for the PBE DF are noted, however, to be in excellent agreement with the previous computations of Tran et al.10
The surface energies calculated for the (10−10) facet are much larger than the (0001) facet, with the lowest value obtained for PBE (0.99 J m−2) and a maximum for PBE+TS (1.73 J m−2). Interestingly, the (10−10) surface energy calculated here with PBE is much larger than that reported by Tran et al.,10 which we attribute to differences in nearest neighbour distances; in their work, the nearest neighbor separations are smaller than the experimental values. Overall, the surface energies of the (0001) facet are much lower than the (10−10) facet, though values calculated for the latter are noticeably closer to the experimental results.
We conclude our study of Zn by tentatively calculating a ratio of (0001)/(10−10) facet energies for each DF. The span of ratios is large, with the smallest ratio observed for revSCAN (0.03), and the largest ratios observed being 0.40 and 0.53, with PBE+MBD-NL and PBE+TS, respectively. We note that the (0001)/(10−10) ratio is potentially misleading when the surface energy of (0001) is computed as being very low, such as for revSCAN, and future studies will further investigate the causes of these observations.
iii. Work function
We note that a QSE has been detected also when calculating the work function of materials. As an example, for Pd(110) in our work, Φ calculated with PBE is equal to 5.39 or 5.75 when using a k-grid density of one k-point per (0.039 × 2π) or (0.029 × 2π) Å−1, respectively; this value is stable at 4.80 eV for a k-grid density of one k-point per (0.02 × 2π) Å−1 and below. Given that we have identified the necessary computational parameters to minimize the QSE in slab calculations, Φ is calculated herein for the optimized slab models, as considered when calculating surface energy (i.e. with the same numerical settings).Values of the work function (Φ) for Pd, as calculated with each considered DF, are presented in Table 5. For all the DFs considered, the work functions decrease in line with surface energies, such that Φ (111) > Φ (100) > Φ (110). For the (111) facet, the best match between calculation and experiment was obtained with TPSS, with a difference of 1.10%; the greatest difference was 4.96% with PBE+MBD-NL and mBEEF, which both under-estimate Φ (5.17 eV). For the (100) facet, SCAN and TPSS match well with experiment, with a difference of 1.51%, while the largest difference is for mBEEF (5.85%). The similarity between TPSS and SCAN for electronic properties is interesting, given their similarity also for energetics in Tables 2–4. Finally, for the (110) facet, PBE and mBEEF agree accurately with experiment, while SCAN gives the largest difference (7.50%).
| DF | Facet | ||
|---|---|---|---|
| (111) | (100) | (110) | |
| PBE | 5.19 (−4.60) | 5.02 (−5.28) | 4.80 (0.00) |
| Da Silva et al.2 | 5.64 | ||
| Patra et al.14 | 5.32 | 5.12 | 4.95 |
| Tran et al.10 | 5.20 | 5.13 | 4.62 |
| Singh-Miller et al.48 | 5.25 | 5.11 | 4.87 |
| PBE+TS | 5.24 (−3.67) | 5.04 (−4.91) | 4.85 (+1.04) |
| PBE+MBD-NL | 5.17 (−4.96) | 5.04 (−4.91) | 4.77 (−0.62) |
| TPSS | 5.50 (+1.10) | 5.38 (+1.51) | 5.11 (+6.46) |
| SCAN | 5.51 (+1.29) | 5.38 (+1.51) | 5.16 (+7.50) |
| Patra et al.14 | 5.39 | 5.19 | 5.04 |
| RevSCAN | 5.42 (0.37) | 5.03 (−5.09) | 4.82 (+0.42) |
| mBEEF | 5.17 (−4.96) | 4.99 (−5.85) | 4.80 (0.00) |
| Derry et al.62 | 5.67 ± 0.12 | 5.48 ± 0.23 | 5.07 ± 0.2 |
| Fisher et al.61 | 5.44 ± 0.03 | — | — |
| Küppers et al.64 | — | 5.3 | — |
| Gay et al.63 | — | — | 4.8 |
The work function data for Cu are presented in Table 6 compared with other computational and experimental work. For the (111) facet, SCAN predicts a value of Φ that is very close to experiment (4.89 for 4.94 eV,65 respectively) with an difference of 1.01%, followed by mBEEF with a difference of 2.23%, while PBE+MBD-NL give a large difference (4.71 eV, 4.66%). For the (100) facet, TPSS gives the value of 4.59 eV reported experimentally,66 with mBEEF also performing well (4.53 eV, 1.31%) while a larger deviation was obtained with PBE (4.44 eV, 3.27%). For the (110) facet, the calculated Φ using TPSS is in good agreement with experiment (4.50 eV for 4.45 eV, respectively)62 with a difference of 1.12%, followed by PBE and mBEEF [4.35 eV (2.25%) and 4.33 eV (2.69%), respectively], while RevSCAN predicts a low Φ of 4.18 eV, giving the largest difference (6.06%).
| DF | Facet | ||
|---|---|---|---|
| (111) | (100) | (110) | |
| PBE | 4.72 (−4.45) | 4.44 (−3.27) | 4.35 (−2.25) |
| Patra et al.14 | 4.78 | 4.42 | 4.38 |
| Tran et al.10 | 4.88 | 4.47 | 4.19 |
| Wang et al.67 | 4.71 | 4.50 | 4.27 |
| PBE+TS | 4.76 (−3.64) | 4.50 (−1.96) | 4.28 (−3.82) |
| PBE+MBD-NL | 4.71 (−4.66) | 4.45 (−3.05) | 4.23 (−4.94) |
| TPSS | 4.75 (−3.85) | 4.59 (0.00) | 4.50 (+1.12) |
| SCAN | 4.89 (−1.01) | 4.55 (−0.87) | 4.30 (−3.37) |
| Patra et al.14 | 4.98 | 4.43 | 4.48 |
| revSCAN | 4.85 (−1.82) | 4.52 (−1.52) | 4.18 (−6.06) |
| mBEEF | 4.83 (−2.23) | 4.53 (−1.31) | 4.33 (−2.69) |
| Rowe et al.65 | 4.94 ± 0.03 | — | — |
| Gartland et al.66 | — | 4.59 ± 0.03 | — |
| Derry et al.62 | — | — | 4.45 |
For Zn, the work functions of the (0001) and (10−10) surface facets are given in Table 7. mBEEF provides the closest agreement with experiment for the (0001) facet, with a difference of 0.72%, while PBE+TS gives the largest difference (−6.02%). An experimental work function for the (10−10) facet is unavailable for comparison with the computed values; however, it is interesting to note for the computed results that the work function is greater for this facet than the more stable (0001) facet, which is in contrast to the FCC metals, where the less stable surfaces have smaller work functions.
Fig. 3 summarises the observations in this section, presenting the percentage differences between calculated and experimental work functions for each element with each DF. All DFs have provided errors below 7% for the three elements, which is in the same order of the MPAE presented in Fig. 1. As discussed, PBE gives the best agreement for Pd; TPSS and SCAN give the best agreement for Cu; and mBEEF gives the best agreement for Zn. An average MPAE (i.e. mean of means) with respect to experiment has been proposed for the three considered elements: for this metric, mBEEF gives the lowest average difference of 1.94%.
 | ||
| Fig. 3 MPAE for the surface energy and work functions calculated for each element (Pd: blue; Cu: orange; Zn: grey) with each DF, and the mean of these element specific MPAE (green) for the different XC DFs. | ||
IV Discussion
For the bulk lattice parameters and cohesive energies, seven DFs provide an MPAE below 6% (PBE, PBE+TS, PBE+MBD-NL, TPSS, SCAN, revSCAN, mBEEF). These seven DFs were then applied in calculations of the energetics and electronic structure of material surfaces, with agreement against experiment varying for each element (Pd, Cu and Zn) when the DFs are compared. To draw together the observations and identify the best performing DFs, we summarise the key results here.For bulk materials, mBEEF and PBE+MBD-NL provide the lowest differences relative to experiment, of 2.55 and 2.78% in the MPAE respectively; when considering surface energies, the differences between computation and experiment are on average larger, and the DFs that performed well for bulk were worse performing: mBEEF (and PBE) generally underestimate the surface energies, while PBE+MBD-NL (plus revSCAN and PBE+TS) overestimate. As well as the absolute energies being a metric of accuracy, one can also consider the relative surface energies as representing accurately the energetic ordering of surfaces for a given element: considering the ratio of the (111)/(100) surface energies for Pd, and comparing to the experimental results of Chen et al.,59 PBE and mBEEF are noted as agreeing better with experiment, with all other DFs giving values closer to unity.
For electronic work functions, SCAN and TPSS give (similar) results with good agreement to experiment for the Pd(111) and (100) facets, with SCAN also performing well for the Cu(111) facet and TPSS best performing for the Cu(100) and Cu(110) facet. For the other Pd facet, (110), mBEEF performs well, and similarly is closest to experiment for the Zn work function. When we average the deviations in calculated work functions from experiment, across all the density functionals, as shown in Fig. 3, we note that all DFs selected for surface calculations provide errors below 5% on average, which is in the same order of the average MPAE presented in Fig. 1. Overall, it is clear that mBEEF provides the lowest mean error for bulk and surface calculations, and therefore we highlight mBEEF as the most accurate options for general application to the different metals considered, and potentially for more complex systems such as alloys.
V Wulff construction
To conclude the current study and demonstrate the importance of DF choice when making assumptions of chemical reactivity for surfaces, we use surface energies obtained with the mBEEF DF to calculate optimal nanoparticle morphologies for systems with 5000 atoms (radius: 11 nm); morphologies obtained with PBE data are also shown for comparison. The relative stability of surface facets, and their intersection to form valid nanocrystal morphologies, is crucial for prediction of nanoparticle structures, with consequences in optical, medical and catalytic applications.70,71In order to ensure accuracy for the Wulff construction process, additional high index (332), (322), (211) and (221) facets were cleaved from the crystal bulk for Pd and Cu, and the stabilities evaluated; for Zn, Tran et al.10 have shown that (0001) and (10−10) are significantly lower in energy than all other surfaces and so other high index facets were not considered here. Some high index surfaces offer comparable stability to the low index surface facets, and thus are observed in the outcomes of the Wulff construction. For Pd, the order of stability of all facets is (111) > (100) > (332) > (210) > (322); for Cu, a slight difference is noted with both the (111) and (100) facets more stable (i.e. lower in energy) than the (322) > (332) > (221) > (110) > (210) facets. The work functions were also calculated for the high index facets (ESI,† Table S5), and in general are inversely related to the surface energy for these FCC metals, though not strictly: the Pd and Cu(221) facets give the smallest value of Φ, with the (110) and (210) facets providing the next smallest values.
The structures predicted by the Wulff construction for a 5000 atoms nanoparticle of Pd, Cu and Zn are given in Fig. 4. The morphology predicted for all three species is in good agreement with other computational work by Tran et al.10 and Lin et al.56 The surface coverage of each facet type, presented in Table 8, shows that the (111) facet is most prevalent for Pd (48.83%), followed by the (100) facet (18.80%). The high index (332) and (210) facets cover 18.30% and 6.96%, respectively. Whilst not the highest in surface energy, we note that the (110) facet is not present, in agreement with the Wulff construction provided by Tran et al.10
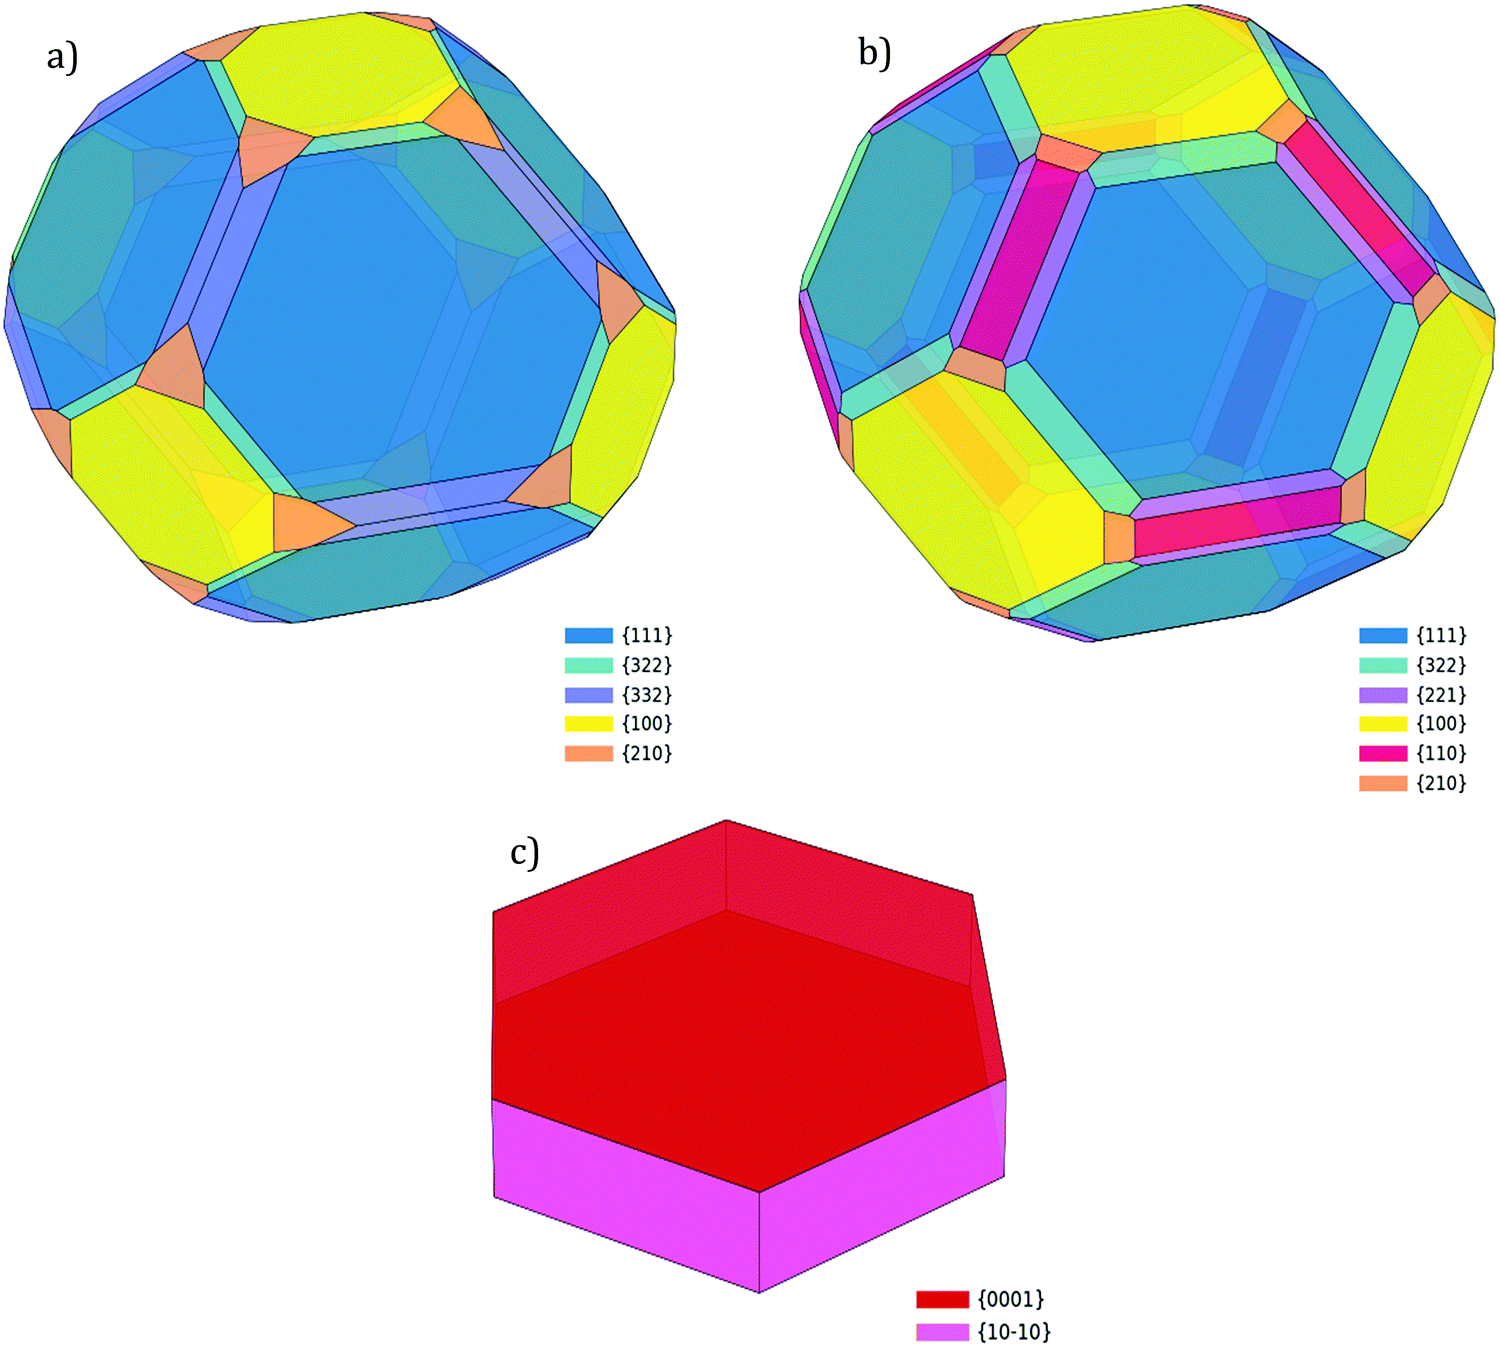 | ||
| Fig. 4 The crystal morphology calculated by Wulff construction for (a) Pd, (b) Cu and (c) Zn nanoparticles of 5000 atoms. | ||
| Facet | Surface energy | Surface coverage | Surface energy | Surface coverage |
|---|---|---|---|---|
| Pd | Cu | |||
| (111) | 1.32 (1.36) | 48.83 (48.81) | 1.43 (1.37) | 47.83 (57.32) |
| (100) | 1.50 (1.54) | 18.80 (9.29) | 1.56 (1.51) | 23.91 (25.84) |
| (110) | 1.58 (1.60) | 0.00 (0.00) | 1.63 (1.58) | 8.10 (6.97) |
| (332) | 1.41 (1.45) | 18.30 (19.59) | 1.57 (1.50) | 0.00 (0.00) |
| (322) | 1.45 (1.50) | 7.11 (4.19) | 1.55 (1.51) | 10.47 (0.02) |
| (221) | 1.49 (1.51) | 0.00 (1.26) | 1.58 (1.53) | 6.73 (6.72) |
| (210) | 1.59 (1.63) | 6.96 (7.53) | 1.70 (1.66) | 2.95 (2.94) |
| Facet | Surface energy | Surface coverage |
|---|---|---|
| Zn | ||
| (0001) | 0.24 (0.32) | 71.02 (60.24) |
| (10−10) | 1.17 (0.97) | 28.98 (39.75) |
To provide a demonstration of the impact that DF choices have on nanoparticle structure, and the consequences for investigations of reactivity we also, as noted, computed the Wulff construction considering the surface energies calculated with the widely used PBE approach; the outcomes show that the Pd(100) facet has a 10% higher surface coverage with mBEEF. The (210) facet was absent in the Wulff construction using mBEEF while it represents 1.26% using PBE. Such information is critical in understanding the behaviour of Pd nanoparticles toward catalytic reaction: Zhang et al.72 have compared the reactivity of (111) and (100) facets toward CO2 reaction and concluded, by comparing the activation energies of the two facets, that the (100) is more reactive than the (111). Having the (100) facet more abundant in the nanoparticle as obtained from the mBEEF Wulff construction would result in a more reactive nanoparticle. No experimental proof of the existence of (210) facet for Pd has been found in current literature.
For Cu, the most prominent facet is again the (111), with a descending order of surface coverage thus: (111) > (100) > (332) > (110) > (221) and (210). In contrast to Pd, the (322) facet was not observed. Tran et al.10 obtained a similar result for the absence of the (322) facet, though did predict the presence of (331), (311) and (310) facets. Again, we computed a Wulff construction with the PBE DF for comparison and identify notable differences in the surface coverages when changing the DF: for mBEEF, the (111) surface coverage is 10% lower than when using PBE, and for mBEEF the (322) facet has a 10% coverage whereas is essentially absent in the PBE model; such differences could be significant when designing nanocatalysts based on DFT calculations, thus demonstrating the impact of DF choice.
For Zn, a simple hexagonal closed packed morphology is formed by the two main (0001) and (10−10) facets, covering 71.02% and 28.98% of the surface, respectively, while with PBE this coverage is 64.24% and 39.75%, respectively. The Zn results are in close agreement with the TEM presented by Mai et al.,73 as well as the theoretical work of Tran et al.10
VI Summary and conclusions
The impact of computational settings for density functional theory simulations of Pd, Cu and Zn materials have been investigated, considering both bulk and surface models. An initial set of 22 density functionals was considered and used to calculate the cohesive energy and lattice parameters for the optimized bulk unit cell of each element. The following density functionals provide relatively low mean percentage average errors (<6%) relative to experiment: PBE, PBE+TS, PBE+MBD-NL, TPSS, SCAN, revSCAN, and mBEEF.The selected density functionals were further used to study low-index surfaces. To remove the presence of quantum size effects, a minimum model thickness of 7 atomic layers perpendicular to the surface plane were necessary, as well as a dense k-grid of one k-point per (0.018 × 2π) Å−1. The surface energies obtained agree reasonably with experiment. It is noted that vdW corrections considered on PBE calculations, namely PBE+TS and PBE+MBD-NL, increase the surface energy of all three elements, with particularly poor outcomes for Cu surfaces with PBE+TS. By considering the computed absolute and relative surface energies, work functions, and previously highlighted bulk observables, and comparing to a range of experimental data, mBEEF is concluded as offering the greatest accuracy of the bulk and surface properties of these metals.
The significance of the choice of density functional is demonstrated by a comparison of nanoparticles formed using Wulff construction with mBEEF and PBE computed surface energies, showing surface coverage differences of some facets of up to 10%. Despite PBE providing relatively good agreement with experiment for bulk and surface energies, the differences observed between mBEEF and PBE when calculating Wulff structures, coupled with weaknesses of PBE in adsorption chemistry,40 highlight that careful density functional choices should be made when studying surface reactivity or catalytic processes. The observations provide a sound basis for the use of mBEEF, together with the k-point and layer thickness settings discussed above, for future computational studies of surfaces of these metals and their alloys. Whilst it is reasonable to assume mBEEF may be appropriate for studying structure and energetics of other materials given its derivation with emphasis on bulk and surface properties, further work is necessary to investigate the generality of our observations towards all transition metals and the composite materials they may form.
Conflicts of interest
There are no conflicts of interest to declare.Acknowledgements
The authors are grateful for funding by the EPSRC Centre-to Centre Project (EP/S030468/1). We are grateful to Matthias Scheffler, Yuanyuan Zhou, Herzain Rivera, Graham Hutchings and David Willock for useful discussions. AJL acknowledges funding by the UKRI Future Leaders Fellowship program (MR/T018372/1). The authors acknowledge computational resources and support from: the Supercomputing Wales project, which is part-funded by the European Regional Development Fund (ERDF) via the Welsh Government; the UK Materials and Molecular Modelling (MMM) Hub (EP/T022213/1), accessed via membership of the Materials Chemistry Consortium, which is funded by EPSRC (EP/L000202/1, EP/R029431/1); and the Isambard UK National Tier-2 HPC Service operated by GW4 and the UK Met Office, and funded by EPSRC (EP/P020224/1).References
- S. R. Tavares, et al., DFT calculations for structural prediction and applications of intercalated lamellar compounds, Dalton Trans., 2018, 47, 2852–2866 RSC.
- J. L. F. Da Silva, C. Stampfl and M. Scheffler, Converged properties of clean metal surfaces by all-electron first-principles calculations, Surf. Sci., 2006, 600, 703–715 CrossRef CAS.
- W. Miller and W. Tyson, Surface free energies of solid metals. Estimation from liquid surface tension measurements, Surf. Sci., 1977, 62, 267–276 CrossRef.
- J. J. Gilman, Direct measurements of the surface energies of crystals, J. Appl. Phys., 1960, 31, 2208–2218 CrossRef CAS.
- D. J. Eaglesham, A. E. White, L. C. Feldman, N. Moriya and D. C. Jacobson, Equilibrium shape of Si, Phys. Rev. Lett., 1993, 70, 1643–1646 CrossRef CAS PubMed.
- Handbook of Chemistry and Physics, ed. R. C. Weast and S. M. Selby, CRC Press, 54th edn, 1973, pp. 7–19 Search PubMed.
- M. Methfessel, D. Henning and M. Scheffler, Trends of the surface relaxations, surface energies, and work functions of the 41 transition metals, Phys. Rev. B: Condens. Matter Mater. Phys., 1992, 46, 4816–4829 CrossRef CAS PubMed.
- L. Vitos, J. Kollár and H. L. Skriver, Full charge-density calculation of the surface energy of metals, Phys. Rev. B: Condens. Matter Mater. Phys., 1994, 49, 16694 CrossRef CAS PubMed.
- L. Vitos, A. V. Ruban, H. L. Skriver and J. Kollár, The surface energy of metals, Surf. Sci., 1998, 411, 186–202 CrossRef CAS.
- R. Tran, Z. Xu, B. Radhakrishnan, D. Winston and W. Sun, Data Descriptor: Surface energies of elemental crystals, Sci. Data, 2016, 3, 1–13 Search PubMed.
- A. M. Rodriguez, G. Bozzolo and J. Ferrante, Multilayer relaxation and surface energies of fee and bee metals using equivalent crystal theory, Surf. Sci., 1993, 289, 100–126 CrossRef CAS.
- C. J. Cramer and D. G. Truhlar, Density functional theory for transition metals and transition metal chemistry, Phys. Chem. Chem. Phys., 2009, 11, 10757–10816 RSC.
- J. P. Perdew, K. Burke and M. Ernzerhof, Generalized gradient approximation made simple, Phys. Rev. Lett., 1996, 77, 3865–3868 CrossRef CAS PubMed.
- A. Patra, J. E. Bates, J. Sun and J. P. Perdew, Properties of real metallic surfaces: Effects of density functional semilocality and van der Waals nonlocality, Proc. Natl. Acad. Sci. U. S. A., 2017, 114, E9188–E9196 CrossRef CAS PubMed.
- R. Sabatini, T. Gorni and S. de Gironcoli, Nonlocal van der Waals density functional made simple and efficient, Phys. Rev. B: Condens. Matter Mater. Phys., 2013, 87, 041108 CrossRef.
- X. M. Zeng, R. Huang, G. F. Shao, Y. H. Wen and S. G. Sun, High-index-faceted platinum nanoparticles: Insights into structural and thermal stabilities and shape evolution from atomistic simulations, J. Mater. Chem. A, 2014, 2, 11480–11489 RSC.
- S. L. Bernasek and G. A. Somorjai, Small molecule reactions on stepped single crystal platinum surfaces, Surf. Sci., 1975, 48, 204–213 CrossRef CAS.
- N. Tian, Z. Y. Zhou and S. G. Sun, Platinum metal catalysts of high-index surfaces: from single-crystal planes to electrochemically shape-controlled nanoparticles, J. Phys. Chem. C, 2008, 112, 19801–19817 CrossRef CAS.
- Z. Quan, Y. Wang and J. Fang, High-Index Faceted Noble Metal Nanocrystals, Acc. Chem. Res., 2013, 46, 191–202 CrossRef CAS PubMed.
- M. Jin, H. Zhang, Z. Xie and Y. Xia, Palladium concave nanocubes with high-index facets and their enhanced catalytic properties, Angew. Chem., Int. Ed., 2011, 50, 7850–7854 CrossRef CAS PubMed.
- V. Blum, R. Gehrke, F. Hanke, P. Havu, V. Havu, X. Ren, K. Reuter and M. Scheffler, Ab initio molecular simulations with numeric atom-centered orbitals, Comput. Phys. Commun., 2009, 180(11), 2175–2196 CrossRef CAS.
- S. Lehtola, C. Steigemann, M. J. T. Oliveira and M. A. L. Marques, Recent developments in LIBXC—A comprehensive library of functionals for density functional theory, SoftwareX, 2018, 7, 1–5 CrossRef.
- W. P. Huhn and V. Blum, One-hundred-three compound band-structure benchmark of post-self-consistent spin-orbit coupling treatments in density functional theory, Phys. Rev. Mater., 2017, 1, 033803 CrossRef.
- A. Tkatchenko and M. Scheffler, Accurate molecular van der Waals interactions from ground-state electron density and free-atom reference data, Phys. Rev. Lett., 2009, 102, 6–9 CrossRef PubMed.
- J. Hermann and A. Tkatchenko, Density Functional Model for van der Waals Interactions: Unifying Many-Body Atomic Approaches with Nonlocal Functionals, Phys. Rev. Lett., 2020, 124, 1–7 Search PubMed.
- N. J. P. Perdew, A. Ruzsinszky, G. I. Csonka, O. A. Vydrov, G. E. Scuseria, L. A. Constantin, X. Zhou, K. B. N. J. P. Perdew, A. Ruzsinszky, G. I. Csonka, O. A. Vydrov, G. E. Scuseria, L. A. Constantin, X. Zhou and K. Burke, Restoring the Density-Gradient Expansion for Exchange in Solids and Surfaces, Phys. Rev. Lett., 2008, 100, 136406 CrossRef PubMed.
- Y. Zhang and W. Yang, Comment on “generalized gradient approximation made simple”, Phys. Rev. Lett., 1998, 80, 890 CrossRef CAS.
- B. Hammer, L. B. Hansen and J. K. Nørskov, Improved adsorption energetics within density-functional theory using revised Perdew-Burke-Ernzerhof functionals, Phys. Rev. B: Condens. Matter Mater. Phys., 1999, 59, 7413–7421 CrossRef.
- E. Fabiano, L. A. Constantin and F. Della Sala, Generalized gradient approximation bridging the rapidly and slowly varying density regimes: A PBE-like functional for hybrid interfaces, Phys. Rev. B: Condens. Matter Mater. Phys., 2010, 82, 1–4 CrossRef.
- O. A. Vydrov and T. Van Voorhis, Nonlocal van der Waals density functional: The simpler the better, J. Chem. Phys., 2010, 133, 244103 CrossRef PubMed.
- S. Grimme, Semiempirical GGA-Type Density Functional Constructed with a Long-Range Dispersion Correction, J. Comput. Chem., 2006, 27, 1787–1799 CrossRef CAS PubMed.
- F. Nattino, C. Díaz, B. Jackson and G.-J. Kroes, Effect of Surface Motion on the Rotational Quadrupole Alignment Parameter of D2 Reacting on Cu(111), Phys. Rev. Lett., 2012, 108, 236104 CrossRef PubMed.
- A. D. Boese and N. C. Handy, A new parametrization of exchange-correlation generalized gradient approximation functionals, J. Chem. Phys., 2001, 114, 5497–5503 CrossRef CAS.
- C. Lee, W. Yang and R. G. Parr, Development of the Colle-Salvetti correlation-energy formula into a functional of the electron density, Phys. Rev. B: Condens. Matter Mater. Phys., 1988, 37, 785–789 CrossRef CAS PubMed.
- J. Sun, A. Ruzsinszky and J. Perdew, Strongly Constrained and Appropriately Normed Semilocal Density Functional, Phys. Rev. Lett., 2015, 115, 1–6 Search PubMed.
- P. D. Mezei, G. I. Csonka and M. Kállay, Simple Modifications of the SCAN Meta-Generalized Gradient Approximation Functional, J. Chem. Theory Comput., 2018, 14, 2469–2479 CrossRef CAS PubMed.
- J. Tao, J. P. Perdew, V. N. Staroverov and G. E. Scuseria, Climbing the Density Functional Ladder: Nonempirical Meta-Generalized Gradient Approximation Designed for Molecules and Solids, Phys. Rev. Lett., 2003, 91, 146401 CrossRef PubMed.
- L. A. Constantin, E. Fabiano and F. D. Sala, Semilocal dynamical correlation with increased localization, Phys. Rev. B: Condens. Matter Mater. Phys., 2012, 86, 035130 CrossRef.
- A. J. Garza, A. T. Bell and M. Head-Gordon, Nonempirical Meta-Generalized Gradient Approximations for Modeling Chemisorption at Metal Surfaces, J. Chem. Theory Comput., 2018, 14, 3083–3090 CrossRef CAS PubMed.
- J. Wellendorff, K. T. Lundgaard, K. W. Jacobsen and T. Bligaard, MBEEF: An accurate semi-local Bayesian error estimation density functional, J. Chem. Phys., 2014, 140, 144107 CrossRef PubMed.
- C. Adamo and V. Barone, Toward reliable density functional methods without adjustable parameters: The PBE0 model, J. Chem. Phys., 1999, 110, 6158–6170 CrossRef CAS.
- P. J. Stephens, F. J. Devlin, C. F. Chabalowski and M. J. Frisch, Ab Initio calculation of vibrational absorption and circular dichroism spectra using density functional force fields, J. Phys. Chem., 1994, 98, 11623–11627 CrossRef CAS.
- J. Heyd, G. E. Scuseria and M. Ernzerhof, Hybrid functionals based on a screened Coulomb potential, J. Chem. Phys., 2003, 118, 8207–8215 CrossRef CAS.
- M. Hebbache and M. Zemzemi, Ab initio study of high-pressure behavior of a low compressibility metal and a hard material: Osmium and diamond, Phys. Rev. B: Condens. Matter Mater. Phys., 2004, 70, 5–10 CrossRef.
- A. Hjorth Larsen, et al., The atomic simulation environment - A Python library for working with atoms, J. Phys. Condens. Matter, 2017, 29, 273002 CrossRef PubMed.
- J. Nocedal and S. J. Wright, Numerical Optimization. Springer Series in Operations Research and Financial Engineering, Springer, 2006, vol. 83, pp. 1–661 Search PubMed.
- P. Broqvist, H. Grönbeck and I. Panas, Surface properties of alkaline earth metal oxides, Surf. Sci., 2004, 554, 262–271 CrossRef CAS.
- N. E. Singh-Miller and N. Marzari, Surface energies, work functions, and surface relaxations of low-index metallic surfaces from first principles, Phys. Rev. B: Condens. Matter Mater. Phys., 2009, 80, 235407 CrossRef.
- L. Gao, J. Souto-Casares, J. R. Chelikowsky and A. A. Demkov, Orientation dependence of the work function for metal nanocrystals, J. Chem. Phys., 2017, 147, 101601 CrossRef PubMed.
- J. Rahm and P. Erhart, WulffPack: A Python package for Wulff constructions, J. Open Source Softw., 2020, 5, 1944 CrossRef.
- S. Gražulis, D. Chateigner, R. T. Downs, A. F. T. Yokochi, M. Quirós, L. Lutterotti, E. Manakova, J. Butkus, P. Moeck and A. Le Bail, Crystallography Open Database – an open-access collection of crystal structures, J. Appl. Crystallogr., 2009, 42, 726–729 CrossRef PubMed.
- K. Lejaeghere, V. Van Speybroeck, G. Van Oost and S. Cottenier, Error estimates for solid-state density-functional theory predictions: An overview by means of the ground-state elemental crystals, Crit. Rev. Solid State Mater. Sci., 2014, 39, 1–24 CrossRef CAS.
- P. Janthon, et al., Bulk properties of transition metals: A challenge for the design of universal density functionals, J. Chem. Theory Comput., 2014, 10, 3832–3839 CrossRef CAS.
- F. K. Schulte, A theory of thin metal films: electron density, potentials and work function, Surf. Sci., 1976, 55, 427–444 CrossRef CAS.
- S. K. Pandey, R. Das and P. Mahadevan, Layer-Dependent Electronic Structure Changes in Transition Metal Dichalcogenides: The Microscopic Origin, ACS Omega, 2020, 5, 15169–15176 CrossRef CAS.
- H. Lin, H. Lin, J. X. Liu, H. Fan and W. X. Li, Compensation between Surface Energy and hcp/fcc Phase Energy of Late Transition Metals from First-Principles Calculations, J. Phys. Chem. C, 2020, 124, 11005–11014 CrossRef CAS.
- P. Janthon, S. M. Kozlov, F. Viñes, J. Limtrakul and F. Illas, Establishing the accuracy of broadly used density functionals in describing bulk properties of transition metals, J. Chem. Theory Comput., 2013, 9, 1631–1640 CrossRef CAS.
- W. R. Tyson, Surface energies of solid metals, Can. Metall. Q., 1975, 14, 307–314 CrossRef CAS.
- P. Chen, Y. Gao and M. R. Castell, Experimental determination of the {111}/{001} surface energy ratio for Pd crystals, Appl. Phys. Lett., 2020, 117, 1–5 Search PubMed.
- J. L. F. Da Silva, C. Barreteau, K. Schroeder and S. Blügel, All-electron first-principles investigations of the energetics of vicinal Cu surfaces, Phys. Rev. B: Condens. Matter Mater. Phys., 2006, 73, 1–11 Search PubMed.
- R. Fischer, et al., Image States and Local Work Function for Ag/Pd(lll), Phys. Rev. Lett., 1993, 6–9 Search PubMed.
- G. N. Derry, M. E. Kern and E. H. Worth, Recommended values of clean metal surface work functions, J. Vac. Sci. Technol., A, 2015, 33, 060801 CrossRef.
- A. K. Bordoloi and S. Auluck, Electronic structure of palladium, Phys. Rev. B: Condens. Matter Mater. Phys., 1983, 27, 5116–5118 CrossRef CAS.
- W. Sesselmann, B. Woratschek, J. Küppers, G. Ertl and H. Haberland, Interaction of metastable noble-gas atoms with transition-metal surfaces: Resonance ionization and Auger neutralization, Phys. Rev. B: Condens. Matter Mater. Phys., 1987, 35, 1547–1559 CrossRef CAS PubMed.
- J. E. Rowe and N. V. Smith, Photoemission spectra and band structures of d-band metals. V. The (100) and (111) faces of single-crystal copper, Phys. Rev. B: Solid State, 1974, 10, 3207–3212 CrossRef CAS.
- P. O. Gartland, S. Berge and B. J. Slagsvold, Photoelectric Work Funct. Copper Single Crystal for the (100), (110), (111), and (112) Faces, Phys. Rev. Lett., 1972, 28, 738–739 CrossRef CAS.
- J. Wang and S. Q. Wang, Surface energy and work function of fcc and bcc crystals: Density functional study, Surf. Sci., 2014, 630, 216–224 CrossRef CAS.
- N. D. Lang and W. Kohn, Theory of metal surfaces: Work function, Phys. Rev. B: Solid State, 1971, 3, 1215–1223 CrossRef.
- M. Akbi and A. Lefort, Work function measurements of contact materials for industrial use, J. Phys. D. Appl. Phys., 1998, 31, 1301–1308 CrossRef CAS.
- A. Pihlajamäki, et al., Monte Carlo Simulations of Au38(SCH3)24 Nanocluster Using Distance-Based Machine Learning Methods, J. Phys. Chem. A, 2020, 124, 4827–4836 CrossRef PubMed.
- K. McNamara and S. A. M. Tofail, Nanoparticles in biomedical applications, Adv. Phys. X, 2017, 2, 54–88 CAS.
- C. J. Zhang and P. Hu, CO oxidation on Pd(100) and Pd(111): A comparative study of reaction pathways and reactivity at low and medium coverages, J. Am. Chem. Soc., 2001, 123, 1166–1172 CrossRef CAS PubMed.
- N. T Mai, T. T. Thuy, D. M. Mott and S. Maenosono, Chemical synthesis of blue-emitting metallic zinc nano-hexagons, CrystEngComm, 2013, 15, 6606–6610 RSC.
Footnote |
| † Electronic supplementary information (ESI) available: The accompanying supporting information is available at DOI: 10.1039/d1cp01602d and includes: figures of the FCC(111), (100) and (110) surfaces, and the HCP(0001) and (10−10) surfaces; graphs of Cu and Zn surface energies as a function of slab thickness; tables of the element specific deviations in lattice parameters and cohesive energy when considering each separate exchange–correlation DF, and also exchange–correlation averaged values; and surface energies and work functions for high-index facets as calculated with mBEEF. The structures from this study have been uploaded to the NOMAD repository (DOI: http://10.17172/NOMAD/2021.05.21-1). The raw data from which all energetic results were derived is available to access at DOI: 10.17035/d.2021.0133038780. |
| This journal is © the Owner Societies 2021 |