 Open Access Article
Raman and ROA analyses of twisted anthracenes: connecting vibrational and electronic/photonic structures†
Luis
Palomo
a,
Fernando
Gordillo Gámez
a,
Anjan
Bedi
 bc,
Ori
Gidron
 b,
Juan
Casado
 *a and
Francisco J.
Ramírez
 *a
*a
aDepartamento de Química Física, Facultad de Ciencias, Universidad de Málaga, Campus de Teatinos s/n, 29071 Málaga, Spain. E-mail: casado@uma.es; ramirez@uma.es
bInstitute of Chemistry, The Hebrew University of Jerusalem, 91904 Jerusalem, Israel
cDepartment of Chemistry, SRM Institute of Science and Technolog, Kattankulathur 603203, Tamil Nadu, India
First published on 31st May 2021
Abstract
In this article the Raman and Raman Optical Activity (ROA) spectra of a series of enantiomeric twisted anthracenes are presented. The evolution of their vibrational spectra is understood in the context of the variation of π-electron delocalization as a result of the twisting imparted by the belt structure and in terms of the modulation of the resonance Raman/ROA effects which are photonic properties also tuned by anthracene twisting. The Raman/ROA vibrational spectra are simulated by several theoretical approaches to account for their vibrational and electronic properties including the theoretical evaluation of resonance effects. We furthermore incorporate a vibrational and ROA activity dissection analysis as provided in the Pyvib2 program valid to establish correlations among vibrational modes of different molecules with different electronic structures and equivalent vibrational dynamics. This paper is one of the very first attempts to use ROA spectroscopy in π-conjugated molecules with twisted and helical morphologies that contrast with the well-known cases of ROA studies of chiral helicenes in which the impact of π-electron delocalization in the electronic/photonic/vibrational (Raman/ROA) spectra is negligible.
Introduction
Twisted acenes, or twistacenes, are acene molecules in which the planar core is forced to twist out of planarity, by functionalization of groups peri with respect to each other.1 While unsubstituted acenes are prone to photooxidation and photodimerization, to minimise this they are often functionalized by various groups, which also results in increased solubility.2 This functionalization can result in a large twisting of the acene core which will concomitantly result in the modification of its optoelectronic properties.3 Moreover, as twisting itself can proceed with two different helicities, M (counter-clockwise) or P (clock-wise), twistacenes are chiral.4 This provides a platform for the exploration of the chiroptical properties on the condition that the barrier of racemization would enable the isolation of enantiomers.Recently, a series of four helically locked chiral twisted anthracenes in which the core twisting was imparted by tethered alkyl groups, ranging from propyl to hexyl, has been reported, Fig. 1.5,6 The robustness of the M and P enantiomers of all Ant-Cn compounds (i.e., did not undergo racemization even after prolonged heating to 100 °C) permits their isolation in pure forms and carrying out chiroptical spectroscopy even under prolonged irradiation times. X-Ray structures of Ant-Cn confirmed that the tether length directly affects the anthracene twisting angle namely, 23 deg for Ant-C6, 30 deg for Ant-C5, 32 deg for Ant-C4 and 38 deg for Ant-C3.5 The conformational stability and the gradual twist along the series represent an ideal system to go deep into the analysis of their spectroscopic properties with the aim of establishing structure–chirality-property connections.
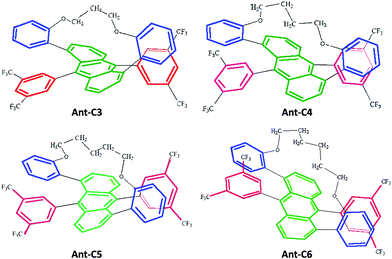 | ||
| Fig. 1 Molecular structure of helically locked tethered twistacenes. See Ref. 3 for synthesis details. | ||
Historically, Raman spectroscopy of π-conjugated molecules has been used for the elucidation of their electronic properties, based on the well-known electron–vibration coupling which makes the observed C–C stretching Raman bands sensitive to the π-electron nature/shape of the given molecule.7 The introduction of chirality in Raman spectroscopy gives rise to Raman Optical Activity (ROA), which is defined as the difference between right and left circularly polarized incident (ICP) or scattered (SCP) Raman intensity.8,9 This technique is nowadays developed to the point of existing commercially available ROA spectrometers. Given the axial chirality of the studied Ant-Cn twistacenes, it becomes evident that the vibrational ROA fingerprint of these helical π-conjugated molecules might reveal information about the vibrational chiroptical properties in connection with the electronic structure upon ad hoc distortion of the π-core by twisting.
Herein, the study of the above-mentioned twisted anthracenes will be addressed by ROA spectroscopy. The lowest energy electronic transition of these molecules (vide infra) is close to the laser beam, 532 nm, used in the experimental spectra. This allows us to study the ROA spectra in the context of resonant conditions. Indeed, when the excitation radiation approaches the energies of the molecular excited states, the terms of general transition polarizability formula whose denominators contain the difference between these two frequencies dominate the intensity of Raman scattering,10 which is expected to become orders of magnitude greater than that of non-resonant Raman scattering. The description of this phenomenon in ROA is embraced by the General Unrestricted (GU) theory,11 with which any ROA experiment can be explained.12–15 The simplest case is the limit of strong resonance with a single-electronic-state (SES), where one electronic state modulates the molecular polarizability.16,17 According to the SES-RROA theory, in the strong resonance limit only one ROA invariant (linear combinations of tensors products which are independent of the molecular axis) remains for all the polarization forms. This leads to a noticeable simplification of the ROA spectrum, which becomes like the parent Raman spectrum except for the absolute intensity and the sign of the chiral bands, which is positive or negative for all ROA features. The circular dichroism definitions in Raman and electronic spectroscopies establish that the sign of the ROA spectrum is opposite to the sign of the resonant transition in the Electronic Circular Dichroism (ECD) spectrum. The theory also connects the ratio between the chiral and the non-chiral intensities in electronic absorption and Raman scattering, the dissymmetric factor (g), by means of a simple relationship:
where I represents the intensity of right-handed (R) and left-handed (L) circularly polarized scattered light and α represents the unpolarized incident radiation. Given the π–π* nature of the resonant transition of π-conjugated twistacenes, the ROA activity can provide us with new electronic and photonic information imparted by the modification of the π-conjugational properties by acene twisting. To put in context the relevance of the present study, we mention that ROA studies in the literature on similar compounds mostly concern the parent π-conjugated helicenes, in which conjugation is highly restricted and the vibrational ROA analysis focuses more on the helicity of the structure.18 Previously, the different response in the π–π* chiroptical signal of twistacene vs. helicene of the different orientations of transition dipole moments was studied by using ECD spectroscopy.3 Conversely, here, in the Ant-Cn compounds, the ROA studies will be carried out in molecules with fractional changes of π-conjugation by twisting, which converts our study into a more electronic structure-oriented analysis. A joint experimental and theoretical study of the ROA and Raman spectra of the four Ant-Cn compounds is now presented.
Experimental methods
ROA and Raman spectroscopy
ROA and Raman spectra were recorded simultaneously on a BioTools ChiralRAMAN© spectrometer (BioTools Inc, Jupiter FL, USA). ROA activity was measured as the intensity difference between the scattered radiations right and left circularly polarized (SCP). Spectra were recorded at the room temperature from 100 μl of saturated solutions in deuterated dichloromethane, CD2Cl2. Excitation wavelength at 532 nm was used as generated by a Nd:VO4 laser working at a power below 20 mw. Backscattering collection of the scattered radiation was used with a spectral resolution of 7 cm−1 and acquisition times of about 24 h. For each spectrum, at least two different experiments were carried out from independently prepared samples.Electronic spectroscopy
ECD spectra were recorded on a Jasco 815 spectrometer working at the room temperature and continuously purged with dry N2 gas. Spectra from 300 to 700 nm were achieved from 200 μl of solutions 0.05 mol l−1 in CH2Cl2 placed in a 0.1 cm path cell. Recording parameters: time constant of 1 second, scan rate of 100 nm min−1 and a bandwidth of 1 nm. Final spectra were obtained as the average of a minimum of three scans after a blank correction.Quantum chemistry
The Gaussian’09 suite of programs19 was used to carry out Density Functional Theory (DFT) quantum chemical calculations. The hybrid exchange–correlation functional B3LYP was used in all calculations. It combines the Becke (B3) gradient-corrected exchange functional with the Lee–Yang–Parr (LYP) non-local correlations and the Tawada20,21 long-range corrections. All calculations were performed using the split-valence 6-31G(d,p) basis sets,22,23 which included polarization functions for all atoms. Raman and ROA spectra were obtained from the DFT intensities in combination with the calculated vibrational wavenumbers uniformly scaled by 0.975.24 Every band was represented by a Gaussian function of 10 cm−1 half-height width. Electronic excitation energies of the twistacenes were obtained by using the time-dependent DFT (TDDFT) formalism25,26 for which up to twenty low-lying energy states were considered.Vibrational analysis
Vibrational analysis was performed using the Pyvib2 program,27 developed by Fedorovsky. This program implements a vibration correlation interface which allows us to compare the nuclear motions of vibrations of different molecules. It also uses the molecular decomposition method, proposed by Hug,28 in order to obtain a topological and more friendly description of the infrared, Raman, VCD and ROA intensities.Results and discussion
Main features of Raman spectra of twisted anthracenes: the case of Ant-C5
We have chosen one of members of the twistacene series and performed a detailed vibrational analysis of its Raman spectrum, Table S1 (ESI†), in order to propose a full assignment of the observed bands which will be transferred to the other molecules. Experimental and calculated Raman spectra for the four twistacene molecules, together with the Z-matrix of the optimized structures, are included in Fig. S1, S2 and Table S2 (ESI†). The Raman spectra of Ant-C5 between 1700 and 900 cm−1 in CD2Cl2 solution are shown in Fig. 2. At first sight, the predicted Raman spectrum reproduces well the experimental one. Modes assigned in the mid-infrared spectral region give rise to the most intense Raman features and all correspond to aromatic skeletal motions, C![[double bond, length as m-dash]](https://www.rsc.org/images/entities/char_e001.gif) C/C–C stretching vibrations [i.e., ν(C
C/C–C stretching vibrations [i.e., ν(C![[double bond, length as m-dash]](https://www.rsc.org/images/entities/char_e001.gif) C/C–C)] and CH deformation vibrations [i.e., β(CH)].
C/C–C)] and CH deformation vibrations [i.e., β(CH)].
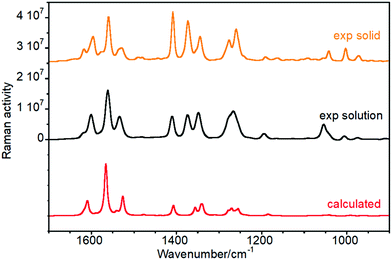 | ||
| Fig. 2 Raman spectra of Ant-C5 as a solid sample (orange), solved in CD2Cl2 (black), and calculated at the B3LYP/6-31G(d,p) level (red). | ||
More in detail we see that:
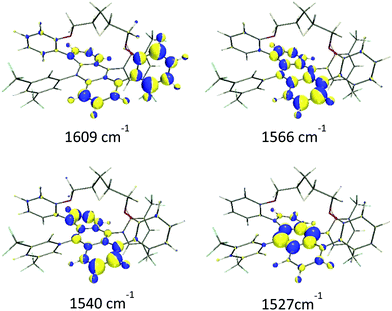
(i) The ν(C![[double bond, length as m-dash]](https://www.rsc.org/images/entities/char_e001.gif) C/C–C) of the aromatic groups are mostly localized above 1500 cm−1. The most intense features were measured at 1596, 1560 and 1529 cm−1 and calculated at 1609, 1566 and 1527 cm−1, respectively. Within this set of bands, a less intense feature was recorded as a shoulder at 1533 cm−1 that was predicted at 1540 cm−1 in the theoretical Raman spectrum. Fig. 3 shows the calculated eigenvectors for these modes, which lead us to assign them as anthracene skeletal stretching vibrations. As observed, the larger vibrational amplitudes are localized in the outer phenyl groups of the anthracene core, except for the 1527 cm−1 wavenumber, whose normal mode is largely located in the inner benzene.
C/C–C) of the aromatic groups are mostly localized above 1500 cm−1. The most intense features were measured at 1596, 1560 and 1529 cm−1 and calculated at 1609, 1566 and 1527 cm−1, respectively. Within this set of bands, a less intense feature was recorded as a shoulder at 1533 cm−1 that was predicted at 1540 cm−1 in the theoretical Raman spectrum. Fig. 3 shows the calculated eigenvectors for these modes, which lead us to assign them as anthracene skeletal stretching vibrations. As observed, the larger vibrational amplitudes are localized in the outer phenyl groups of the anthracene core, except for the 1527 cm−1 wavenumber, whose normal mode is largely located in the inner benzene.
(ii) The Raman bands associated with the mixed ν(C–C) + β(CH) vibrational modes, both of aliphatic and aromatic groups, appear below 1500 cm−1. For instance, the intense features at 1373 cm−1 and 1277 cm−1 are related to the methylene bending modes of the tether while those at 1408, 1345, 1260 and 1043 cm−1 arise from anthracene in-plane C–H bending vibrations.
Analysis of vibrational mode overlapping
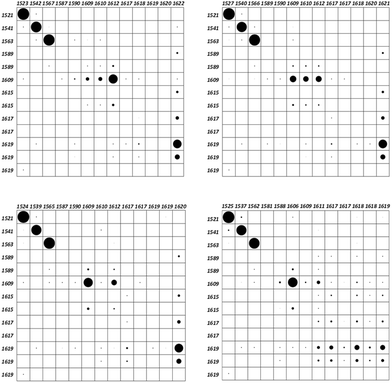
As a matter of fact, any vibrational study involving two or more molecules requires a suitable normal mode correlation. This issue can be accomplished using the vibration correlation interface of the Pyvib2 program, which allows us to compare the nuclear motions of a common fragment of different molecules, providing the results as overlap matrices. The overlap between two modes of two different molecules is defined from the double contraction of the dyads of the vectors which transform each vibrational mode into cartesian coordinates.28 This dimensionless magnitude would range between 1, for identical modes, and 0, for orthogonal ones. For any restricted atomic set, the common components of two vibrational modes are represented by black circles within frame matrices. Quantitative values are proportional to the circle areas, which could not reach the maximum value for some modes as we are not considering the whole molecule. In our case, the selected atomic set was the anthracene carbon atoms, whose motions in the four twistacene molecules are compared with those of an analogue system with an unbridged reference molecule, Fig. S3, S4 and Table S3 (ESI†). Once optimized, the anthracene twist angle of this unbridged analogue was close to that of Ant-C6, thus indicating that the tether in Ant-C6 produces twisting because it tunes the steric hindrances. The overlap matrices are shown in Fig. 4, which correlate the anthracene skeletal motion for thirteen vibrations appearing within the 1650–1500 cm−1 region, all of them assigned mainly as aromatic CC stretching modes. Since the unbridged analogue preserves all the aromatic groups of the twistacenes, an identical set of vibrational wavenumbers can be compared.The frames of Fig. 4 show a high coincidence, concerning the atomic motions of the anthracene moiety, among the three first vibrations of all twistacene series, which appear between 1520 and 1570 cm−1 (notice the large circles on these in Fig. 4). Proof that these normal modes share the same nature allows us to correlate the anthracene distortion with the wavenumber shifts of these Raman bands of the CC stretching modes, which become markers of π-conjugation. As can be seen, they mostly downshift when increasing the twist angle from Ant-C6 to Ant-C3, as evidence of the electronic conjugation depletion forced by the pz overlap reduction.
The wavenumber set of the analogue molecule shows several pairs of quasi-degenerated values that correspond with identical vibrations located over the anthracene attached phenyl groups. Upon tethering, only the degenerated pair at 1589 cm−1 noticeably splits into two different wavenumbers, being calculated at 1581 and 1588 cm−1 for Ant-C3. This pair is assigned to the phenyl groups attached to the terminal rings of the anthracene backbone. As these rings undergo greater distortions upon tethering, this split is a vibrational mark of the conjugation breaking caused by the twist angle increasing. On the contrary, the degenerated pair at 1617 cm−1, which corresponds with vibrations of the difluoromethyl benzenes, which are attached to the central and the less distorted ring of anthracene, does not appreciably split upon tethering.
It is worth noting the behaviour of the anthracene vibration of the analogue at 1609 cm−1. Apparently, this vibration downshifts by 3 cm−1 for Ant-C3, remaining unchanged for the other three twistacenes. However, the overlap matrices indicate that, throughout the series, we are not comparing equivalent vibrations. Indeed, this mode is spread over three eigenvalues in Ant-C6 and Ant-C5, while it is focused on one of them upon tether shortening. On the other side, the first of the three modes of the analogue at 1619 cm−1, which was assigned to a collective motion of all the aromatic systems, is spread out over five eigenvalues in Ant-C3, while it is concentrated on the highest wavenumber of this range when reducing the twist angle. These results tell us that the anthracene distortion reinforces the vibrational coupling of its acene rings units with their attached aromatic groups.
The electronic circular dichroism spectra of the twisted anthracenes: tuning resonance conditions
Fig. 5 displays the experimental and calculated ECD spectra of the twistacene series. The absorption spectra of acenes are dominated by the typical p band, with low and high wavelength onsets at around 350 and 450 nm, respectively.29,30 The energy spacing between the low energy 22![[thin space (1/6-em)]](https://www.rsc.org/images/entities/char_2009.gif) 222 cm−1 onset and the 18
222 cm−1 onset and the 18![[thin space (1/6-em)]](https://www.rsc.org/images/entities/char_2009.gif) 797 cm−1 (532 nm) laser excitation used in the ROA experiment, ca. 3400 cm−1, determines the energy conditions for the attainment of the several forms of resonance in the ROA spectra. In addition, the p-band is an electronically forbidden transition which becomes active by vibronic coupling.5 As a consequence, its intensity increases with symmetry lowering, for example upon twisting. To elucidate on this direction, the ECD spectra of the four compounds, Fig. 5, show optical activity enhancement and wavelength red-shift of the p-band when increasing the twist of the acene moiety, implying that this feature approaches the 532 nm laser excitation for the case of shorter tethers, a bathochromic shift that will tune the magnitude of the resonant phenomenon in the ROA spectra of the Ant-Cn compounds. As previously reported from experimental and calculated measurements,6 the ECD to absorbance ratio (dissymmetric factor, gRamanScatt) increases with increasing twist angle, their high values being within the predicted range for parent acenes (ca. 10−2).
797 cm−1 (532 nm) laser excitation used in the ROA experiment, ca. 3400 cm−1, determines the energy conditions for the attainment of the several forms of resonance in the ROA spectra. In addition, the p-band is an electronically forbidden transition which becomes active by vibronic coupling.5 As a consequence, its intensity increases with symmetry lowering, for example upon twisting. To elucidate on this direction, the ECD spectra of the four compounds, Fig. 5, show optical activity enhancement and wavelength red-shift of the p-band when increasing the twist of the acene moiety, implying that this feature approaches the 532 nm laser excitation for the case of shorter tethers, a bathochromic shift that will tune the magnitude of the resonant phenomenon in the ROA spectra of the Ant-Cn compounds. As previously reported from experimental and calculated measurements,6 the ECD to absorbance ratio (dissymmetric factor, gRamanScatt) increases with increasing twist angle, their high values being within the predicted range for parent acenes (ca. 10−2).
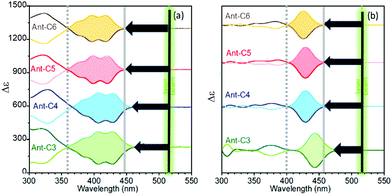 | ||
| Fig. 5 ECD spectra of P (bold lines) and M (soft lines) enantiomers of the twistacene series. (a) Experimental spectra of solutions in CH2Cl2 and (b) calculated spectra at the B3LYP/6-31G(d,p) level. | ||
Raman optical activity of Ant-C5
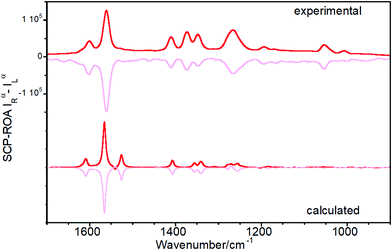
Fig. 6 shows the experimental and calculated ROA spectra of M and P enantiomers of Ant-C5 in C2D2Cl2, which discloses the following spectroscopic features:(i) The ROA spectra accumulate the largest portions of intensities in the ν(C![[double bond, length as m-dash]](https://www.rsc.org/images/entities/char_e001.gif) C/C–C) anthracene bands revealing the selective enhancement of these vibrational modes that couple the electronic excitation between the ground and the excited electronic states of the anthracene chromophore, or vibronic modes.
C/C–C) anthracene bands revealing the selective enhancement of these vibrational modes that couple the electronic excitation between the ground and the excited electronic states of the anthracene chromophore, or vibronic modes.
(ii) The ROA spectra unequivocally assign the helical sense of twisted acenes. Indeed, the ROA signals of each P and M enantiomers of Ant-C5 show mirror-like responses, with a fully positive spectrum for the P and a fully negative spectrum for the M one.
(iii) The experimental ROA spectra are well reproduced by the calculated spectra, the only noticeable difference being the anthracene stretching band around 1530 cm-1. This band was clearly observed in the experimental Raman spectrum of Ant-C5 (Fig. 2) and was predicted to be ROA active. However, it is not detected in the experimental ROA spectra of both enantiomers of Ant-C5. This band will be of relevance in the coming discussion.
(iv) The ROA bands are mono-signate across the entire spectrum, and their relative intensities are like those of the Raman counterpart (Fig. 2), as predicted by the SES-ROA theory.10
(v) The sign of the ROA bands is always opposite to the sign of the lowest-energy ECD feature (Fig. 5), which corresponds to the electronic transition with the nearest wavelength to the excitation radiation of the ROA experiments.
These results indicate that the ROA spectra of Ant-C5 is dominated by the SES-RROA mechanism.11 The SES limit is here achieved with an excitation radiation that does not match, but is close enough, to the lowest-energy electronic band, the acene p band between 350 and 450 nm, which is the single state that controls the molecular polarizability. The ROA to Raman ratio (gRamanScatt) shows some wavenumber dependence. The value for the most intense band at 1560 cm−1, measured from the spectra of Fig. 2 and 6, is ca. 0.007. The obtained gElectAbs value for Ant-C5 was estimated ca. 0.017, which is about 2.4 times greater than gRamanScatt. This result supports the SES-RROA mechanism, for which a relationship of 2 is predicted.
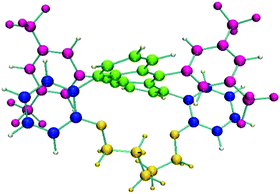
Although Fig. 3 gives an accurate representation of four normal modes involving the anthracene group, the chiroptical effect they produce could give us further insights. A more effective evaluation of the contribution of the different molecular moieties to the ROA intensities can be obtained by using the decomposition method implemented in the Pyvib2 program.27,28 In this method, the three invariants which determine the circular difference cross-sections of a normal mode, namely aG′, βG2 and βA2,10 are dissected into additive quasi-atomic terms. Then, the atomic contributions of a specific molecular fragment can be added up to obtain a topological and more friendly description of the whole ROA intensity of any vibrational eigenvalue. A key step of this analysis is thus the definition of the molecular fragments we are interested in. Fig. 7 shows the five fragments (with different colours) defined for (M)-Ant-C5 on which the ROA invariants are calculated.
Fig. 8 displays the group coupling matrices (GCM) and the atomic contribution patterns (ACP) for the six calculated eigenvalues, within the 1650–1500 cm−1 region, whose invariants for the anthracene moiety have non-negligible values. They are also responsible for the negative triplet set of bands obtained for the calculated ROA spectrum of (M)-Ant-C5 (Fig. 6). Positive and negative contributions are represented by red and yellow motifs, respectively. The area sizes are proportional to the values of the ROA invariants, so they give us a quantitative measure of the contribution amount of each molecular fragment to the whole ROA activity.
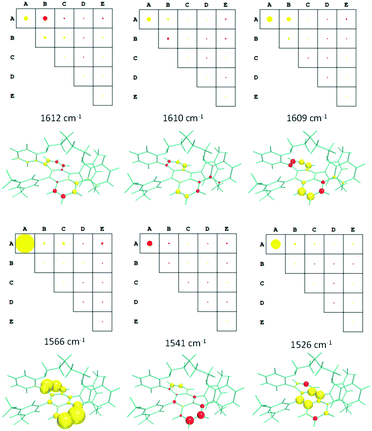 | ||
| Fig. 8 GCMs and ACPs for selected vibrational eigenvalues of Ant-C5 in the 1650–1500 cm−1 region. Groups in GCM are defined in the Fig. 7. The circle and sphere sizes are normalized to the maximum value obtained for the 1566 cm−1 vibration. | ||
Effect of the tether length & twisting angle in the ROA intensities
Fig. 9 displays experimental and calculated ROA spectra for the series of anthracenyl twistacenes. The measured ROA spectra follow the general features discussed in the previous section for Ant-C5, Fig. 5: mirror-like responses between P and M enantiomers, selective enhancement of the anthracene bands, similar patterns to the Raman spectrum and opposite signs to the lowest energy ECD band. The dissymmetric factors were close to that measured for Ant-C5 (ca. 10−3), although their values did not allow us to establish an undoubted relationship with the twist angle. These results confirm the validity of the SES-RROA mechanism.11 However, in addition to these common features, subtle trends can be observed upon twisting. Thus, the ROA spectrum of Ant-C6 shows some weak bands that do not follow the dominant only-one sign spectral pattern of most of the bands. The most noticeable case is the anthracene stretching band at 1537 cm−1 of Ant-C6, which behaves contrarily to the general trend. This fact could be an incipient evidence of the modulation of the resonance effects in the less twisted compounds as a consequence of the increasing mismatch between the 532 nm laser excitation and the lowest p-band (i.e., due to the planarization of the anthracene core). Noticeably, the 1537 cm−1 anthracene band of Ant-C6 is correlated with the missing feature previously discussed for the ROA spectrum of Ant-C5. Following the evolution of this band, it appears as shoulders for the more twisted Ant-C4 and Ant-C3, even though with the dominant sign of the spectrum of each enantiomer. This ROA band thereby becomes a marker feature of the pathway that connects the less twisted compound (Ant-C6) to the more strained ones (Ant-C4 and Ant-C3), with Ant-C5 showing a transition step.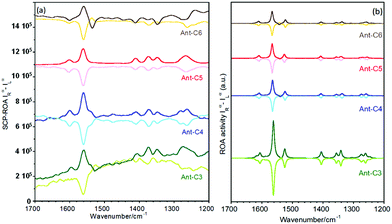 | ||
| Fig. 9 ROA spectra of P (bold lines) and M (soft lines) enantiomers of the twistacene series. (a) Experimental spectra of solutions in CD2Cl2 and (b) calculated spectra at the B3LYP/6-31G(d,p) level. | ||
Modelling the effect of the incident radiation in the ROA spectra
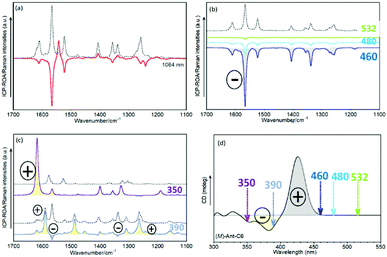
The dependence of any resonant ROA phenomenon with respect to the excitation wavelength, in combination with the behavior of the first electronic band of this series of twistacenes which moves away from the 532 nm laser beam upon anthracene twist angle decrease, makes it intriguing to investigate the effect of the excitation wavelength in the ROA spectral patterns. We have addressed this by calculating ROA spectra as a function of the “excitation” radiation in the theoretical experiment. Experimental Raman spectra at the excitation laser wavenumbers 1064, 785, 633 and 532 nm are included in Fig. S5–S8 (ESI†). Fig. 10 displays the theoretical ROA and Raman spectra for the M enantiomer of Ant-C6 at laser wavelengths ranging from 1064 to 350 nm. They must be interpreted in the light of the data provided by TD-DFT calculations for this enantiomer. The ECD spectrum of (M)-Ant-C6, Fig. 5b, exhibits a first positive Cotton effect with a maximum at 426 nm, which is largely assigned (70%) to the HOMO → LUMO electron promotion. Below 400 nm, the spectrum undergoes sign inversion, giving rise to a broad negative band which is the envelope of three main transitions: 384 nm (70% HOMO−1 → LUMO), 369 nm (70% HOMO−2 → LUMO) and 357 nm (66% HOMO → LUMO+1).According to this description, the ROA spectra in Fig. 10 can be discussed as follows:
(i) When the excitation is set at 1064 nm, Fig. 10a, no resonance is established at all. This fact gives rise to a ROA spectrum with positive and negative bands whose absolute relative intensities are different from those of the Raman spectrum. Both the ROA and the Raman spectra did not show changes upon modulation of the excitation radiation within a moderate range, thus indicating that they are controlled by the far-from-resonance (FFR) mechanism.
(ii) As the excitation energy approaches the positive ECD feature at 426 nm, a different regime is achieved. At energies near this electronic transition, Fig. 10b, the ROA spectra only exhibit negative bands, and their patterns are similar to the Raman spectrum, the only appreciable difference being the overall intensity. We are therefore in the limit of strong resonance with the first electronic excited state of Ant-C6, largely described by the HOMO → LUMO transition, whose excitation from the ground state gives rise to the lowest-energy ECD band. The ROA spectra are then controlled by the SES-RROA mechanism.
(iii) At excitation wavelengths below 400 nm, Fig. 10c, the calculated ROA undergo dramatic changes. The ROA bands are mostly positive, although some weak negative bands remain at 390 nm. In addition, both the ROA and the Raman spectra change when shifting the excitation energy. It has been demonstrated that these results are compatible with strong resonances with more than one electronic state.12–31 Indeed, the ECD spectrum in this region exhibits at least two negative bands, weaker than the first intense positive feature.
Conclusions
In summary, we have demonstrated that the SES-RROA mechanism dominates the ROA spectra of a series of four helically locked twisted anthracenes. The SES limit is achieved with an excitation radiation close to the lowest-energy electronic transition, the acene p band between 350 and 450 nm which controls the molecular polarizability. This regime is somewhat modulated by the closeness between the energies of the induced electronic transition and the laser excitation, which in turn is related to the acene core deformation dictated by the tether length. This modulation is feasible owing to the reduction of the optical gaps due to the alteration of the π-electronic structure with twisting. On the basis of DFT calculations, we have shown how the SES mechanism experimentally observed under 532 nm laser excitation can evolve from an FFR scattering, at wavelength excitation high enough, to a strong interaction with more than one state, at shorter wavelengths. Furthermore, we incorporate the normal coordinate and ROA activity dissection analysis provided by the Pyvib2 program which is required to accurately establish correlations among vibrational modes of different molecules with different electronic structures and equivalent vibrational dynamics for which the twisted anthracenes represent an ideal series. In addition, we present one of the very first attempts to use ROA spectroscopy in π-conjugated molecules with twisted and helical shapes that contrast with the well-known cases of ROA studies of chiral helicenes, in which the changes in π-electron delocalization are negligible.Author contributions
AB and OG: conceptualization and resources. LP and FGG: investigation. JC and FJR: supervision and writing.Conflicts of interest
There are no conflicts to declare.Acknowledgements
We thank MINECO/FEDER of the Spanish Government (project reference PGC2018-098533-B-100) and the Junta de Andalucía, Spain (UMA18FEDERJA057). We also thank the vibrational spectroscopy unit of the Research Central Services (SCAI) of the University of Málaga. O. G. acknowledges support from the European Research Council (ERC) under the European Union's Horizon 2020 research and innovation program (grant agreement no. 850836, ERC Starting Grant “PolyHelix”).Notes and references
- R. A. Pascal, Chem. Rev., 2006, 106, 4809 CrossRef CAS PubMed.
- J. Xiao, H. M. Duong, Y. Liu, W. Shi, L. Ji, G. Li, S. Li, X.-W. Liu, J. Ma, F. Wudl and Q. Zhang, Angew. Chem., Int. Ed., 2012, 51, 6094 CrossRef CAS PubMed.
- A. Bedi and O. Gidron, Acc. Chem. Res., 2019, 52, 2482 CrossRef CAS PubMed.
- M. Rickhaus, M. Mayor and M. Juríček, Chem. Soc. Rev., 2016, 45, 1542 RSC.
- A. Bedi, L. J. W. Shimon and O. Gidron, J. Am. Chem. Soc., 2018, 140, 8086 CrossRef CAS PubMed.
- A. Bedi and O. Gidron, Chem. – Eur. J., 2019, 25, 3279 CrossRef CAS PubMed.
- C. Castiglioni, M. Tommasini and G. Zerbi, Philos. Trans. R. Soc., A, 2004, 362, 2425 CrossRef CAS PubMed; C. Castiglioni, M. Gussoni, J. T. Lopez Navarrete and G. Zerbi, Solid State Commun., 1988, 65, 625 CrossRef; P. Mayorga Burrezo, J. L. Zafra, J. T. López Navarrete and J. Casado, Angew. Chem., Int. Ed., 2017, 56, 2250 CrossRef PubMed; E. Ehrenfreund, Z. Vardeny, O. Brafman and B. Horovitz, Phys. Rev. B: Condens. Matter Mater. Phys., 1987, 36, 1533 CrossRef PubMed.
- P. W. Atkins and L. D. Barron, Mol. Phys., 1969, 16, 453 CrossRef CAS.
- L. D. Barron and A. D. Buckingham, Mol. Phys., 1971, 20, 1111 CrossRef CAS.
- D. A. Long, Raman Spectroscopy, McGraw Hill, New York, 1977 Search PubMed.
- L. A. Nafie, Vibrational Optical Activity. Principles and Applications, John Wiley & Sons, Chichester, 2011 Search PubMed.
- C. Merten, H. Li and L. A. Nafie, J. Phys. Chem. A, 2012, 116, 7329 CrossRef CAS PubMed.
- G. Zajac, A. Kaczor, A. P. Zazo, J. Mlynarski, M. Dudek and M. Baranska, J. Phys. Chem. B, 2016, 120, 4028 CrossRef CAS PubMed.
- J. Sebestík, J. Kapitán, O. Paces and P. Bour, Angew. Chem., Int. Ed., 2016, 55, 3504 CrossRef PubMed.
- T. Wu, G. Li, J. Kapitán, J. Kessler, Y. Xu and P. Bour, Angew. Chem., Int. Ed., 2020, 59, 21895 CrossRef CAS.
- L. A. Nafie, Chem. Phys., 1996, 205, 309 CrossRef CAS.
- M. Vargek, T. B. Freedman, E. Lee and L. A. Nafie, Chem. Phys. Lett., 1998, 287, 359 CrossRef CAS.
- Y. Nakai, T. Mori and Y. Inoue, J. Phys. Chem. A, 2012, 116, 7372 CrossRef CAS PubMed.
- M. J. Frisch, et al., Gaussian 09, Revision C.01, Gausian, Inc., Wallingford CT, 2010 Search PubMed.
- A. D. Becke, J. Chem. Phys., 1993, 98, 5648 CrossRef CAS.
- C. Lee, W. Yang and R. G. Parr, Phys. Rev. B: Condens. Matter Mater. Phys., 1988, 37, 785 CrossRef CAS PubMed.
- P. C. Hariharan and J. A. Pople, Theor. Chim. Acta, 1973, 28, 213 CrossRef CAS.
- T. Clark, J. Chandrasekhar, G. W. Spitznagel and P. V. R. Schleyer, J. Comput. Chem., 1983, 4, 294 CrossRef CAS.
- A. P. Scott and L. Radom, J. Phys. Chem., 1996, 100, 16502 CrossRef CAS.
- E. Runge and E. K. U. Gross, Phys. Rev. Lett., 1984, 52, 997 CrossRef CAS.
- E. K. U. Gross and W. Kohn, Adv. Quantum Chem., 1990, 21, 255 CrossRef CAS.
- M. Fedorovsky, Comput. Lett., 2006, 2, 233 CAS.
- W. Hug, Chem. Phys., 2001, 264, 53 CrossRef CAS.
- J. B. Birks, Photophysics of Aromatic Molecules, Wiley-Interscience, London, 1970 Search PubMed.
- E. Clar, The Aromatic Sextet, J. Wiley, London, 1972 Search PubMed.
- S. Luber, J. Neugebauer and M. Reiher, Chem. Phys., 2010, 132, 044113 Search PubMed.
Footnote |
| † Electronic supplementary information (ESI) available: Details on vibrational assignment, experimental and theoretical Raman spectra, Z-matrix, analogue molecule and Raman spectra at different excitation laser. See DOI: 10.1039/d1cp01505b |
| This journal is © the Owner Societies 2021 |


