
 Open Access Article
 This Open Access Article is licensed under a
 Creative Commons Attribution 3.0 Unported Licence
A kinetic model of thin-film fluorescent sensors for strategies to enhance chemical selectivity
Iain A.
Campbell
and
Graham A.
Turnbull
*
Organic Semiconductor Centre, SUPA, School of Physics and Astronomy, University of St Andrews, St Andrews, North Haugh, Fife, KY16 9SS, Scotland. E-mail: gat@st-andrews.ac.uk
First published on 29th April 2021
Abstract
Thin film chemical sensors are widely used in environmental and industrial applications due to their scalable fabrication and high sensitivity, however they often suffer from low specificity limiting their ability to discriminate between analytes. In this paper we analyse the influence of molecular diffusion and binding interactions on the optical response of thin film fluorescent chemical sensors. We use a computational model to calculate the dynamics of fluorescence quenching due to sorption and desorption of analyte molecules, and compare this with experimental measurements of a conjugated polymer sensor for nitroaromatic vapour. We find that to increase selectivity, such sensors should use thinner films, analyses should concentrate on the recovery dynamics, and sensor materials should be chosen to provide sensor-analyte combinations where diffusion is hindered by strong sensor-analyte binding interactions.
1 Introduction
Physical properties of thin film chemical sensors can be used to transduce the presence of chemical species permeating the film. The presence of chemical analytes can for example be measured as a change in the resistivity,1 light emission,2–4 spectroscopic properties,5,6 or mass7 of the film. A particularly promising approach to the detection of trace vapours of explosives is to monitor fluorescence quenching in thin films of conjugated polymers.8–11 Nitroaromatic molecules which have been sorbed into the polymer film act as quenching sites for photogenerated excitons via an electron transfer mechanism. Such sensors can be highly sensitive to trace vapours, but can also potentially react to a broad range of molecules which means they can be ineffective at discriminating between specific chemicals.Selectivity to target analytes is in fact a general challenge for many thin film sensing technologies, and needs to be addressed for their successful deployment in critical applications such as explosive detection.12 One promising strategy to improve chemical recognition is to deploy an array of different sensor films, and use machine learning analyses to identify small differences between their analyte responses.13–15 Such differences depend on the microscopic interactions of the analyte molecules within the film material, and so to make an effective sensor array it is helpful to understand how the molecular interactions may affect the measurable sensor response.
Each of the sensing mechanisms listed above require molecular contact and therefore a study of the adsorption and permeation of the analyte through the sensor is important to understand how to solve the specificity problem. Experimentally the progress of the analyte as it diffuses through the sensor film has been explored7,16 and it is now well understood that analyte transport is crucial to quenching the fluorescence of an optical chemical sensor film.8,17
In this paper, we use a computational approach to model the sensor system and estimate the analyte populations within the film. Following the approach of Boeker et al.18 we couple Fick's laws of diffusion to chemical rate equations within the film for arbitrary analyte diffusion constants and binding rates. We relate the analyte populations within the film to the film luminescence and study the effect which the interaction constants have on the time dynamics of the sensor system. We note that molecular dynamics studies19–21 can be used to model analyte interactions on much smaller length scales and shorter durations, which can be complementary to the approach we have presented in this paper.
From our computational approach, we gain insight into experimental dynamics and draw general conclusions about fluorescence quenching dynamics in explosive sensors. In particular, we observe a disparity between recovery and decay dynamics and identify potential mechanisms which can explain why some films do not recover their fluorescence when the analyte is removed, and explain a trend in sensor response due to changes in molecular interactions and how this trend may be most effectively exploited for chemical recognition. While this article concentrates on the detection of explosives using conjugated polymer sensors, we note that many of the observations made on this system may generalise to other thin-film sensor systems.
2 Methods
2.1 Model derivation
We consider an analyte species [Q] diffusing into a flat homogeneous sensor layer which contains a uniform concentration [S] of binding sites. The sensor film is coated onto a glass substrate allowing analyte permeation only from its top surface. Such a film can be simply modelled as a one dimensional system orthogonal to the top surface and broken into layers of thickness dx.Some studies have observed analyte transport through a polymer film that is consistent with non-fickian diffusion8 such as case 27 and super case 2.22 We assume that the analyte concentration is sufficiently low that its ingress does not cause appreciable swelling of the film, but instead the molecules occupy the free volume of the polymer however we anticipate that the out-diffusion of analytes from a film swollen with analyte should follow the dynamics presented in this paper. Amongst the spectrum of chemical interactions which occur between the analyte and each sensor layer there will be two dominant processes; reversible adsorption, and the generation of photochemical electronic encounter complexes with the potential to alter the optical signal from the film.
The reversible adsorption process is described by the following formula which relates the unbound analyte population [Q] and the population of binding sites within the sensor layer [S] with the bound analyte population [QS].

On timescales of analyte diffusion the analyte will bind to a quenching site with rate kf, unbind from a quenching site with rate kb, and diffuse through the film with a diffusion constant D towards diffusive equilibrium; S0 is the total population of free binding sites in the sensor layer before exposure. The dynamics of this system are described by the partial differential equation:
 | (2) |
Diffusion and binding processes are coupled in sensor layers such that it can be difficult to distinguish between them. We choose to use analyte diffusion coefficients in the range 10−18cm2 s−1 ≤ D ≤ 10−14cm2 s−1 based upon the work of Levitsky et al.16 Analyte diffusion and binding processes occur on a much slower timescale than the electronic encounter complexes. Such complexes are produced when an optically generated excitation (exciton) in the sensor layer is generated close enough to or diffuses into the influence of an analyte molecule. We approximate then that the sphere of action of this interaction is equal to the average distance between binding sites within the sensor layer and associate this with the average distance which an exciton can diffuse in the film. The consequence of these approximations is that both the unbound and bound analyte populations can quench the light emission from the film via an encounter with an exciton. The deactivation pathway of the encounter complex is described by

The relative abundance of bound and unbound analyte populations at diffusive equilibrium is given by the affinity of the film K to the quencher.
 | (4) |
Using a quasi-equilibrium assumption the intermolecular quenching rate constant kq is given by
 | (5) |
With rates k1 and k−1 for the formation and collapse of encounter complexes and the rate constant for deactivation of the exciton k2. Thus a single degree of freedom suffices to describe all classes of quenching regardless of the precise intermolecular interaction.
To calculate the total light intensity from the film we calculate the light intensity dI from each layer dx in the 1D structure and integrate these using a process similar to that set out by Yekta et al.23
 | (6) |
Finally we follow the convention set by Bartlett and Gardener24 to simplify the discussion of film parameters, and introduce λ to describe the affinity of the film for the analyte and κ to describe the relative importance of adsorption and diffusion within the film:
 | (7) |
2.2 Computational methods
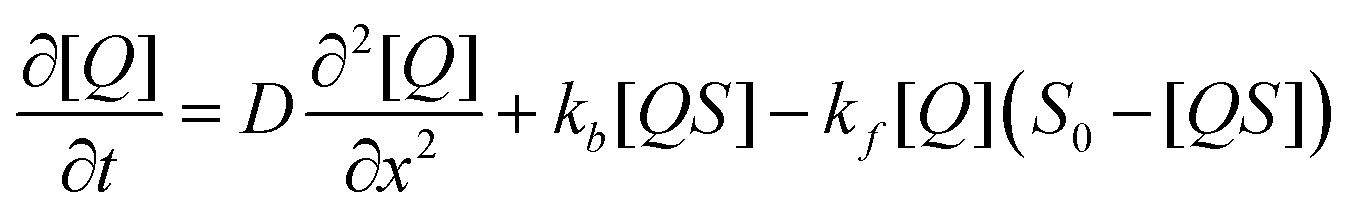
We implement a forward-time central-space model to solve eqn (2). The numerical architecture is constructed using python and stability is assured by increasing the number of iterations subject to the following stability criteria with D and Δx fixed. | (8) |
Our calculation procedure is detailed in Appendix (Fig. 9). Following this scheme allows the surface concentration to be varied throughout an “experiment” which is exploited to study decay/recovery schemes.
2.3 Experimental methods
Explosive vapours were generated using the apparatus shown in Fig. 1 which allows a continuous flow of nitrogen or explosive vapour through the sensor chamber. Nitrogen is used as the carrier gas for the explosive vapours in these experiments and the system is carefully managed to ensure that the nitrogen line remains clean of analyte contaminations throughout.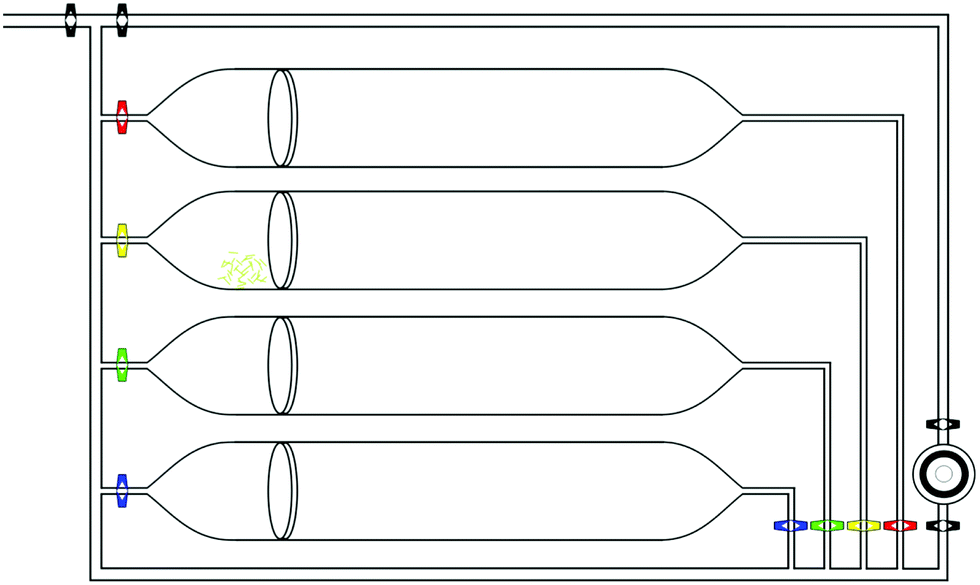 | ||
| Fig. 1 Explosive vapour generating apparatus consisting of stainless steel and borosilicate glass. N2 gas flows from the top left through to the sensing chamber at the bottom right through a path chosen by the valves. Crystals of common explosives/nitroaromatics such as 1,3-DNB, 2,4-DNT, and 2,4,6-TNT are placed behind filter pads within each chamber and the system is held within an air conditioned room to ensure the vapour pressures are repeatable. The film is held within a stainless steel chamber with quartz windows for optical interrogation by a laser expanded to excite the film and a spectrometer to collect the film fluorescence. | ||
Sensor films were spin coated at 2000 rpm from Merck PDY-132 “Super yellow” co-polymer dissolved in toluene at concentrations of (6.5, 4.6, 3.3, 2.3, and 1.6 mg mL−1) to yield film thicknesses of (79, 41, 23, 17, and 9 nm) as measured using ellipsometry (J. A Woollam M2000U).
The sensor film was mounted in the steel sensing chamber connected to the gas lines as shown in Fig. 1. The chamber has a quartz window for optical access of both the excitation light from a 405 nm nitride diode laser (Photonics Solutions) and the emitted fluorescence which was fiber coupled into a CCD spectrometer (Andor).
Each experiment involved exposing the film to a flow of nitrogen gas for fifteen seconds in order to establish a baseline photoluminescent signal before introducing the explosive vapour to the film. At 150 s the explosive vapour flow was switched off and replaced with clean nitrogen to begin the recovery period. Each experiment ran until 300 s, all films were tested at the same temperature ± 1 °C to minimise variations in vapour pressure and over a single day.
3 Validation of numerical scheme
To validate our computational methods we first tested the binding kinetics and the diffusive behaviour of the simulation independently.When the net flux diffusing between sensor layers and between a bound or unbound state approaches zero eqn (2) can be rearranged to yield the following.
 | (9) |
We ran the simulation toward this equilibrium state for a range of affinities to produce Fig. 2 which plots eqn (9) overlaid with the simulation output for three different affinities.
 | ||
Fig. 2 (a) Output of the simulation at diffusive equilibrium for a range of different affinities superposed over the solid line calculated by eqn (9). The solid lines in (b) show the curve obtained by plotting eqn (11) We plotted the simulation output normalised against film thickness and equilibrium solubility with binding constants set to zero for different reduced diffusion times  as indicated in Yekta et al. as indicated in Yekta et al. | ||
The simulated data agree well with eqn (9) which means that the binding kinetics of the PDE are faithfully reproduced in our numerical scheme.
To test the diffusion kinetics of the simulation we performed a diffuse-in experiment and normalised the analyte concentration profile ρ output from the simulation with respect to the equilibrium concentration Qeq as follows:23
 | (10) |
Analytical solutions to eqn (2) in the limit λ → 0 are given by (eqn 11).25
 | (11) |
To compare our results with this analytical solution we assigned Qeq by arbitrarily choosing the region on a plot of integrated concentration across the film that has a gradient of 0.0001. A plot of 1 − ρ from the simulation is overlaid with the curve generated by expression 11 in Fig. 3 for five different reduced diffusion times  . It is evident that the simulation and the analytical solution are in good agreement.
 | ||
| Fig. 3 (a) Typical trace of the experimental data we collect using the procedure described in Experimental methods using a 90 nm thick F8BT film and 1,3-DNB analyte. (b): typical trace from one of our decay/recovery simulations. Please note that eqn (6) is the operation which converts Fig. 4a into this curve. | ||
4 Results and discussion
Fig. 3a shows a trace of a typical explosive detection experiment where the analyte is introduced for a quenching period of 150 s before being removed for a recovery period of 150 s. During analyte exposure the fluorescence is reduced to ≈75% of its initial value, before partially recovering after the analyte was removed. The simulation outputs a matrix of order T by L, of the analyte concentration for T time intervals and L depth intervals into the film as shown in eqn (12). A density plot of a typical distribution of the analyte with time is shown in Fig. 4a. The plot clearly shows the in-diffusion of the analyte during the first 150 s; and the subsequent depletion of analyte near the film surface during the recovery phase. It is notable too that during the recovery some of the analyte continues to diffuse deeper into the film. | (12) |
 | ||
| Fig. 4 Density plot of the L × T matrix output from the simulation during a typical decay recovery cycle. It is evident that the analyte permeates the film until the analyte is removed from the surface at 150 s. After this point the analyte at the surface quickly dissipates leaving a ‘hump’ in the film which is seen to collapse and diffuse both deeper into the film and towards the surface due to a concentration gradient in each direction. (b) Shows 2D cross sections of the density plot (a), clearly showing the ‘hump’ forming and collapsing in two directions. | ||
A cross section of the density plot is shown in Fig. 4b where the progress of the analyte diffusion front can be observed as it relaxes from the moment that the analyte was removed from the surface of the film at 150 s.
Using eqn (6) we can calculate the integrated film light intensity I at each time interval from the analyte concentration matrix generated by the simulation. An example of this output is shown in Fig. 3b which is a plot of the integrated film intensity as we simulate a typical experiment by implementing a 150 s exposure period where the analyte concentration at the surface is greater than zero then a 150 s recovery period where the analyte concentration at the surface is zero.
Comparing Fig. 3a and b it is clear that the simulation can reliably replicate the sensing experiment with only a few free parameters. To understand the relative importance of molecular binding and diffusion on fluorescence quenching in the film, we simulated the fluorescence decay dynamics on exposure to analyte vapours, and the subsequent recovery of fluorescence following removal of the vapour source. The output of these simulations for a range of analyte affinities, diffusion coefficients and film thicknesses are shown in Fig. 5 and 6. Across the full range of parameters simulated, we observe a significant decrease in the fluorescence emission during the first 150 s of exposure to the analyte vapour, followed by a (partial) recovery of the fluorescent signal during the second 150 s time window in which the surface concentration of analyte is set to zero. The rate of fluorescence decay strongly depends on the film thickness, with 10 nm thick films showing the most rapid and complete reduction in fluorescence. The degree of fluorescence recovery also changes significantly with film thickness, with the thinnest films simulated showing the greatest degree of fluorescence recovery. It is particularly notable that for the thickest films (50 nm) in some circumstances the fluorescence recovery does not begin immediately following the removal of the analyte at the surface of the film. For example, When λ = 1 and κ = 1 The fluorescence signal continues to reduce between 150 s and 200 s before a gradual recovery.
 | ||
| Fig. 5 Simulation results comparing the interplay between affinity, adsorption and diffusion for fixed affinities and selected values of the κ adsorption/diffusion parameter. | ||
 | ||
| Fig. 6 Simulation results for fixed values of the κ adsorption/diffusion parameter and selected values of the affinity λ parameter. | ||
A striking pattern is evident in the simulations in the sensitivity of the fluorescence dynamics to the relative values of λ and κ. This is particularly pronounced for the 10 nm thick films. In Fig. 5 we observe that for λ = 0.01, the value of κ has little impact on the dynamics. However, for high affinity (λ = 1) The fluorescence dynamics sensitively depends on the relative strength of diffusion and binding, with the most substantial variations found in the recovery dynamics for values of κ between 0.01 and 0.1. Similarly, for a value of κ = 1, there is a very significant change in the dynamics of recovery of the fluorescence for affinity λ in the range 0.1 to 1. While the fluorescence decay dynamics show a degree of increased sensitivity on λ and κ in the thinnest films, this level of sensitivity is significantly less than the variations observed in the recovery dynamics.
This behaviour has potentially useful implications for how one may design the fluorescent sensor to optimise selectivities between different analyte molecules. Different combinations of sensor polymer and analyte molecule will lead to different values of λ and κ. By selecting appropriate fluorescent polymer materials it may be possible to obtain analyte affinities and diffusion coefficients that span the most sensitive ranges in the parameter space. In the implementation of a selective sensor (or sensor array), the simulations suggest that it will be most effective to focus on the recovery dynamics as a discriminant between the detection of different analyte molecules. Further it has been reported that the ingress of the analyte can swell the sensor film, effectively modifying the structure of the sensor;8 a focus on the recovery dynamics of the already swollen film is likely also to give enhanced and repeatable discrimination in this case.
Fig. 7 shows an example of experimental recovery rate vs. film thickness data for two different analytes to explore whether changes in interaction chemistry are evident in such data. We follow with the results of a computational study in Fig. 8 comparing the recovery rates as some of the chemical parameters are varied. For the experimental results shown in Fig. 7 we followed the procedure described in Experimental methods. Data from the spectrometer was first spectrally integrated to yield an intensity then processed using a compound temporal filter consisting of an 11 point median filter followed by a second order Savitzky–Golay filter to remove random noise from the data. The recovery rate, R was then calculated as shown in eqn (13) as a percentage per minute; from the point at which the analyte was removed to the end of data collection window 150 s later.
 | (13) |
 | ||
| Fig. 7 Plots of recovery rate vs. film thickness calculated as a percentage of the initial intensity from the point at which the analyte was removed to 150 s later. (a) data for 1,3-DNB; (b): data for 2,4-DNT and super yellow. | ||
Eqn (2) shows that there will be diffusion of the analyte molecules in the direction of any concentration gradients. We can see by inspection of Fig. 4a and b that during the exposure phase the concentration gradient is in one direction only however during the recovery phase the diffusion takes place in both directions, from which we can conclude (a) that the recovery rate is slower due to a lower driving force for diffusion and (b) in thicker films the continued diffusion of the penetrant can lead to a negative recovery rate. Our data in Fig. 3a is typical of explosive detection experiments and corroborates point (a) and Fig. 7 shows that thicker films have negative recovery rates which is consistent with point (b).
Considering that the diffusion of explosive vapours is driven by concentration gradients, and that such vapours will be found at differing concentrations dependant upon the explosive device and ambient temperature, leads us to suggest that the decay phase of the sensor system is unappealing for the discrimination of analyte molecules. Data collected from the recovery dynamics of a fully saturated sensor would be subject to fewer extrinsic experimental conditions and thus it would be more suitable to construct a feature space around these data.
Fig. 5 and 6 illustrate the interplay of film thickness and intermolecular chemical processes such as diffusion, affinity, and adsorption. These processes are competing and as such we can see that the data doesn’t tend to show monotonic trends. It is clear however that changes in the analyte-sensor chemical interactions are more evident in thinner films. Sensor films with high affinities for the quencher (large λ) and those in which adsorption and binding processes can compete with diffusion (large κ) show changes between analytes more readily. Furthermore, by comparing experimental Fig. 7a and b with the computationally generated data shown in Fig. 8 we can suggest that a fitting procedure may be found to calibrate recovery vs. film thickness curves into chemical specific data.
 | ||
| Fig. 8 Simulation data illustrating the dependence of recovery rate on film thickness for the range of stability in the simulation. The data uses a range of diffusion constants around accepted literature values16 and an arbitrary selection of λ and κ. | ||
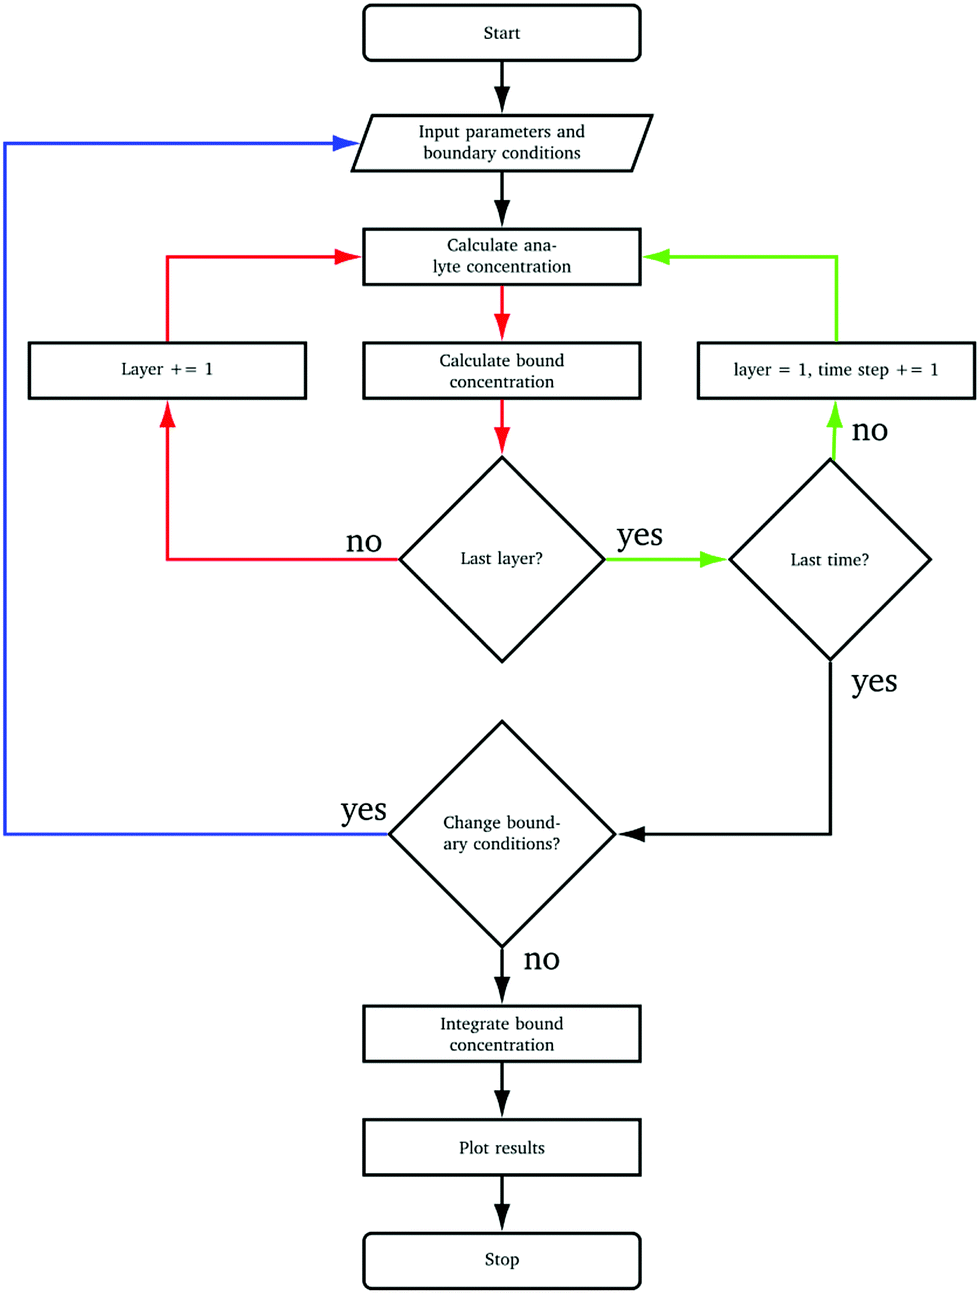 | ||
| Fig. 9 Algorithmic process to solve eqn (2). | ||
In addition to thin polymer films our simulation is also capable of modelling analyte transport through small molecules/dendrimers and thin organic films deposited by evaporation. We posit that it should be capable of modelling more tightly packed materials such as perovskite crystals but an assumed requirement is that there should be a degree of porosity or amount of free volume in the film to permit in-diffusion of the analyte. The kinetic parameters of the sensing process could be elucidated by the use of computational techniques such as ab initio molecular dynamics, which could further aid chemical design and sensor material synthesis.
5 Conclusion
In conclusion, this study has combined modelling and experiment to understand the processes that cause light emission changes in fluorescent thin film sensors to be quicker during the decay than the recovery period, and explained why thinner films show faster recovery rates. Further we have identified three design rules to aid chemical identification, namely that selective sensors should use thinner films, analyses should concentrate on the recovery dynamics, and sensor materials should be chosen to provide sensor-analyte combinations where diffusion is hindered by strong sensor-analyte binding interactions.Author contributions
Iain A. Campbell: conceptualisation, methodology, software, formal analysis, investigation, data curation, writing, visualisation. Graham A. Turnbull: conceptualisation, methodology, validation, formal analysis, writing, supervision, project administration.Appendix
Conflicts of interest
There are no conflicts to declare.Acknowledgements
We would like to acknowledge scientific discussions with Prof I. D. W. Samuel, and funding from the Engineering and Physical Sciences Research Council (grant number EP/N509759/1) and from the NATO Science for Peace & Security Programme under grant agreement MYP G5355. Data supporting this research can be found at https://doi.org/10.17630/dd71fc26-fd41-44d8-ae95-5011ab8297b5.Notes and references
- F. Schedin, A. K. Geim, S. V. Morozov, E. W. Hill, P. Blake, M. I. Katsnelson and K. S. Novoselov, Nat. Mater., 2007, 6, 652–655 CrossRef CAS.
- Y. Yang, G. A. Turnbull and I. D. W. Samuel, Adv. Funct. Mater., 2010, 20, 2093 CrossRef CAS.
- R. N. Gillanders, I. A. Campbell, J. M. Glackin, I. D. Samuel and G. A. Turnbull, Talanta, 2018, 179, 426–429 CrossRef CAS PubMed.
- A. S. Loch, D. M. Stoltzfus, P. L. Burn and P. E. Shaw, Macromolecules, 2020, 53, 1652–1664 CrossRef CAS.
- J. R. Askim, M. Mahmoudi and K. S. Suslick, Chem. Soc. Rev., 2013, 42, 8649–8682 RSC.
- S. H. Lim, L. Feng, J. W. Kemling, C. J. Musto and K. S. Suslick, Nat. Chem., 2009, 1, 562–567 CrossRef CAS PubMed.
- M. A. Ali, S. Shoaee, S. Fan, P. L. Burn, I. R. Gentle, P. Meredith and P. E. Shaw, ChemPhysChem, 2016, 591, 3350–3353 CrossRef.
- P. E. Shaw and P. L. Burn, Phys. Chem. Chem. Phys., 2017, 19, 29714–29730 RSC.
- S. W. Thomas, D. J. Guy and T. M. Swager, Chem. Rev., 2007, 107, 1339–1386 CrossRef CAS PubMed.
- D. T. McQuade, A. E. Pullen and T. M. Swager, Chem. Rev., 2000, 100, 2537–2574 CrossRef CAS.
- S. J. Toal and W. C. Trogler, J. Mater. Chem., 2006, 16, 2871–2883 RSC.
- L. M. Matz, P. S. Tornatore and H. H. Hill, Talanta, 2001, 54, 171–179 CrossRef CAS.
- N. Bolse, R. Eckstein, A. Habermehl, G. Hernandez-Sosa, C. Eschenbaum and U. Lemmer, ACS Omega, 2017, 2, 6500–6505 CrossRef CAS.
- K. L. Diehl and E. V. Anslyn, Chem. Soc. Rev., 2013, 42, 8596–8611 RSC.
- J. Cho, R. Anandakathir, A. Kumar, J. Kumar and P. U. Kurup, Sens. Actuators, B, 2011, 160, 1237–1243 CrossRef CAS.
- I. A. Levitsky, J. Kim and T. M. Swager, Macromolecules, 2001, 34, 2315–2319 CrossRef CAS.
- J.-P. Malval, M. Cranney, S. Achelle, H. Akdas-Kiliç, J.-L. Fillaut, N. Cabon, F. R.-L. Guen, O. Soppera and Y. Molard, Chem. Commun., 2019, 55, 14331–14334 RSC.
- P. Boeker, O. Wallenfang and G. Horner, Sens. Actuators, B, 2002, 83, 202–208 CrossRef CAS.
- S. A. De Silva, M. L. Kasner, M. A. Whitener and S. L. Pathirana, Int. J. Quantum Chem., 2004, 100, 753–757 CrossRef CAS.
- J. Yoon, S. K. Kim, N. J. Singh, J. W. Lee, Y. J. Yang, K. Chellappan and K. S. Kim, J. Org. Chem., 2004, 69, 581–583 CrossRef CAS PubMed.
- J. Kawakami, R. Miyamoto, A. Fukushi, K. Shimozaki and S. Ito, J. Photochem. Photobiol., A, 2002, 146, 163–168 CrossRef CAS.
- Y. Geng, M. A. Ali, A. J. Clulow, S. Q. Fan, P. L. Burn, I. R. Gentle and P. E. Shaw, Nat. Commun., 2015, 591, 8240 CrossRef PubMed.
- A. Yekta, Z. Masoumi and M. A. Winnik, Can. J. Chem., 1995, 73, 2021–2029 CrossRef CAS.
- P. N. Bartlett and J. W. Gardner, Philos. Trans. R. Soc., A, 1996, 354, 35–57 CrossRef CAS.
- P. G. Shewmon, Diffusion in solids, 2nd ed., 1989 Search PubMed.
| This journal is © the Owner Societies 2021 |