
 Open Access Article
 This Open Access Article is licensed under a
 Creative Commons Attribution 3.0 Unported Licence
Flexible to rigid: IR spectroscopic investigation of a rhenium-tricarbonyl-complex at a buried interface†
Kerstin T.
Oppelt
 *,
Laurent
Sevéry‡
,
Mirjam
Utters
,
S. David
Tilley
and
Peter
Hamm
*,
Laurent
Sevéry‡
,
Mirjam
Utters
,
S. David
Tilley
and
Peter
Hamm
Department of Chemistry, University of Zurich, Winterthurerstr. 190, CH-8057 Zürich, Switzerland. E-mail: kerstin.oppelt@chem.uzh.ch; Tel: +41 44635 4477
First published on 4th February 2021
Abstract
This work explores the solid–liquid interface of a rhenium-tricarbonyl complex embedded in a layer of zirconium oxide deposited by atomic layer deposition (ALD). Time-resolved and steady state infrared spectroscopy were applied to reveal the correlations between the thickness of the ALD layer and the spectroscopic response of the system. We observed a transition of the molecular environment from flexible to rigid, as well as limitations to ligand exchange and excited state quenching on the embedded complexes, when the ALD layer is roughly of the same height as the molecules.
1 Introduction
Inspired by research on the conversion of light energy to chemical energy1 and heterogeneous photochemical water reduction systems, which are often based on immobilized molecular photosensitizers and catalysts,2,3 this work aims to investigate the solid/liquid interface of these types of systems. They are often comprised of transition metal complexes as photoactive and/or catalytic compounds, which are bound to (transition) metal oxide scaffolds.4–8 Additional stabilizing layers, deposited by ALD or other methods,9–12 have been explored to protect adsorbed molecules against desorption by limiting solvent exposure of the binding site. These layers are usually very thin compared to the height of the molecules. We consider the situation where a cover layer eventually tops the molecules to be an interesting point to investigate.ALD is a self-saturating and self-limiting vapour coating technique, which is based on chemical reactions between a precursor and the functional groups of the surface that is coated.13,14 It offers atomic level control of layer thickness and layer composition and furthermore, it enables conformal coating of complex 3D surface structures. ALD can be applied to stabilize photoelectrodes against corrosion, and has been used on top of sensitizer- and/or catalyst-functionalized semiconductor surfaces in dye-sensitized solar cells and photoelectrochemical cells.15,16 As such, ALD seems to be the best method to control the thickness and nature of the deposited cover layer described previously.13,14,17
There are quite a few studies about the influence of deposited ALD layers on the interface between a metal oxide semiconductor and an adsorbed molecule. Parameters that have been tested are not only long term stability,12 but also charge transfer to/from the metal oxide, as well as energy transfer between adsorbed molecules.2,18 Most studies were performed using either TiO2 or Al2O3 ALD cover layers. Here, we aim to investigate the interface between the liquid phase and a transition metal complex anchored to mesoporous ZrO2 with ZrO2 cover layers. ZrO2 is a commonly employed coating material and has the advantage of being transparent to the light from near infrared to the visible region due to its band gap of about 5.4 eV.19 Furthermore, ZrO2 is quite inert, and, therefore, it is expected to only barely influence any chemical reactions.20,21
We apply FTIR, transient Vis-pump-IR-probe (tr-IR), as well as two-dimensional infrared (2D-IR) spectroscopy. We will show that each of these methods can cover special aspects of the molecular behaviour at this interface. The ground state reactivity and accessibility can be observed by ligand exchange experiments, while transient Vis-pump-IR probe spectroscopy can cover many aspects of photochemical reactivity. Solvation dynamics can be investigated by two-dimensional infrared spectroscopy. With increasing coverage the response of the system should transition from rather flexible to very rigid at a cover layer thickness that corresponds to the height of the molecules on the surface. The thickness of one ALD cycle is about 1 Å,22,23 while the height of the molecule is ≈9 Å, as estimated from a published crystal structure of a similar complex.24 Thus, we expect the transition to happen with 10 ALD cycles, and furthermore, that the transition will be relatively abrupt.
2 Materials and methods
2.1 Sample
We investigate the complex Re(2,2′-bipyridyl-4,4′-bisphosphonic acid)(CO)3Cl (Fig. 1, ReP-Cl)20,24,25 anchored on a 200 nm thick mesoporous layer consisting of ZrO2 nanoparticles (20–40 nm diameter) on a CaF2 substrate. Synthesis of the rhenium complex was performed according to published procedures.20,24,26 | ||
| Fig. 1 Chemical structures of the rhenium complex and the electron donor addressed in this work. | ||
The mesoporous film was prepared by spin coating of diluted nanoparticle solutions (1.1 g Solaronix Z-SP and 5 ml EtOH) on UV grade CaF2 windows (Crystran) as substrates. After sintering the nanoporous layers at 550 °C on a hot plate, the substrates (with the sintered films) were immersed in ethanolic solutions of the rhenium complex (0.2 mM) for at least 12 h to ensure a good coverage. Samples were then rinsed with copious amounts of ethanol and then dried with a stream of nitrogen. FITR spectra were measured with a Bruker Tensor 27 FTIR spectrometer. The IR absorbance and the film thickness derived from scanning electron microscopy imaging was used to confirm that the surface coverage is on average a monolayer of ReP-Cl. Details can be found in the ESI.†
ALD was performed using a Picosun R-200 ALD reactor using TEMAZ (tetrakis-(ethylmethylamino)-zirconium(IV), Sigma-Aldrich, >99.99%) as the zirconium source, Milli-Q water as oxygen source, and N2 as carrier gas for ZrO2. TEMAZ was kept at 110 °C during the deposition using a heating mantle, while the H2O was kept at 25 °C using a Peltier cooler. The substrate temperature was held at 150 °C during the entire deposition process. For flat surfaces, a precursor pulse consisted of an opening of the precursor source to the main chamber (2.0 s for TEMAZ, 0.1 s for H2O), followed by a 20 s purge with N2. To deposit conformal layers on mesoporous substrates, a stopped flow method was used to increase the residence time of the precursor molecules in the reactor. To determine the thickness of the grown ALD layers, a small piece of silicon wafer was inserted along with the samples into the reactor. The growth rate per cycle (≈1 Å) was consistent with the literature22 and was determined by ellipsometry of the wafer piece before and after deposition using a J. A. Woollam Alpha-SE ellipsometer. The deposited layer was modelled using the WVase software.
The mesoporous film used here is relatively thin compared to previously studied samples,20 leading to a small absorption cross section of the adsorbed molecules. Thicker mesoporous films turned out to be only incompletely covered by the ALD layer, and most likely only at their very surface. In addition to using a thinner mesoporous layer, we adjusted pulsing times of reagent and water vapour during the ALD process to ensure that both can diffuse through the whole cross section of the mesoporous film. Furthermore, it is important to deposit the ALD layers at a temperature low enough to avoid changes of the immobilized molecules on the surface and thus to their functionality.14,27
Fig. 2 schematically shows the sample geometry, and the assembly used in the time resolved measurements described below.
 | ||
| Fig. 2 Schematics of the samples. (a) Image of the measurement cell and sketch of the sample between CaF2 windows and liquid layer, together with the laser beams in the applied transmission geometry. (b) Schematic views and magnifications of the substrate, the structure of the mesoporous film as well as the adsorbed ReP-Cl molecule and the deposited ZrO2 ALD layer. | ||
2.2 Time-resolved spectroscopy
The laser system used to measure the transient IR spectroscopy consisted of two synchronized Ti:Sa lasers operating at 2.5 kHz. This spectrometer setup allowed for pump–probe delays from approximately 10 ps (caused by the jitter of the electronic synchronization) to 40 μs. Frequency doubling of the first laser created pump pulses centred around 400 nm. The second laser generated tunable mid-IR probe pulses in a home-built optical parametric amplifier (OPA).28The pump laser energy was 60–80 nJ cm−2, and the duration was stretched to 4 ps. This low excitation density in combination with purging of either the pure solvent or the quencher solution with argon ensured mild conditions during the experiments, and avoided triplet–triplet annihilation that we observed at higher excitation densities.20 The sample spot was constantly changed during the measurement using a home-build 2D raster scanner with magnetic linear motors to avoid sample damage by constant focus on only one spot. Furthermore, solvent and quencher solutions were constantly exchanged in the sample cell using a peristaltic pump. The sample cell consisted of the CaF2 window with the prepared oxide layer and a clean CaF2 window separated by a 6 μm MYLAR spacer.
After dispersing the probe pulse in a spectrograph right after the sample, it was detected by a 2 × 64 pixel MCT detector, which covered a 200 cm−1 spectral window with a resolution of about 4 cm−1. For data analysis, wavenumbers were corrected using the previously recorded FTIR spectra and the data were normalized by the ground state bleach minimum around 2035 cm−1 at delay zero.
2D-IR measurements were performed with a 1 kHz Ti:Sa laser system, as described elsewhere.29 A different spectrograph/detector combination was used, leading to a spectral resolution of 2 cm−1.
3 Results
We explored different IR spectroscopic methods to probe the degree to which ReP-Cl was covered by the ALD layer: FTIR, transient Vis-pump-IR-probe and 2D-IR spectroscopy. FTIR was complemented by chemical exchange reactions. In either case, we used the carbonyl stretch modes of the rhenium complex as observables, which are known to be very sensitive to changes in the molecule environment,30–32 the oxidation state of the Re center, and the ligand system.33–35 The three tricarbonyl signals around 2040 cm−1, 1950 cm−1 and 1900 cm−1 are assigned to the a′(1) mode (symmetric stretch vibration of all COs), the a′′ (antisymmetric stretching of equatorial COs) and the a′(2) mode (antisymmetric stretching of axial CO and equatorial COs), respectively.363.1 FTIR spectroscopy
In a first step, we monitored the influence of the ALD cover layer on the adsorbed molecules by FTIR spectroscopy. Fig. 3 shows FTIR spectra of dry samples of ReP-Cl on ZrO2 without cover layer (red line) and covered with 10, 20 or 30 cycles of ZrO2 ALD (blue, yellow and green lines). The spectra significantly change upon deposition of ALD layers, reflecting a different environment around the CO groups of ReP-Cl. The largest frequency shift and broadening of the spectra happens between 0 and 10 cycles, and the trend gradually continues beyond. The two different blue and yellow spectra were taken from independently prepared samples, evidencing the reproducibility of the preparation process. | ||
| Fig. 3 FTIR spectra of dry samples of ReP-Cl on ZrO2 without cover layer (red line) and covered with 10, 20 or 30 cycles of ZrO2 ALD (blue, yellow and green lines, respectively). The two different blue and yellow spectra were taken from independently prepared samples. | ||
The observed trend is comparable to the results by Song et al.37 where a similar Re compound on mesoporous TiO2 has been covered with ALD layers of Al2O3. They also observed a change in the vibrational frequency, spectral line width and oscillator strength of the carbonyl modes. They explained this behaviour by less clustering between adjacent rhenium molecules, referring to the work of Laaser et al.38
3.2 Ligand exchange
In a second step, we performed exchange experiments of the axial chloride with thiocyanate (SCN−), similar to previously published exchange of Cl− on Ru and Ir complexes with CN−.27 To that end, the samples were kept in a 100 mM KSCN solution in methanol for 16 days, and rinsed with methanol afterwards. The final product in this reaction is the isothiocyanate (NCS−).39–41Fig. 4 (dashed lines) exhibits a NCS− stretching band (the C-N stretching mode of the isothiocyanate ligand) at 0 and 10 ALD cycles, but not for thicker ALD layers. In addition, frequency shifts are observed, which are expected upon ligand exchange but hard to disentangle from the environment effect shown in Fig. 3. We hypothesize that for preventing a Cl− ligand loss, we would at least have to cover the molecule up to its height on the surface (≈9 Å). The height was estimated from a published crystal structure of a similar complex.24 Accordingly, ligand exchange is still possible at 10 ALD layers, albeit weakly and no longer occurs for any of the thicker layers. | ||
| Fig. 4 FTIR spectra of the Re complex with different numbers of ALD cycles after storage of the samples in a KSCN solution in MeOH to test Cl− ligand exchange for NCS−. The dash lines show the spectral region of the NCS− stretching vibration with 10-fold magnification. | ||
3.3 Transient IR spectroscopy
The next set of experiments determined up to how many ALD layers the photoexcited complex remains accessible for charge transfer from an electron donor in solution. We utilize this as a measure for how deep the complex is embedded in the ALD film. After photoexcitation, the complex undergoes ultrafast intersystem crossing. The resulting triplet excited state is best seen at delay times <10 ns in Fig. 5 by the red shift of the a′(1) mode with a signal appearing at 2060 cm−1. This excited state can be reductively quenched by an electron donor from solution,42,43 in our case 50 mM N-methyl phenothiazine (MePTZ) in ethanol, which is a reversible electron donor. Electron transfer to the Re complex is usually observed by a marker mode occurring at 1860 cm−1. This band is clearly seen in the case of the sample without ALD layer, see Fig. 5a, red box. It appears at about 10 ns, and disappears again on a μs timescale due to recombination with oxidized electron donor molecules.20 The same spectral signature can also be discerned for the sample with 10 ALD cycles (Fig. 5b), albeit much weaker. For thicker layers (Fig. 5c), reductive quenching of the Re complex can no longer be observed. Fig. 5d highlights this behaviour by showing transient cuts at 1 μs.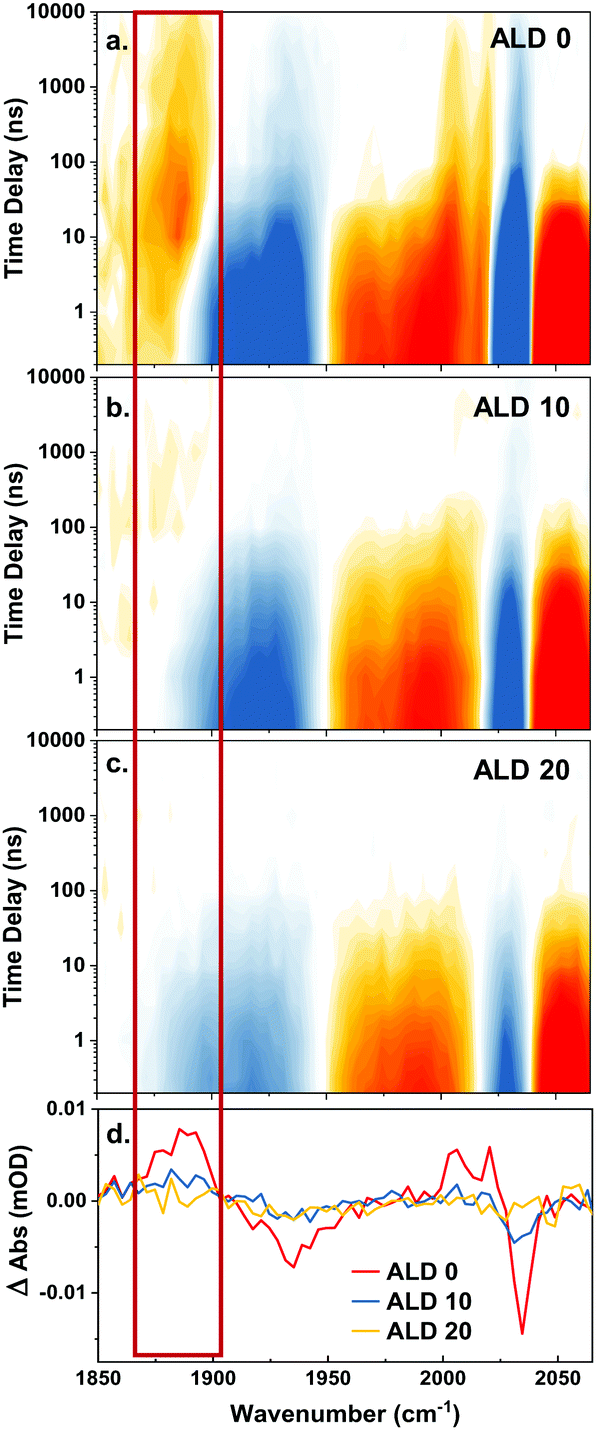 | ||
| Fig. 5 Transient IR spectroscopy of a sample (a) without ALD layer, (b) with 10 ALD cycles, and (c) with 20 ALD cycles. All data have been measured in presence of 50 mM N-methyl-phenothiazine as quencher. The red box marks the region where the Re− marker mode is observed. Panel (d) shows transient cuts at 1 μs, with the marker mode indicated as well. | ||
Besides the a′(2) and the a′′ bands of the reduced ReP-Cl (the signal marked with the red box in Fig. 5a–d) there is also a parallel shift of the a′(1) to lower energy (positive signal around 2010 cm−1 at t > 100 ns) in Fig. 5a and b. Another clear sign for the presence/absence of the photo reaction is given by persisting ground state bleach signals (t > 100 ns), depicted in blue in Fig. 5a–c from 1870 cm−1 to 1950 cm−1 (a′(2) and a′′) and especially at 2040 cm−1 (a′(1)). This negative signal persists longer than the acquisition window (10 μs). Similarly to the previously described marker mode it can still be observed for the case of 10 ALD layers, but not any more for 20 layers (red and blue vs. yellow lines in Fig. 5d).
3.4 2D-IR spectroscopy
2D-IR spectroscopy measures the solute–solvent interactions of the CO modes of ReP-Cl with its environment, as well as the timescales on which they are modulated by a process called spectral diffusion.30,32,44–46 That is, 2D-IR spectroscopy correlates the vibrational frequency upon excitation with that upon probing at a later time. In a highly fluctuating environment (like a solvent exposed surface), this correlation is quickly lost, while we expect a longer memory in a rigid ALD matrix.The 2D-IR spectra of the uncovered ReP-Cl surface immersed in ethanol are shown in the top row of Fig. 6. The blue signal is the ground state bleach, the red signal the excited state absorption. Shortly after excitation (left spectrum), both are elongated along the diagonal of the 2D plot, reflecting complete memory of the excitation frequency. After 30 ps, this correlation is lost and the signal has a mostly horizontal orientation. Thus, the probe frequency has become independent of the excitation frequency. The opposite case, a sample covered with 15 layers, is shown in the bottom row of Fig. 6. An inhomogeneously elongated lineshape can also be seen at 500 fs. However, the correlation persists up to 30 ps, where the signal becomes smaller due to excited state relaxation but hardly changes its shape. As often observed, the intensity of the ground state contribution on the diagonal is larger than that of the excited state absorption, and hence remains more distinct after decay. The middle pair of spectra in Fig. 6 highlights the intermediate case with 10 ALD layers, where the bands are inhomogeneously broadened at early times (500 fs), as in the other two cases. At 30 ps, the situation is in between that for the uncovered sample and that with 15 ALD cycles, indicating partial, but not complete, loss of correlation.
 | ||
| Fig. 6 2D-IR results of the a′(1) band of ReP-Cl on ZrO2 at 500 fs and 30 ps waiting time for different thicknesses of the ZrO2 ALD cover layer: 0, 10 and 15 cycles. | ||
4 Discussion and conclusion
We presented four complementary IR spectroscopy methods to discern to what extent ReP-Cl is covered by an ALD cover layer. Two of these methods, simple FTIR spectroscopy (Fig. 3) as well as 2D-IR spectroscopy (Fig. 6), measure the interactions of the –CO modes of ReP-Cl with their immediate environment, i.e., the solvent and/or the ZrO2 matrix. The other two methods, ligand exchange (Fig. 4) and reductive quenching by an electron donor (Fig. 5), measure to what extent the immobilized molecules are still accessible by molecules in solution.All methods consistently show that the transition between solvent exposed and fully covered happens at 10 ALD layers, as anticipated from the height of each ALD layer and the size of the molecule. However, the extent to which the transition is complete at 10 ALD layers varies when comparing the different methods. For example, ligand exchange with NCS− seems to be possible with 10 ALD layers to almost the same extent as without any cover (Fig. 4, compare height of the –NCS bands shown as red and blue dashed lines), while reductive quenching by MePTZ is barely happening (Fig. 5d, compare height of the Re− band shown as red and blue lines). This can probably be explained by the much smaller size of the SCN− ions in comparison to the electron donor molecule MePTZ. The size of the latter is about the same as that of the bipyridyl ligand of ReP-Cl. Thus, in the present case, it is not possible to inhibit ligand exchange (stabilization of the whole molecule), while retaining charge transfer to and from the complex (in order to use it as a photosensitizer).
Also spectral diffusion mostly stops at 10 ALD cycles already, indicating that the –CO modes are either in direct contact with the completely static ZrO2 matrix, or with solvent molecules whose flexibility is severely reduced, since they themselves are in direct contact with the ZrO2 matrix. This observation is very similar to published work of water in small reverse micelles. In these confined spaces (the water pool is around 2 nm in diameter) water molecules behave very differently from bulk water. Spectral diffusion slows down and the vibrational lifetime increases as well. The dynamics are dominated by interfacial water molecules that are in contact with the head group of the surfactant forming the reverse micelles.47,48 In combination with the results from ligand exchange (Fig. 4), we conclude that with 10 ALD layers, access to ReP-Cl is possible only via relatively small pores.
In conclusion, Fig. 7 shows how we envision the structural properties of the ALD overlayer at the transition when ReP-Cl just gets covered. Access for other molecules to the ReP-Cl is strongly reduced (Fig. 7a and b) and the flexibility of the ReP-Cl molecule also decreases dramatically within this rigid cavity that is formed by a surrounding ZrO2 layer. This situation is reached once the ALD layer just exceeds the height of ReP-Cl and after that (Fig. 7c) the observable changes are small.
 | ||
| Fig. 7 Explanation for the transition of the ReP-Cl system from a semi-flexible to a very rigid system due to increasing coverage of the molecule by solid amorphous ZrO2: panel (a) shows the uncovered sample, (b) the transition happening at 10 ALD cycles, and (c) the situation ReP-Cl is completely covered at ≳20 ALD cycles. | ||
Conflicts of interest
There are no conflicts to declare.Acknowledgements
We gratefully acknowledge financial support by the Swiss National Science Foundation (Grant CRSII2_160801/1) and the University Research Priority Program (URPP) for Solar Light to Chemical Energy Conversion (LightChEC) of the University of Zurich. Imaging was performed with support of the Center for Microscopy and Image Analysis, University of Zurich.Notes and references
- D. G. Nocera, Acc. Chem. Res., 2017, 50, 616–619 CrossRef CAS.
- H. Tian, ChemSusChem, 2015, 8, 3746–3759 CrossRef CAS.
- B. Zhang and L. Sun, Chem. Soc. Rev., 2019, 48, 2216–2264 RSC.
- R. E. Bangle, M. J. Mortelliti, L. Troian-Gautier, J. L. Dempsey and G. J. Meyer, J. Phys. Chem. C, 2020, 124, 25148–25159 CrossRef CAS.
- P. Xu and T. E. Mallouk, J. Phys. Chem. C, 2019, 123, 299–305 CrossRef CAS.
- K. L. Orchard, D. Hojo, K. P. Sokol, M.-J. Chan, N. Asao, T. Adschiri and E. Reisner, Chem. Commun., 2017, 53, 12638–12641 RSC.
- J. Willkomm, N. M. Muresan and E. Reisner, Chem. Sci., 2015, 6, 2727–2736 RSC.
- M. A. Gross, A. Reynal, J. R. Durrant and E. Reisner, J. Am. Chem. Soc., 2014, 136, 356–366 CrossRef CAS.
- J. Guo, C. She and T. Lian, J. Phys. Chem. C, 2007, 111, 8979–8987 CrossRef CAS.
- K. Hanson, M. D. Losego, B. Kalanyan, D. L. Ashford, G. N. Parsons and T. J. Meyer, Chem. Mater., 2013, 25, 3–5 CrossRef CAS.
- M. D. Losego and K. Hanson, Nano Energy, 2013, 2, 1067–1069 CrossRef CAS.
- A. K. Vannucci, L. Alibabaei, M. D. Losego, J. J. Concepcion, B. Kalanyan, G. N. Parsons and T. J. Meyer, Proc. Natl. Acad. Sci. U. S. A., 2013, 110, 20918–20922 CrossRef CAS.
- C. Detavernier, J. Dendooven, S. Pulinthanathu Sree, K. F. Ludwig and J. A. Martens, Chem. Soc. Rev., 2011, 40, 5242–5253 RSC.
- K. Kanomata, K. Tokoro, T. Imai, P. Pansila, M. Miura, B. Ahmmad, S. Kubota, K. Hirahara and F. Hirose, Appl. Surf. Sci., 2016, 497–502 CrossRef CAS.
- D. Wang, M. V. Sheridan, B. Shan, B. H. Farnum, S. L. Marquard, B. D. Sherman, M. S. Eberhart, A. Nayak, C. J. Dares, A. K. Das, R. M. Bullock and T. J. Meyer, J. Am. Chem. Soc., 2017, 139, 14518–14525 CrossRef CAS.
- M. D. Brady, L. Troian-Gautier, T. C. Motley, M. D. Turlington and G. J. Meyer, ACS Appl. Mater. Interfaces, 2019, 11, 27453–27463 CrossRef CAS.
- V. Miikkulainen, M. Leskelä, M. Ritala and R. L. Puurunen, J. Appl. Phys., 2013, 113, 021301 CrossRef.
- H. J. Son, C. H. Kim, D. W. Kim, N. C. Jeong, C. Prasittichai, L. Luo, J. Wu, O. K. Farha, M. R. Wasielewski and J. T. Hupp, ACS Appl. Mater. Interfaces, 2015, 7, 5150–5159 CrossRef CAS.
- C. Prasittichai, J. R. Avila, O. K. Farha and J. T. Hupp, J. Am. Chem. Soc., 2013, 135, 16328–16331 CrossRef CAS.
- K. Oppelt, R. Fernández-Terán, R. Pfister and P. Hamm, J. Phys. Chem. C, 2019, 123, 19952–19961 CrossRef CAS.
- K. Oppelt, M. Mosberger, J. Ruf, R. Fernández-Terán, B. Probst, R. Alberto and P. Hamm, J. Phys. Chem. C, 2020, 124, 12502–12511 CrossRef CAS.
- D. M. Hausmann, E. Kim, J. Becker and R. G. Gordon, Chem. Mater., 2002, 14, 4350–4358 CrossRef CAS.
- X. Wang, S. K. Ghosh, M. Afshar-Mohajer, H. Zhou, Y. Liu, X. Han, J. Cai, M. Zou and X. Meng, J. Mater. Res., 2020, 35, 804–812 CrossRef CAS.
- C. D. Windle, E. Pastor, A. Reynal, A. C. Whitwood, Y. Vaynzof, J. R. Durrant, R. N. Perutz and E. Reisner, Chem. – Eur. J., 2015, 21, 3746–3754 CrossRef CAS.
- K. Neuthe, F. Bittner, F. Stiemke, B. Ziem, J. Du, M. Zellner, M. Wark, T. Schubert and R. Haag, Dyes Pigm., 2014, 104, 24–33 CrossRef CAS.
- J. M. Smieja and C. P. Kubiak, Inorg. Chem., 2010, 49, 9283–9289 CrossRef CAS.
- L. Sévery, S. Siol and S. Tilley, Inorganics, 2018, 6, 105 Search PubMed.
- P. Hamm, R. A. Kaindl and J. Stenger, Opt. Lett., 2000, 25, 1798–1800 CrossRef CAS.
- J. Helbing and P. Hamm, J. Opt. Soc. Am. B, 2011, 28, 171 CrossRef CAS.
- L. M. Kiefer, J. T. King and K. J. Kubarych, Acc. Chem. Res., 2015, 48, 1123–1130 CrossRef CAS.
- L. M. Kiefer and K. J. Kubarych, J. Phys. Chem. A, 2015, 119, 959–965 CrossRef CAS.
- L. M. Kiefer and K. J. Kubarych, Coord. Chem. Rev., 2018, 372, 153–178 CrossRef CAS.
- A. Cannizzo, A. M. Blanco-Rodríguez, A. El Nahhas, J. Šebera, S. Záliš, A. Vlček and M. Chergui, J. Am. Chem. Soc., 2008, 130, 8967–8974 CrossRef CAS.
- B. Probst, A. Rodenberg, M. Guttentag, P. Hamm and R. Alberto, Inorg. Chem., 2010, 49, 6453–6460 CrossRef CAS.
- C. She, N. A. Anderson, J. Guo, F. Liu, W. H. Goh, D. T. Chen, D. L. Mohler, Z. Q. Tian, J. T. Hupp and T. Lian, J. Phys. Chem. B, 2005, 109, 19345–19355 CrossRef CAS.
- J. B. Asbury, Y. Wang and T. Lian, Bull. Chem. Soc. Jpn., 2002, 75, 973–983 CrossRef CAS.
- J. Song, A. Ge, B. Piercy, M. D. Losego and T. Lian, Chem. Phys., 2018, 512, 68–74 CrossRef CAS.
- J. E. Laaser, J. R. Christianson, T. A. Oudenhoven, Y. Joo, P. Gopalan, J. R. Schmidt and M. T. Zanni, J. Phys. Chem. C, 2014, 118, 5854–5861 CrossRef CAS.
- A. M. Blanco Rodríguez, A. Gabrielsson, M. Motevalli, P. Matousek, M. Towrie, J. Šebera, S. Záliš and A. Vlček, J. Phys. Chem. A, 2005, 109, 5016–5025 CrossRef.
- H. Takeda, K. Koike, H. Inoue and O. Ishitani, J. Am. Chem. Soc., 2008, 130, 2023–2031 CrossRef CAS.
- M. Mosberger, B. Probst, B. Spingler and R. Alberto, Eur. J. Inorg. Chem., 2019, 3518–3525 CrossRef CAS.
- M. Guttentag, A. Rodenberg, R. Kopelent, B. Probst, C. Buchwalder, M. Brandstätter, P. Hamm and R. Alberto, Eur. J. Inorg. Chem., 2012, 59–64 CrossRef CAS.
- J. Hawecker, J.-M. Lehn and R. Ziessel, J. Chem. Soc., Chem. Commun., 1984, 6, 328–330 RSC.
- S. T. Roberts, J. J. Loparo and A. Tokmakoff, J. Chem. Phys., 2006, 125, 084502 CrossRef.
- J. P. Kraack, D. Lotti and P. Hamm, J. Chem. Phys., 2015, 142, 212413 CrossRef.
- M. T. Zanni, Proc. Natl. Acad. Sci. U. S. A., 2016, 113, 4890–4891 CrossRef CAS.
- E. E. Fenn, D. B. Wong, C. H. Giammanco and M. D. Fayer, J. Phys. Chem. B, 2011, 115, 11658–11670 CrossRef CAS.
- R. Costard, N. E. Levinger, E. T. J. Nibbering and T. Elsaesser, J. Phys. Chem. B, 2012, 116, 5752–5759 CrossRef CAS.
Footnotes |
| † Electronic supplementary information (ESI) available. See DOI: 10.1039/d0cp06546c |
| ‡ Present address: Department of Chemistry, University of California, Berkeley, California 94720, USA. |
| This journal is © the Owner Societies 2021 |