
 Open Access Article
 This Open Access Article is licensed under a
 Creative Commons Attribution 3.0 Unported Licence
The defect chemistry of non-stoichiometric PuO2±x
William D.
Neilson
 a,
James T.
Pegg
bc,
Helen
Steele
d and
Samuel T.
Murphy
*a
a,
James T.
Pegg
bc,
Helen
Steele
d and
Samuel T.
Murphy
*a
aEngineering Department, Lancaster University, Lancaster, LA1 4YW, UK. E-mail: samuel.murphy@lancaster.ac.uk
b1QB Information Technologies (1QBit), Vancouver, British Columbia V6E 4B1, Canada
cDepartment of Chemistry, University College London, 20 Gordon Street, London WC1H 0AJ, UK
dSellafield Ltd, Sellafield, Cumbria, CA20 1PG, UK
First published on 11th February 2021
Abstract
An increased knowledge of the chemistry of PuO2 is imperative for the design of procedures to store, dispose, or make use of PuO2. In this work, point defect concentrations in PuO2 are determined by combining density functional theory (DFT) defect energies and empirical potential calculations of vibrational entropies. The obtained defect concentrations are expressed as a function of temperature and oxygen partial pressure and used to calculate non-stoichiometry in PuO2±x. The results show that the defect chemistry of PuO2 is dominated by oxygen vacancies and interstitials. Hypo-stoichiometric PuO2−x is accommodated by both the uncharged oxygen vacancy  and positively charged oxygen vacancy
  at small values of x, with
  increasingly dominant with increasing x. The negatively charged oxygen interstitial (O2−i) is found to accommodate hyper-stoichiometry (PuO2+x), but reluctance to form hyper-stoichiometric PuO2+x is observed, with oxygen interstitials present only in very low concentrations irrespective of conditions. The small degree of hyper-stoichiometry found is favoured by low temperatures.
1 Introduction
The handling, storage and disposal of PuO2 (the form civilian plutonium stockpiles are maintained in)1 presents considerable safety and security challenges. Large stockpiles of PuO2 currently exist in interim storage awaiting decisions regarding its long-term disposal or re-use; PuO2 attracts interest as a component of future nuclear reactor fuels and 238Pu, in the form 238PuO2, is the most commonly used isotope in radioisotope thermoelectric generators and heating units for space applications.2 To enable safe storage and/or application a thorough understanding of how the material evolves in the short to medium term is required, which can be aided by studying the materials defect chemistry.The potential pressurisation of some of the containers used to store PuO2 is of major concern, with multiple pressurisation mechanisms proposed.3 The formation of hyper-stoichiometric PuO2+x may play a role in the chemical reactions producing gas. It is reported that PuO2+x participates in moisture enhanced corrosion of Pu, producing H2,4–6 although this is less of a concern in the UK, where the oxide is stored. Through experimental investigation of PuO2 at conditions relevant to intermediate storage, Haschke et al.4,5 have reported the existence of the hyper-stoichiometric PuO2+x phases, while subsequent work has shown PuO2+x may be best described as a compound containing OH− and H2O species, with excess oxygen accommodated in molecular complexes of Pu(V).7,8 The defect chemistry of PuO2 helps describe the formation and properties of non-stoichiometric PuO2 and the equilibrium of species (e.g. oxygen) between the PuO2 solid and the surrounding gases.
PuO2 is very challenging to study both experimentally and theoretically. Experimental challenges include strict regulation, the difficulty in preparing and handling samples, and continuous crystal lattice damage and transmutation of Pu due to self-irradiation.9 Many of the challenges involved in theoretical calculation arise from trying to correctly describe the 5f electrons. PuO2 is classified as a strongly correlated material, with a ground state of localised 5f electrons.10 In conventional density functional theory (DFT), an over de-localisation of these electrons results in the self-interaction error that causes PuO2 to be described as conducting when in fact PuO2 is classified as a charge-transfer insulator.10
A method used extensively to overcome this shortcoming is to adopt a Hubbard-like correction to give the DFT+U method.10 The U parameter modifies the electron repulsion of the 5f electrons and addresses the self-interaction error, yielding good reproduction of the ground-state electronic properties seen in actinide dioxides.10,11 Two adjustable variables help construct the U correction parameter. These are the on-site Coulombic (U) and exchange interaction (J) parameters, which are used to calculate Ueff = U − J in the Dudarev et al. formulism.12 The U and J parameters are obtained by fitting to structural and electronic properties of PuO2.11,13–17 Reproduction of the electronic band gap (Eg) is seen as a strong metric of success. Most previous DFT+U studies of PuO2 fit U and J to reproduce the bandgap of McNeilly et al.18 (Eg = 1.8 eV), however the much more recent experimental study of McCleskey et al.19 reports a higher Eg of 2.8 eV. This large discrepancy in the experimental bandgap for PuO2 poses significant issues for determination of the appropriate values for U and J.
An alternative method to DFT+U used to avoid the problems encountered with the self-interaction error is to use hybrid functionals. Hybrid functionals, which blend a portion of the Hartree–Fock (HF) exchange into a part of a density functional, have been shown to offer significantly improved descriptions of band gaps, especially in small- to medium- gap systems (∼<5 eV).20 Compared to the DFT+U method, hybrid functionals require significantly more computational effort to utilise, but several studies have applied hybrid functionals to study PuO2 with good experimental replication achieved.14,21
An important aspect in correctly simulating PuO2 is selection of an accurate description of its magnetic ground state. Experimental and theoretical studies have indicated differing ground states: a singlet diamagnetic (DM) ground-state is indicated from experimental observations22 whereas ferromagnetic (FM) or anti-ferromagnetic (AFM) ground states have in the past been predicted from theory.14,17,21,23 Many studies select 1k AFM order to describe PuO2.13,17,21,24–26 In their comprehensive study of magnetic order in PuO2, Pegg et al.14 found that 1k AFM states produce an incorrect crystal structure (the correct structure as indicated by experimental results is Fm![[3 with combining macron]](https://www.rsc.org/images/entities/char_0033_0304.gif) m crystal symmetry)27 and that the choice of AFM domain (longitudinal or transverse) had a significant impact on the electronic and structural properties of PuO2. This is a key finding, as most studies do not differentiate between collinear magnetic structures. Pegg et al.14 propose a longitudinal 3k AFM ground-state. Of all magnetic configurations tested, this was the lowest in energy, was able to retain Fmm crystal symmetry and replicated well the physical properties of PuO2.
m crystal symmetry)27 and that the choice of AFM domain (longitudinal or transverse) had a significant impact on the electronic and structural properties of PuO2. This is a key finding, as most studies do not differentiate between collinear magnetic structures. Pegg et al.14 propose a longitudinal 3k AFM ground-state. Of all magnetic configurations tested, this was the lowest in energy, was able to retain Fmm crystal symmetry and replicated well the physical properties of PuO2.
To obtain this ground-state, spin orbit interaction (SOI) was included. Not including SOI resulted in a different magnetic ground state being obtained, highlighting the importance of its inclusion. The different observations found in experiment are perhaps a consequence of the aforementioned experimental challenges. Possible theories include that current experimental resolution cannot identify an ordered magnetic state and/or an AFM-DM transition could be occurring outside the temperature ranges investigated.14 The experimental measurement of isostructural NpO2 has also proven difficult, where an odd number of electrons should result in a magnetic moment.
Several studies have investigated the formation energies of intrinsic and extrinsic defects in PuO2.24,26,28–33 Thermochemical models have been produced that study the defect chemistry of PuO2−x, over a large stoichiometry range,34,35 whilst using DFT+U and a point defect model, Lu et al.24 determined the stability of charged defects within PuO2±x. Lu et al.24 find that, at 1000 K, oxygen vacancies dominate in the region of hypo-stoichiometry, whilst oxygen interstitials dominate the region of hyper-stoichiometry.
It is common when creating a point defect model from first principles to assume that the Gibbs free energy to form a defect can be well approximated by the defect formation energy. However, this approximation neglects the contribution of the vibrational entropy, Svib. Recent work by Cooper et al.36 and Soulie et al.37 on UO2 has shown that it is only by including the change in vibrational entropy due to defect incorporation that it is possible to reproduce the defect chemistry observed in experiment.
Therefore, the objective of this paper is to understand the defect chemistry of PuO2 and how it might evolve under storage conditions taking into account the complex electronic and magnetic structures and incorporating the vibrational entropy into an updated point defect model.
2 Method
To determine how the concentrations of defects in PuO2 varies with environmental conditions requires the combination of DFT defect energies and simple thermodynamics, starting from eqn (1). Using Boltzmann statistics, this equation shows that the concentration of defect i, ci, can be related to the change in Gibbs free energy, ΔGif, to form defect i: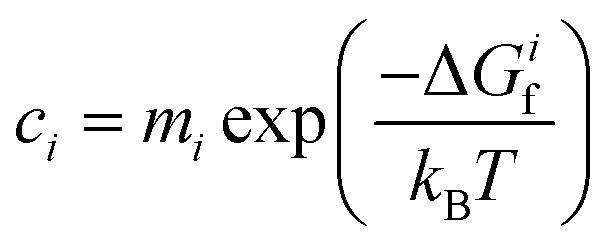 | (1) |
 | (2) |
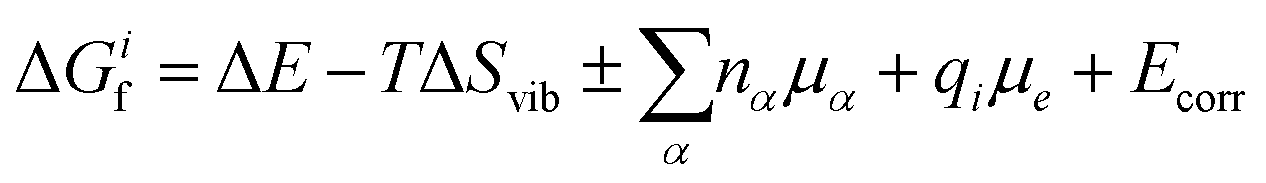
Following Cooper et al.36 and Soulie et al.,37 two differing atomistic simulation approaches were applied to obtain the parameters of eqn (2): ΔE is found using DFT and ΔSvib is obtained using empirical pair potentials. The vibrational entropy of a lattice is a function of the lattices phonon frequencies which are determined through force calculations associated with the displacements of atoms from their ground state positions. This becomes a very large calculation when defects are introduced, due to the removal of symmetry. Therefore, empirical potentials are used to calculate the vibrational entropies. The calculation and use of all the terms that contribute to eqn (2) are discussed in more detail throughout the rest of this section.
2.1 Defect energies
DFT calculations were performed using the Vienna ab initio Simulation Package (VASP).38–41 The projector augmented wave (PAW)42,43 method has been implemented with the frozen-core approximation. 5f46s26p66d27s2 of Pu and 1s22s22p6 of O are treated as valence electrons. Following convergence testing, the cut-off energy for the planewave basis set was selected to be 500 eV and a 4 × 4 × 4 Monkhurst-Pack k-point mesh44 was used for the 12-atom PuO2 unit cells. For 2 × 2 × 2 supercells used in defect simulations, the k-point mesh was adjusted to 2 × 2 × 2. SOI45 was considered in the calculations with a longitudinal 3k AFM magnetic configuration adopted for PuO2, described in Fig. 1. | ||
| Fig. 1 The crystal (left) and magnetic (centre) structure of Fmm PuO2, with plutonium and oxygen atoms depicted with blue and red spheres respectively. The direction of the effective magnetic moment (μ) on each plutonium ion is shown by an arrow and the μ = (a,b,c) wave-vector matrix (right). | ||
To study the properties of the bulk PuO2, we replicate the study of Pegg et al.14 and use the hybrid Heyd–Scuseria–Ernzerhof (HSE06) functional:46–49
 | (3) |
For calculation of defect energies in PuO2 supercells hybrid functionals are computationally too expensive; DFT calculations are therefore performed with the generalised gradient approximation (GGA) using the PBE functional revised for solids (PBEsol).50,51 The PBEsol functional was shown by Pegg et al.11 to best reproduce experimental properties in actinide dioxides after the HSE06 functional. The strong correlations due to f-electrons in Pu were accounted for by applying the DFT+U method using the Liechtenstein formulism.52 When using PBEsol+U, the iteration threshold for electronic convergence is 1 × 10⁻⁶ eV and for ionic convergence is 1 × 10⁻² eV Å−1 and 2 × 10⁻² eV Å−1 when simulating PuO2 unit cells and defect containing PuO2 supercells, respectively. In this study, the U parameter within PBEsol+U was selected such that it reproduced the band gap obtained from the HSE06 functional (3.04 eV). It was chosen to reproduce the HSE06 bandgap as the experimental data shows a large variation and this functional has been proven to replicate experimental bandgaps.20 This resulted in a U parameter of 7.0 eV being used for this study (see Fig. 2). The use of a high U parameter is not without precedence, with several previous studies adopting U values exceeding 6.0 eV when studying actinide dioxides, including PuO2.11,53 The J parameter was fixed at a value of 0.0 eV throughout this study, as any introduction of J was shown by Pegg et al.11 to detrimentally affect the reproduction of the band gap for PuO2. The resulting equilibrium properties found for longitudinal 3k AFM PuO2 simulated using either the HSE06 functional or PBEsol+U (U = 7.0 eV) are presented in Table 1. The discrepancy between the theoretical and experimental description of the magnetic properties of PuO2 is discussed in the introduction.
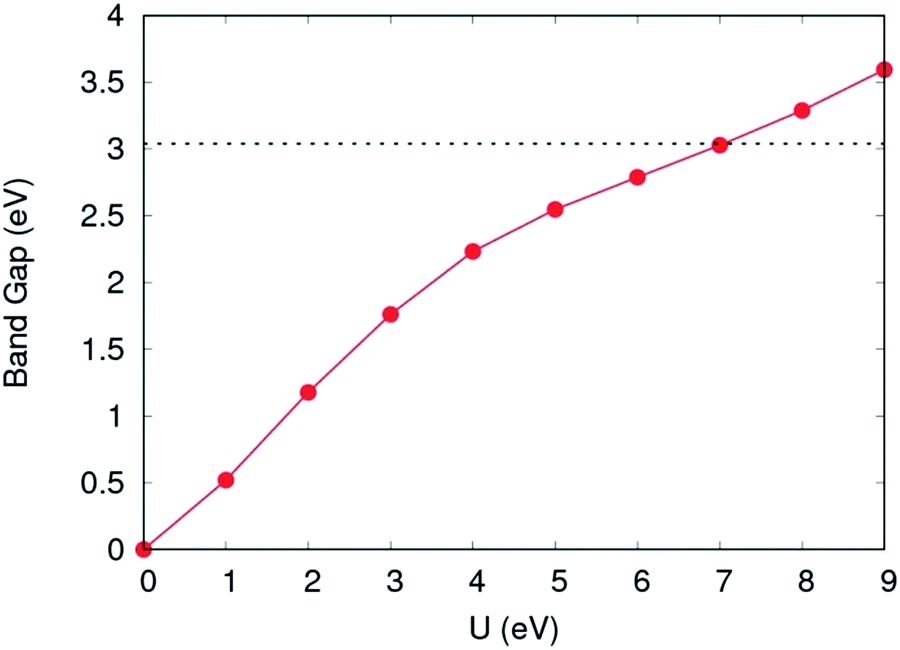 | ||
| Fig. 2 Variation of band gap as a function of the Coulomb modifier (U). Band gap value calculated using the HSE06 functional shown with horizontal dotted line. | ||
Defects were inserted into 2 × 2 × 2 expansions of the 12-atom PuO2 unit cell. Only one unique site exists for the vacancies and interstitials of plutonium and oxygen considered, due to the symmetry of the PuO2 lattice. Different charge states were considered for each defect, modelled by adding or removing electrons from the supercell. Defect-containing supercells were relaxed under constant volume, using the lattice constants obtained from defect-free simulations. The defects considered in this study are denoted below, using Kröger–Vink notation, modified to display charge as an integer value (no charge indicated by: ×):54
Oxygen interstitials: Oi×, O1−i and O2−i
Oxygen vacancies:  , V1+O and V2+O
Plutonium interstitials:  , Pu1+i, Pu2+i, Pu3+i and Pu4+i
Plutonium vacancies:  , V1−Pu, V2−Pu, V3−Pu and V4−Pu
2.2 Finite size correction
The introduction of charged defects into the small simulation supercells accessible using DFT introduces a number of finite size effects as discussed extensively in ref. 55. These include Coulombic interactions between the defect and its periodic image as well as with the neutralising background charge. The result is that defect formation energies exhibit a strong dependence on the size of the supercell used and this must be corrected for. The most basic correction that can be applied to remove these interactions is the point charge (PC) correction. For a cubic system, such as PuO2, the PC correction energy can be written as:56 | (4) |
 is calculated and used as the static dielectric constant of PuO2. We obtain a static dielectric constant of 19.66. This compares favourably to the experimental value (18.959) and falls between the experimental value for UO2 (23.860) and the DFT-obtained value for AmO2 (17.4061), thus fits within the emerging trend.
Makov and Payne (MP) extended the PC correction to include a term with L−3 order.62 More recently Freysoldt, Neugebauer and Van de Walle (FNV) developed a correction that compares the planar-averaged electrostatic potentials of supercells with and without defects (Vdefect,q & Vbulk respectively).63 The FNV scheme correction energy is summarised following ref. 64 as:
| Ecorr = EisoPC − qΔVPC,q/b|far | (5) |
| Vq/b = Vdefect,q − Vbulk | (6) |
| ΔVPC,q/b = Vq/b − VPC,q | (7) |
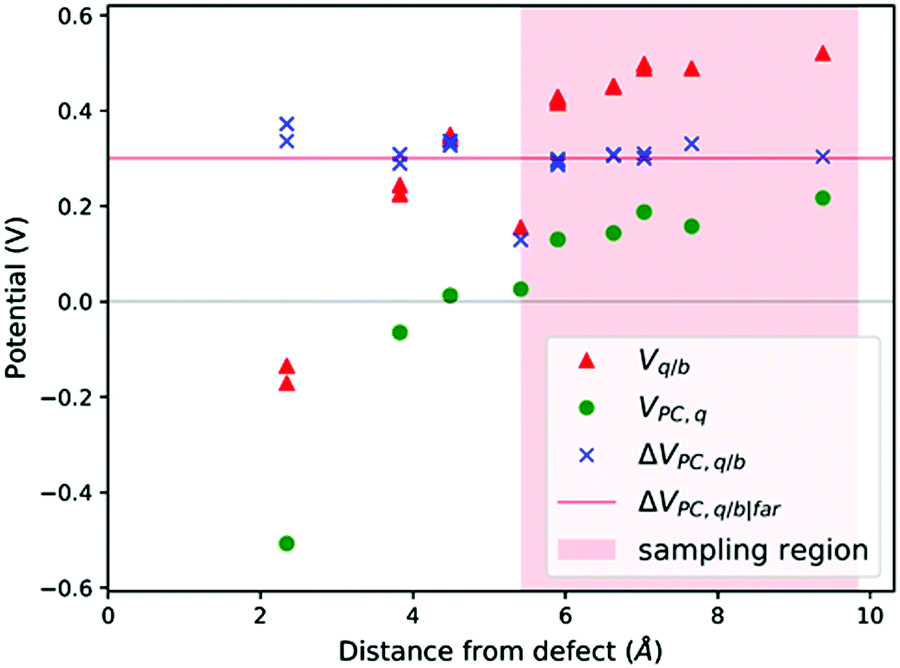 | ||
| Fig. 3 V q/b, VPC,q and ΔVPC,q/b calculated at the atomic positions of a PuO2 supercell with a V4−Pu defect. ΔVPC,q/b|far calculated by averaging ΔVPC,q/b across sampling region. | ||
 | (8) |
 | ||
| Fig. 4 The phonon density of states of PuO2 calculated with the CRG empirical potential (blue), compared to experimental data68 (red). | ||
In this formula, h is Plancks's constant and N is the number of atoms in the crystal. In this study, the system to calculate vibrational entropies is a 4 × 4 × 4 expansion of the PuO2 unit cell. Defective supercells are created by adding or removing atoms and are relaxed under constant volume in the same way as in the DFT simulations. Defect vibrational entropies are found by calculating the difference in vibrational entropies between the defective and perfect supercell (ΔSvib) and presented in Table 2. The same value of ΔSvib is given to all charge states of a given defect.
| T (K) | Defect entropy, ΔSvib/kB | |||
|---|---|---|---|---|
| VO | Oi | VPu | Pui | |
| 400 | 0.545 | 4.572 | −3.783 | 2.518 |
| 600 | −0.453 | 5.373 | −5.245 | 3.110 |
| 800 | −1.230 | 6.058 | −6.208 | 3.725 |
| 1000 | −1.868 | 6.638 | −6.940 | 4.270 |
| 1200 | −2.391 | 7.137 | −7.508 | 4.746 |
| 1400 | −2.843 | 7.578 | −7.996 | 5.164 |
| 1600 | −3.238 | 7.961 | −8.402 | 5.547 |
| 1800 | −3.574 | 8.309 | −8.761 | 5.883 |
| 2000 | −3.899 | 8.599 | −9.086 | 6.174 |
2.4 Chemical potentials
The starting point for determining the chemical potentials is to define the chemical potential of solid PuO2 (μPuO2(s)) in terms of the chemical potential per formula unit of the constituent species, namely plutonium, μPu(PO2,T), and oxygen, μO2(PO2,T):| μPu(PO2,T) + μO2(PO2,T) = μPuO2(s) | (9) |
For a solid,  , therefore the temperature and pressure dependencies have been dropped. In equilibrium conditions, the chemical potential of Pu cannot exceed that of solid Pu, otherwise a Pu precipitate would form. This upper bound is the Gibbs free energy of Pu in its natural state. It can therefore be said that in Pu rich conditions:
| μPu(PO2,T) = μPu(s) | (10) |
To find μPu(s) we simulate the α phase of Pu with DFT using PBEsol+U. We encompass the recommendation of the review by Söderlind et al.71 to use small U and J values, setting U and J parameters at 2.2 eV and 0.58 eV respectively. The atomic volume obtained with these values (18.27 Å3) matched closely the atomic volume obtained by Söderlind et al.71 when using PBE+U. To determine the chemical potential of oxygen the approach of Finnis et al.72 is adopted. This method uses the known experimental formation energy of the oxide  73 to obtain the chemical potential of oxygen at standard temperature and pressure:
 | (11) |
Unlike the solid species in eqn (11), the temperature and pressure dependence of the oxygen chemical potential cannot be neglected and is extrapolated from  using formulas constructed by Johnston et al.:74
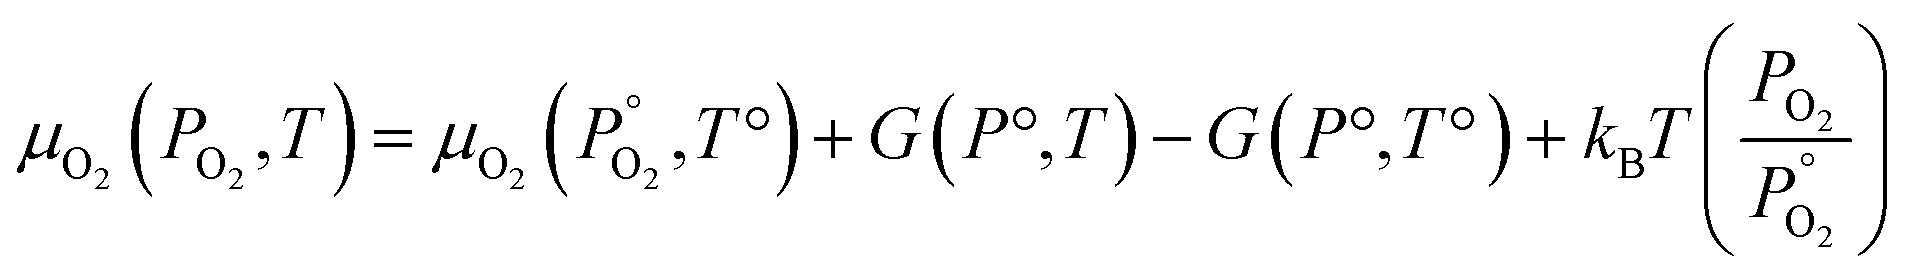 | (12) |
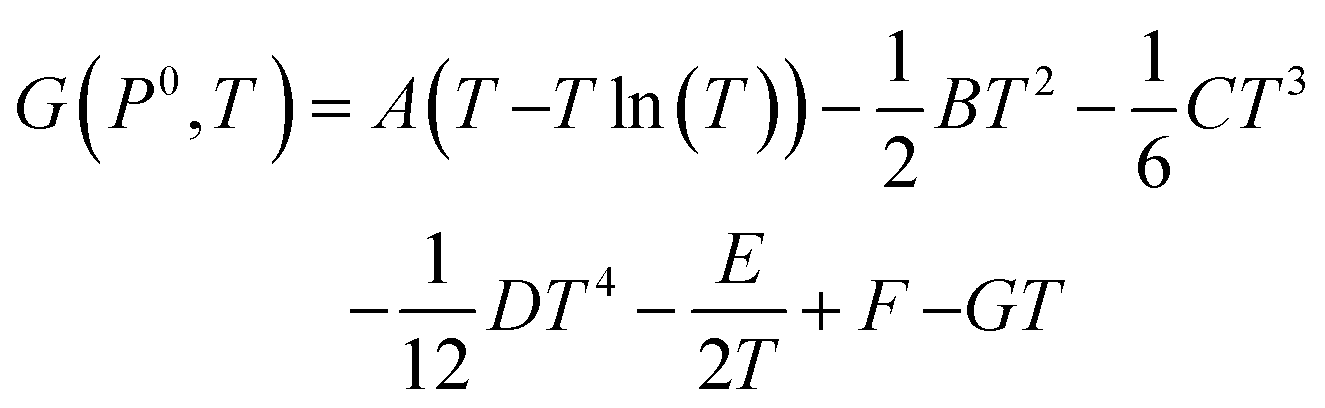 | (13) |
| A | 29.659 × 10⁻³ kJ mol−1 K−1 |
| B | 6.137261 × 10⁻⁶ kJ mol−1 K−1 |
| C | −1.186521 × 10⁻⁹ kJ mol−1 K−1 |
| D | 0.095780 × 10⁻¹² kJ mol−1 K−1 |
| E | −0.219663 × 10⁻³ kJ mol−1 K−1 |
| F | −9.861391 kJ mol−1 K−1 |
| G | 237.948 × 10⁻³ kJ mol−1 K−1 |
The electron chemical potential, μe = EVBM + εF, is expressed as the sum of the energy of the valence band maximum (VBM), EVBM, and the electron chemical potential above the VBM, εF. As overall charge neutrality of the system must be maintained, the concentrations of ionic and electronic defects must be such that at any given temperature and oxygen partial pressure the following criteria is met:75
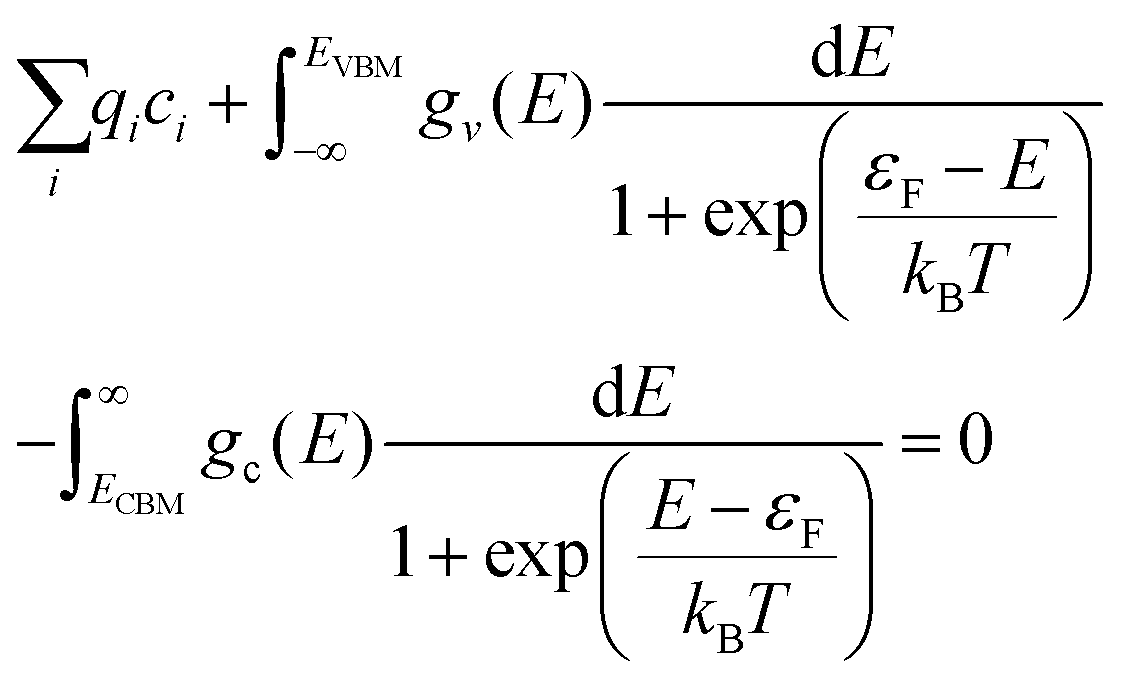 | (14) |
The first term is the sum of the charges the of ionic defects. The second and third terms are given by applying Fermi–Dirac statistics to the electronic DOS to obtain the concentrations of electrons (e−) in the conduction band and concentration of holes (p−) in the valence band, respectively. Within these two integrals are gv(E) and gc(E),the density of electronic states in the valence band and conduction band per formula unit of PuO2, respectively. For calculation of the electron population, ECBM is the energy of the conduction band minimum.
With the above expressions it is possible to construct diagrams showing the variation of defect concentrations with environmental conditions; at each condition there exists a unique value of εF that satisfies the charge neutrality condition. The Defect Analysis Package76 employs a linear bisection to find the value of εF that ensures charge neutrality for any given oxygen partial pressure and temperature. Additionally, the deviation from stoichiometry, x in PuO2±x, is calculated from the defect concentrations summed over all charge states:
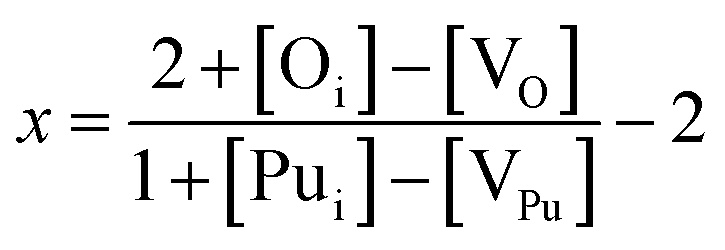 | (15) |
3 Results & discussions
The formation energy of all defects considered are plotted as a function of the Fermi level in Fig. 5. Fig. 5 shows the formation energies at 1000 K and O-rich (10−2 atm)/O-poor (10−30 atm) conditions, displaying only the charge state of each defect that corresponds to the lowest formation energy at a given position in the bandgap. Under O-rich conditions Pui defects have very high formation energy and so are not shown in Fig. 5. For each defect it can be seen that, to varying degrees, the charge state with the lowest energy varies across the bandgap. VPu defects have the least variation, its full ionic charge state (V4−Pu) has the lowest energy across the majority of the bandgap. Conversely, under halfway across the bandgap, the neutral defect is seen to overtake the fully charged V2+O defect as the oxygen vacancy with the lowest formation energy. Prodan et al.21 report that O1−i is the most energetically favourable charge state for the oxygen interstitial. We find that although the O2−i defect has the lowest energy for much of the bandgap, O1−i becomes favourable at low Fermi level values, with O×i most favourable at the lowest Fermi levels close to the valence band. Therefore, under certain conditions we also find O1−i to be the preferred interstitial. Across the band gap the favourable charge state of Pui defects are seen to vary, with each charge state except Pu2+i possessing the lowest formation energy over fairly large ranges in Fermi level.
 | ||
| Fig. 5 Defect formation energies for O vacancies & interstitials as well as Pu vacancies & interstitials as a function of Fermi energy. Calculated at 1000 K and oxygen partial pressure of 10−2 atm (left) and 10−30 atm (right). Only the charge state with the lowest formation energy for a given Fermi level is shown for each defect, represented with numeric label. At an oxygen partial pressure of 10−2 atm Pu interstitials are omitted from the plot as their formation energy is very high. | ||
Table 4 displays the calculated reaction energy of unbound oxygen and plutonium Frenkel pairs (FP) and the unbound Schottky tri-vacancy (STV), with defects formally charged. Each reaction energy is found to be within the range of previous theoretical calculations, which are provided for comparison in Table 4. The ranges are seen to be very wide; in the DFT+U studies, the U and J parameters adopted varied significantly indicating the importance of electron repulsion of the 5f electrons on the formation of point defects. The review of Murch et al.77 provides the only experimental comparison available, indicating that the oxygen Frenkel pair has a much lower formation energy than calculated here. Caution is however attached to the oxygen Frenkel pair experimental result, which is described by Murch et al.77 as “on the low side”. Our results match the established pattern in all techniques, where O-FP < STV < Pu-FP, showing that oxygen-type defects are significantly more favourable than plutonium-type defects.
| Process | Charge states | Reaction energy (eV) | ||||||||
|---|---|---|---|---|---|---|---|---|---|---|
| DFT+U | Empirical pair potential | Experiment | ||||||||
| This work | LSDA+U24 | LDA+U30 | GGA+U31 | GGA+U32 | Ref. 26 | Ref. 27 | Ref. 32 | O diffusion77 | ||
| O Frenkel pair | V2+O + O2−i | 4.89 | 3.48 | 4.58 | 9.78 | 3.90 | 5.52 | 2.66 | 4.90 | 2.72–2.92 |
| Pu Frenkel pair | V4−Pu + Pu4+i | 13.86 | 15.19 | 10.02 | 19.78 | 11.90 | 13.58 | 10.03 | 24.00 | |
| Schottky defect | V4−Pu + 2V2+O | 7.65 | 7.51 | 6.09 | 14.92 | 10.40 | 3.54 | |||
The resulting point defect concentrations, calculated as a function of temperature at a fixed oxygen partial pressure of 10−5 atm, are presented in Fig. 6. Concentrations of oxygen defects are observed to be multiple orders of magnitude greater than cation defect concentrations across all temperatures. This agrees with previous experimental work that metal defects are minority defects in PuO2.77 All plutonium vacancy and interstitial defects are predicted to have such low concentrations that do not appear in Fig. 6.
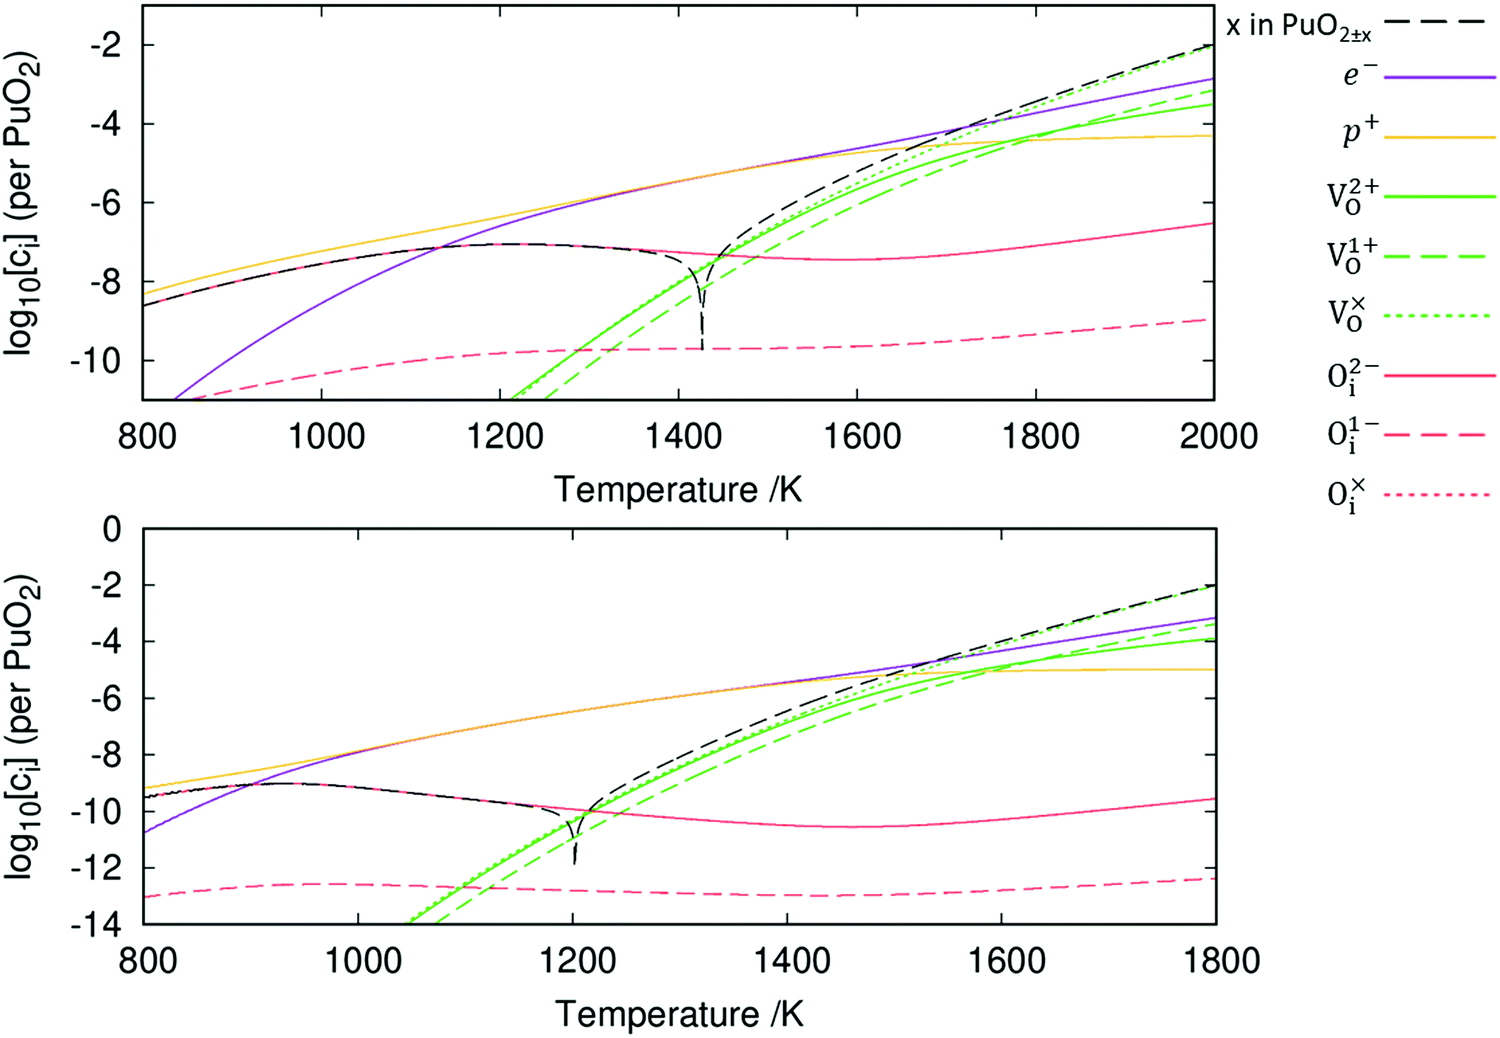 | ||
| Fig. 6 The defect chemistry of PuO2±x as a function of temperature at an oxygen partial pressure of 10−5 atm. The diagrams include (top) and exclude (bottom) vibrational entropy contributions when calculating defect concentrations. | ||
Fig. 6 also displays the impact of including vibrational entropy contributions. Inclusion of vibrational entropy is seen to increase the temperature at which perfect stoichiometry occurs: ≈1200 K when vibrational entropy is omitted versus ≈1425 K when included. Perfect stoichiometry occurs when [Oi] = [VO], meaning that vibrational entropy inclusion further promotes Oi defects. From the point of perfect stoichiometry, increasing or decreasing temperature results in hypo-stoichiometric or hyper-stoichiometric PuO2±x, respectively. The diagrams display the reluctance for PuO2 to be hyper-stoichiometric in oxygen, with x in PuO2+x peaking at approx. 10−7 at 1210 K (when vibrational entropy included), representing negligible hyper-stoichiometry. As temperature decreases from this peak, the concentration of defects and the value of x in PuO2+x falls. The concentration of defects becomes increasingly negligible; this continues beyond the range of Fig. 6, at lower temperatures. It can be seen hypo-stoichiometry is much more favourable, which correlates with the wide hypo-stoichiometric region evident in the phase diagram of PuO2.78
From this point onwards, all plots include vibrational entropy. Broadly speaking, the diagram in Fig. 6 can be broken down into three regions based upon electron and hole concentrations: these are a hole-dominant region, a region of equal concentration and an electron dominant region. At low temperatures the Oi defects dominate and are charge compensated by holes. The [Oi]![[thin space (1/6-em)]](https://www.rsc.org/images/entities/char_2009.gif) :[p+] ratio is approximately 1:2, due to the dominance of the O2−i defect. Increasing the temperature past the point of peak-hyper-stoichiometry, which coincides with peak [Oi], the hole concentration is no longer set such that it provides charge compensation to Oi defects. Instead, the concentration of holes matches the concentration of electrons and the Fermi level remains fixed at the midpoint of the bandgap. [VO] increases with temperature, resulting in increasing hypo-stoichiometry. At high temperatures, [VO] reaches levels close to the concentration of holes and electrons. To accommodate any further increases in [VO], the concentration of electrons increases to maintain charge neutrality. The concentration of holes then decreases as the temperature increases resulting in the Fermi level increasing. In this region, the [VO]:[e−] ratio varies in order to provide charge compensation to both V2+O and V1+O defects.
:[p+] ratio is approximately 1:2, due to the dominance of the O2−i defect. Increasing the temperature past the point of peak-hyper-stoichiometry, which coincides with peak [Oi], the hole concentration is no longer set such that it provides charge compensation to Oi defects. Instead, the concentration of holes matches the concentration of electrons and the Fermi level remains fixed at the midpoint of the bandgap. [VO] increases with temperature, resulting in increasing hypo-stoichiometry. At high temperatures, [VO] reaches levels close to the concentration of holes and electrons. To accommodate any further increases in [VO], the concentration of electrons increases to maintain charge neutrality. The concentration of holes then decreases as the temperature increases resulting in the Fermi level increasing. In this region, the [VO]:[e−] ratio varies in order to provide charge compensation to both V2+O and V1+O defects.
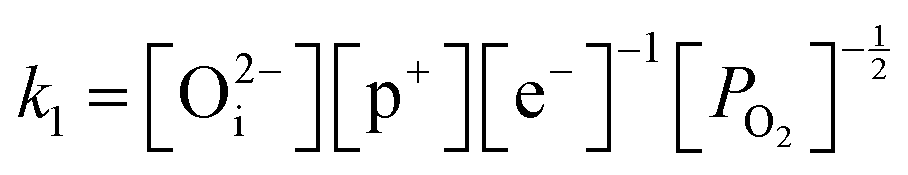
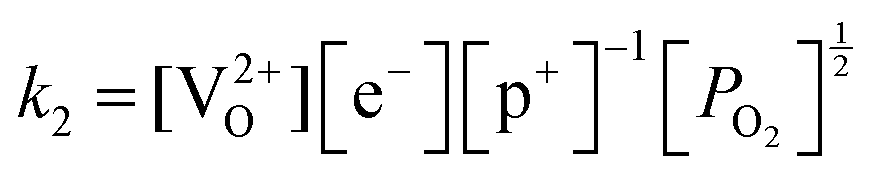
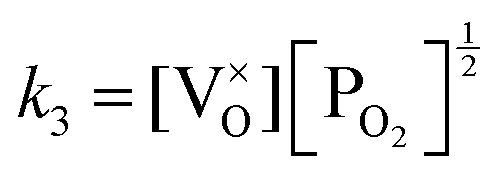
The defect chemistry of PuO2 as a function of oxygen partial pressure is presented in the Brouwer diagrams of Fig. 7, at temperatures 1000 K and 2000 K. At 1000 K, in the region close to perfect stoichiometry, where x in PuO2±x is at its smallest, O2−i is the dominant oxygen interstitial. The dominant oxygen vacancies are found to be V2+O and  , which have concentrations of similar magnitude, with
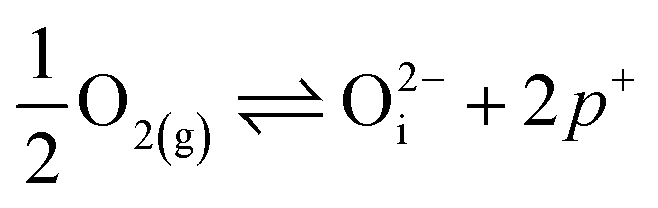
  at narrowly higher concentrations. In this region of near-stoichiometry, the defect chemistry and dependence on oxygen partial pressure can be attributed to the following defect reactions occurring:
 | (16) |
 | (17) |
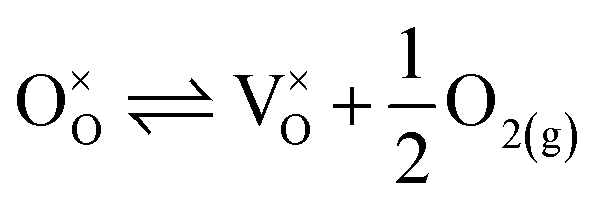 | (18) |
 | ||
| Fig. 7 Calculated Brouwer diagram showing the defect chemistry of PuO2±x as a function of the oxygen partial pressure at 1000 K (top) and 2000 K (bottom). Both diagrams include vibrational entropy contributions when calculating defect concentrations. | ||
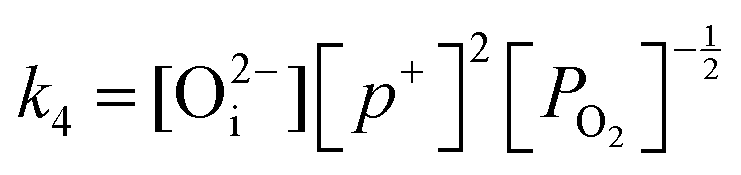
Application of the law of mass action to eqn (16), (17) and (18) finds equilibrium constants of k1, k2 and k3, respectfully:
 | (19) |
 | (20) |
 | (21) |
Given that [e−] = [p+], it can be seen that [O2−i] is proportional to  , whilst [V2+O] and
  are proportional to
  in this region. Increasing the oxygen partial pressure beyond the region of near-stoichiometry sees the concentration holes, O2−i defects and x in PuO2+x transition to an oxygen partial pressure dependence of
  . With too few electrons available, two holes are created for charge compensation of the O2−i defect. Eqn (22) and (23) show the defect reaction responsible and the corresponding equilibrium constant, respectively. Given that [O2−i] = 2[p+], it can be shown using eqn (23) that [O2−i] is proportional to
  in the hyper-stoichiometric region.
 | (22) |
 | (23) |
Reducing the oxygen partial pressure below the region of near-stoichiometry sees the concentration of V2+O defects transition to a dependence on the oxygen partial pressure of 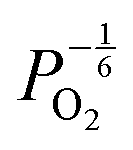 , whilst concentration of
  defects maintain a dependence on the oxygen partial pressure of
 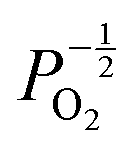 . Consequently, it is eqn (18) that is the dominant defect reaction in the hypo-stoichiometric region, causing
  defects to become the dominant defect and the source of hypo-stochiometric PuO2−x. The dependence of x in PuO2−x has been shown experimentally to have a dependence on the oxygen partial pressure of
  ,35 indicative of the V1+O vacancy being dominant. This result reflects experimental data at large non-stoichiometry, where the point defect model breaks down due to the occurrence of complex processes involving defect clusters. Our result, that reflects very small non-stoichiometry, can therefore not be directly compared.
Comparing the two Brouwer diagrams in Fig. 7, increasing temperature creates a more reducing environment, increasing oxygen vacancy concentrations. Perfect stoichiometry therefore occurs at higher oxygen partial pressures. Aside from this, in the 1000 K temperature range investigated here, temperature is found not to alter the defect chemistry of PuO2 significantly.
The finding that the defect chemistry of PuO2 is dominated by oxygen interstitials and vacancies agrees with the predictions in the PuO2 point defect study of Lu et al.24 However, the present study has found a significant increase in the concentrations of non-formally charged defects relative to their formally charged counterparts. Whereas Lu et al.24 found [O2−i] and [V2+O] defects to be multiple orders of magnitude greater than any non-formally charged defect, here  is the dominant oxygen vacancy and concentration of O1−i is predicted to be much closer to that of O2−i. This can be partially attributed to the larger bandgap used in this work (3.04 eV vs. 1.70 eV). Electrons and holes, which are required to provide charge compensation to charged defects, have an increased formation energy with increased band gap. Therefore, increasing the bandgap increases the favourability of defects with a smaller charge magnitude. Additionally, we report a much lower degree of hyper-stoichiometry. For example, at a temperature of 1000 K and oxygen partial pressure of 10−5 atm Lu et al.24 report a value of x in PuO2+x of ≈10−3, several orders of magnitude greater than the value of ≈10−6 found in this study.
4 Conclusions
In summary, using DFT+U with a longitudinal 3k AFM magnetic structure and SOI, the point defect concentrations in PuO2±x as a function of temperature and oxygen partial pressure have been determined. The results predict that the defect chemistry of PuO2 is dominated by oxygen vacancies and interstitials, but that even at high oxygen partial pressures, PuO2 is found reluctant to form hyper-stoichiometric PuO2+x, with oxygen interstitials present only in very low concentrations irrespective of conditions. Hypo-stoichiometric PuO2−x is predicted, in agreement with the PuO2 phase diagram,78 and is accommodated by both the and V2+O defects at small values of x, with
  increasingly dominant with increasing x. The little hyper-stoichiometry is accommodated by the O2−i defect. Aside from increasing the temperature at which perfect stoichiometry occurs, inclusion of vibrational entropy into the defect formation energy calculation was not found to alter which defects accommodate non-stoichiometry in PuO2±x, as observed in UO2.36,37
Conflicts of interest
There are no conflicts to declare.Appendix
See Fig. 8.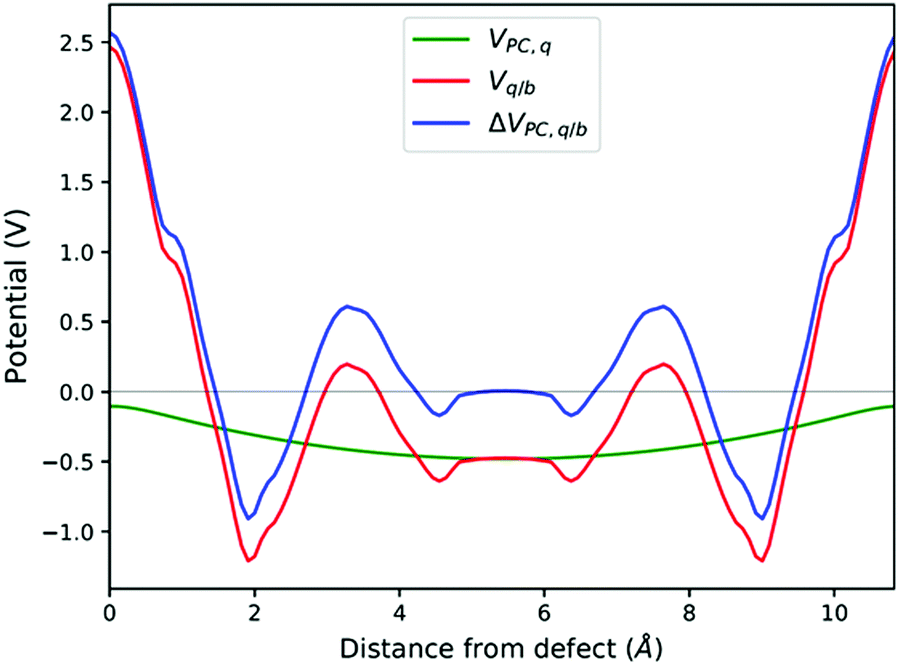 | ||
| Fig. 8 Planar averaged Vq/b, VPC,q and ΔVPC,q/b calculated at the atomic positions of a PuO2 supercell with a VPu4−defect. | ||
Acknowledgements
We thank D. O. Scanlon and M. Pacey for their valuable help. This work made use of the High End Computing facility at Lancaster University. The visualisation of crystal structures was performed with VESTA,79 finite-size corrections were calculated using pymatgen.80 This project was funded as part of EPSRCs TRANSCEND project (EP/S01019X/1).References
- J. M. Haschke and J. L. Stakebake, Handling, Storage, and Disposition of Plutonium and Uranium, in The Chemistry of the Actinide and Transactinide Elements, ed. L. R.Morss, N. M. Edelstein and J. Fuger, Springer, Dordrecht, 3rd edn, 2010, vol. 5, ch. 29, pp. 3199–3272. Search PubMed.
- R. C. O’Brien, R. M. Ambrosi, N. P. Bannister, S. D. Howe and H. V. Atkinson, J. Nucl. Mater., 2008, 377, 506–521 CrossRef.
- G. Bailey, E. Bluhm, J. Lyman, R. Mason, M. Paffet, G. Polansky, G. D. Roberson, M. Sherman, K. Veirs and L. Worl, Gas Generation from Actinide Oxide Materials, LA-13781-MS, Los Alamos National Laboratory, Los Alamos, NM, 2000.
- J. M. Haschke, T. H. Allen and L. A. Morales, Science, 2000, 287, 285–287 CrossRef CAS.
- J. M. Haschke and T. H. Allen, J. Alloys Compd., 2002, 336, 124–131 CrossRef CAS.
- J. M. Haschke, T. H. Allen and L. A. Morales, J. Alloys Compd., 2001, 314, 78–91 CrossRef CAS.
- J. D. Farr, R. K. Schulze and M. P. Neu, J. Nucl. Mater., 2004, 328, 124–136 CrossRef CAS.
- S. T. Conradson, B. D. Begg, D. L. Clark, C. den Auwer, M. Ding, P. K. Dorhout, F. J. Espinosa-Faller, P. L. Gordan, R. G. Haire, N. J. Hess, R. F. Hess, D. Webster Keogh, L. A. Morales, M. P. Neu, P. Paviet-Hartmann, W. Runde, C. Drew Tait, D. Kirk Veirs and P. M. Villella, J. Am. Chem. Soc., 2004, 126, 13443–13458 CrossRef CAS.
- Los Alamos Science, ed. N. G. Cooper, Los Alamos National Laboratory, Los Alamos, NM, 2000, vol. 26 Search PubMed.
- X.-D. Wen, R. L. Martin, T. M. Henderson and G. E. Scuseria, Chem. Rev., 2013, 113, 1063–1096 CrossRef CAS.
- J. T. Pegg, X. Aparicio-Anglès, M. Storr and N. H. de Leeuw, J. Nucl. Mater., 2017, 492, 269–278 CrossRef CAS.
- S. L. Dudarev, G. A. Botton, S. Y. Savrasov, C. J. Humphreys and A. P. Sutton, Phys. Rev. B: Condens. Matter Mater. Phys., 1998, 57, 1505 CrossRef CAS.
- P. S. Ghosh and A. Arya, Phys. Chem. Chem. Phys., 2019, 21, 16818–16829 RSC.
- J. T. Pegg, A. E. Shields, M. T. Storr, A. S. Wills, D. O. Scanlon and N. H. de Leeuw, Phys. Chem. Chem. Phys., 2018, 20, 20943–20951 RSC.
- H. Nakamura, M. Machida and M. Kato, Prog. Nucl. Sci. Technol, 2011, 2, 16–19 CrossRef.
- P. Zhang, B.-T. Wang and X.-G. Zhao, Phys. Rev. B: Condens. Matter Mater. Phys., 2010, 82, 144110 CrossRef.
- B. Sun, P. Zhang and X.-G. Zhao, J. Chem. Phys., 2008, 128, 084705 CrossRef.
- C. E. McNeilly, J. Nucl. Mater., 1964, 11, 53–58 CrossRef CAS.
- T. M. McCleskey, E. Bauer, Q. Jia, A. K. Burrell, B. L. Scott, S. D. Conradson, A. Mueller, L. Roy, X. Wen, G. E. Scuseria and R. L. Martin, J. Appl. Phys., 2013, 113, 013515 CrossRef.
- A. J. Garza and G. E. Scuseria, J. Phys. Chem. Lett., 2016, 7, 4165–4170 CrossRef CAS.
- I. D. Prodan and G. E. Scuseria, J. Chem. Phys., 2005, 123, 014703 CrossRef.
- Y. Tokunaga, H. Sakai, T. Fujimoto, S. Kambe, R. E. Walstedt, K. Ikushima, H. Yasuoka, D. Aoki, Y. Homma, Y. Haga, T. D. Matsuda, S. Ikeda, E. Yamamoto, A. Nakamura, Y. Shiokawa, K. Nakajima, Y. Arai and Y. Ōnuki, J. Alloys Compd., 2007, 444-445, 241–245 CrossRef CAS.
- D. Gryaznov, E. Heifets and D. Sedmidubsky, Phys. Chem. Chem. Phys., 2010, 12, 12273–12278 RSC.
- Y. Lu, Y. Yang and P. Zhang, J. Alloys Compd., 2015, 649, 544–552 CrossRef CAS.
- G. Jomard, B. Amadon, F. Bottin and M. Torrent, Phys. Rev. B: Condens. Matter Mater. Phys., 2008, 78, 075125 CrossRef.
- S. C. Hernandez and E. F. Holby, J. Phys. Chem. C, 2016, 120, 13095–13102 CrossRef CAS.
- D. L. Clark, S. S. Hecker, G. D. Jarvinen and M. P. Neu, Plutonium, in The Chemistry of the Actinide and Transactinide Elements, ed. L. R. Morss, N. M. Edelstein and J. Fuger, Springer, Dordrecht, 3rd edn, 2008, vol. 2, ch. 7, pp. 813–1264 Search PubMed.
- L.-F. Wang, B. Sun, H.-F. Liu, D.-Y. Lin and H.-F. Song, J. Nucl. Mater., 2019, 526, 151762 CrossRef CAS.
- M. S. D. Read, S. R. Walker and R. A. Jackson, J. Nucl. Mater., 2014, 448, 20–25 CrossRef CAS.
- H. Nakamura and M. Machida, Prog. Nucl. Sci. Technol, 2018, 5, 132–135 CrossRef.
- X. Tian, T. Gao, C. Lu, J. Shang and H. Xiao, Eur. Phys. J. B, 2013, 86, 179 CrossRef.
- P. Tiwary, A. van de Walle, B. Jeon and N. Grønbech-Jensen, Phys. Rev. B: Condens. Matter Mater. Phys., 2011, 83, 094104 CrossRef.
- M. W. D. Cooper, M. J. D. Rushton and R. W. Grimes, J. Phys.: Condens. Matter, 2014, 26, 105401 CrossRef CAS.
- M. Stan and P. Cristea, Defects and oxygen diffusion in PuO2−x, J. Nucl. Mater., 2005, 344, 213–218 CrossRef CAS.
- M. Kato, H. Nakamura, M. Watanabe, T. Matsumoto and M. Machida, Defect Diffus. Forum, 2017, 375, 57–70 Search PubMed.
- M. W. D. Cooper, S. T. Murthy and D. A. Andersson, J. Nucl. Mater., 2018, 504, 251–260 CrossRef CAS.
- A. Soulie, F. Bruneval, M. Marinica, S. T. Murphy and J. Crocombette, Phy. Rev. Mater., 2018, 2, 083607 CrossRef CAS.
- G. Kresse and J. Hafner, Phys. Rev. B: Condens. Matter Mater. Phys., 1993, 47, 558 CrossRef CAS.
- G. Kresse and J. Hafner, Phys. Rev. B: Condens. Matter Mater. Phys., 1994, 49, 14251 CrossRef CAS.
- G. Kresse and J. Furthmüller, Comput. Mater. Sci, 1996, 6, 15 CrossRef CAS.
- G. Kresse and J. Furthmüller, Phys. Rev. B: Condens. Matter Mater. Phys., 1996, 54, 11169 CrossRef CAS.
- P. E. Blochl, Phys. Rev. B: Condens. Matter Mater. Phys., 1994, 50, 17953 CrossRef.
- G. Kresse and D. Joubert, Phys. Rev. B: Condens. Matter Mater. Phys., 1999, 59, 1758 CrossRef CAS.
- H. J. Monkhurst and J. D. Pack, Phys. Rev. B: Solid State, 1976, 49, 16223 Search PubMed.
- S. Steiner, S. Khmelevskyi, M. Marsmann and G. Kresse, Phys. Rev. B, 2016, 93, 224425 CrossRef.
- J. Heyd, G. E. Scuseria and M. Ernzerhof, J. Chem. Phys., 2003, 118, 8207 CrossRef CAS.
- J. Heyd and G. E. Scuseria, J. Chem. Phys., 2004, 121, 1187 CrossRef CAS.
- J. Heyd Scuseria and G. E. Scuseria, J. Chem. Phys., 2006, 124, 219906 CrossRef.
- A. V. Krukau, O. A. Vydrov, A. F. Izmaylov and G. E. Scuseria, J. Chem. Phys., 2006, 125, 224106 CrossRef.
- J. P. Perdew, A. Ruzsinszky, G. I. Csonka, O. A. Vydrov, G. E. Scuseria, L. A. Constantin, X. Zhou and K. Burke, Phys. Rev. Lett., 2009, 100, 136406 CrossRef.
- G. I. Csonka, J. P. Perdew, A. Ruzsinszky, P. H. T. Philipsen, S. Lebègue, J. Paier, O. A. Vydrov and J. G. Ángyán, Phys. Rev. B: Condens. Matter Mater. Phys., 2009, 79, 155107 CrossRef.
- A. I. Liechtenstein, V. I. Anisimov and J. Zaanen, Phys. Rev. B: Condens. Matter Mater. Phys., 1995, 52, R5467(R) CrossRef.
- A. Shick, J. Kolorenc, L. Havela, T. Gouder and R. Caciuffo, Phys. Rev. B: Condens. Matter Mater. Phys., 2014, 89, 041109 CrossRef.
- F. A. Kröger and H. J. Vink, Solid State Phys., 1956, 3, 307–435 Search PubMed.
- T. Durrant, S. Murphy, M. B. Watkins and A. L. Shluger, J. Chem. Phys., 2018, 149, 024103 CrossRef CAS.
- M. Leslie and N. J. Gillan, J. Phys. C: Solid State Phys., 1985, 18, 973 CrossRef CAS.
- S. Baroni and R. Resta, Phys. Rev. B: Condens. Matter Mater. Phys., 1986, 33, 7017 CrossRef CAS.
- M. Gajdoš, K. Hummer, G. Kresse, J. Furthmüller and F. Bechstedt, Phys. Rev. B: Condens. Matter Mater. Phys., 2006, 73, 045112 CrossRef.
- L. Manes and A. Barisic, Phys. Status Solidi, 1970, 3, 971 CrossRef CAS.
- N. Hampton, G. Saunders, J. Harding and A. Stoneham, J. Nucl. Mater., 1987, 149, 18–20 CrossRef CAS.
- M. S. Talla Noutack, G. Geneste, G. Jomard and M. Freyss, Phys. Rev. Mater., 2019, 3, 035001 CrossRef CAS.
- G. Makov and M. C. Payne, Phys. Rev. B: Condens. Matter Mater. Phys., 1995, 51, 4014 CrossRef CAS.
- C. Freysoldt, J. Neugebauer and C. G. Van, de Walle, Phys. Rev. Lett., 2009, 102, 016402 CrossRef.
- Y. Kumagai and F. Oba, Phys. Rev. B: Condens. Matter Mater. Phys., 2014, 89, 195205 CrossRef.
- H.-P. Komsa, T. T. Rantala and A. Pasquarello, Phys. Rev. B: Condens. Matter Mater. Phys., 2012, 86, 045112 CrossRef.
- J. D. Gale, J. Chem. Soc., Faraday Trans., 1997, 93, 629–637 RSC.
- M. W. D. Cooper, S. T. Murphy, M. J. D. Rushton and R. W. Grimes, J. Nucl. Mater., 2015, 461, 206–214 CrossRef CAS.
- M. Manley, J. Jeffries, A. Said, C. A. Marianetti, H. Cynn, B. M. Leu and M. A. Wall, Phys. Rev. B: Condens. Matter Mater. Phys., 2012, 85, 132301 CrossRef.
- Y. Mishin, M. R. Sørensen and A. F. Voter, Philos. Mag. A, 2001, 81, 2591–2612 CAS.
- D. A. Andersson, P. Garcia, X.-Y. Liu, G. Pastore, M. Tonks, P. Millett, B. Dorado, D. Gaston, D. Andrs, R. L. Williamson, R. C. Martineau, B. P. Uberuaga and C. R. Stanek, J. Nucl. Mater., 2014, 451, 225–242 CrossRef CAS.
- P. Söderlind, A. Landa and B. Sadigh, Adv. Phys., 2019, 68, 1–47 CrossRef.
- M. W. Finnis, A. Y. Lozovoi and A. Alavi, Annu. Rev. Mater. Res., 2005, 35, 167–207 CrossRef CAS.
- G. K. Johnson, E. H. Deventer, O. L. Kruger and W. N. Hubbard, J. Chem. Thermodyn., 1969, 1, 89–98 CrossRef CAS.
- K. Johnston, M. R. Castell, A. T. Paxton and M. W. Finnis, Phys. Rev. B: Condens. Matter Mater. Phys., 2004, 70, 085415 CrossRef.
- M. Youseff and B. Yildiz, Phys. Rev. B: Condens. Matter Mater. Phys., 2012, 86, 144109 CrossRef.
- S. T. Murphy and N. D. M. Hine, Chem. Mater., 2014, 26, 1629–1638 CrossRef CAS.
- G. E. Murch, C. Richard and A. Catlow, J. Chem. Soc., Faraday Trans. 2, 1987, 83, 1157–1169 RSC.
- C. Guéneau, C. Chatillon and B. Sundman, J. Nucl. Mater., 2008, 378, 257–272 CrossRef.
- K. Momma and F. Izumi, J. Appl. Crystallogr., 2011, 44, 1272–1276 CrossRef CAS.
- S. Ong, W. Richards, A. Jain, G. Hautier, M. Kocher, S. Cholia, D. Gunter, V. Chevrier, K. Persson and G. Ceder, Comput. Mater. Sci., 2013, 68, 314–319 CrossRef CAS.
| This journal is © the Owner Societies 2021 |