
 Open Access Article
 This Open Access Article is licensed under a
 Creative Commons Attribution 3.0 Unported Licence
Elucidation of copper environment in a Cu–Cr–Fe oxide catalyst through in situ high-resolution XANES investigation†
Tahmin
Lais
a,
Liliana
Lukashuk
b,
Leon
van de Water
b,
Timothy I.
Hyde
 c,
Matteo
Aramini
d and
Gopinathan
Sankar
*a
c,
Matteo
Aramini
d and
Gopinathan
Sankar
*a
aDepartment of Chemistry, University College London, 20 Gordon Street, London WC1H 0AJ, UK. E-mail: g.sankar@ucl.ac.uk
bJohnson Matthey, PO Box 1, Belasis Avenue, Billingham, Cleveland TS23 1LB, UK
cJohnson Matthey, Blounts Court, Sonning Common, Reading, RG4 9NH, UK
dDiamond Light Source, Harwell Science & Innovation Campus, Oxfordshire OX11 0DE, UK
First published on 19th February 2021
Abstract
Copper containing materials are widely used in a range of catalytic applications. Here, we report the use of Cu K-edge high resolution XANES to determine the local site symmetry of copper ions during the thermal treatment of a Cu–Cr–Fe oxide catalyst. We exploited the Cu K-edge XANES spectral features, in particular the correlation between area under the pre-edge peak and its position to determine the local environment of Cu2+ ions. The information gained from this investigation rules out the presence of Cu2+ ions in a tetrahedral or square planar geometry, a mixture of these sites, or in a reduced oxidation state. Evidence is presented that the Cu2+ ions in the Cu–Cr–Fe oxide system are present in a distorted octahedral environment.
1. Introduction
Copper-based catalysts are an important class of materials widely investigated as they are found to be effective in numerous applications.1–3 For example, NOx removal (Cu–zeolite catalysts),4–6 methanol synthesis7–9 and low-temperature water–gas shift (LTWGS) (Cu/ZnO/Al2O3),10–13 hydrogenation processes (e.g., copper chromite)14,15 and high temperature water gas shift (HTWGS)16–19 all feature catalysts with copper in the active phase. Iron–chromium based HTWGS catalysts have been known for several decades. The promotional effect of the addition of copper to these catalysts was discovered in the 1980s, and doping levels as low as 1% have been reported to result in significantly enhanced activity.20–22 Many studies have been devoted to understanding the copper promotion effect under reduction and HTWGS reaction conditions. It has been established that metallic copper is the main copper species present under these conditions.17,19,22–27 The nature of the copper promoter during catalyst preparation and during activation (reduction) is dependent on factors such as copper loading, preparation method,28 applied thermal treatments and reduction procedures, and these factors are critical in determining the final catalyst performance. However, determination of the site symmetry and oxidation state of the copper promoter prior to the reaction, in particular during all stages of catalyst preparation and activation, is important in the optimisation process of copper-promoted Fe–Cr based HTWGS catalysts. The local geometry of copper in the as-prepared Fe–Cr–Cu catalyst was proposed to be either in an octahedral (CuFe2O4, inverse spinel structure) or tetrahedral (CuCr2O4) or CuO environment.17,23 However, the majority of characterisation techniques employed thus far fail to resolve the exact Cu environment in the catalyst prior to catalytic reaction and the question around the exact state of copper at this stage is still under debate.One of the main reasons that it has been difficult to determine the nature of Cu2+ ions in the catalyst is the complexity of the structural and redox chemistry associated with this.29–31 Copper ions are known to adopt square planar, tetrahedral, octahedral or pyramidal coordination geometries and many of these have distortions to various degree. While traditional characterisation methods, specifically XRD, play an important role in elucidating the structure, they are useful only when the copper ion concentration is significantly high. A range of other advanced characterisation methods have also been used to determine the local structure around copper ions, for example, to understand the activity and reactivity during catalysis which includes Density Functional Theory (DFT) based computational methods32 and photon-in-photon-out X-ray spectroscopic methods,22,26,33–36 to name a few. The Extended X-ray Absorption Fine Structure (EXAFS) part of the X-ray Absorption (XAS) spectrum, an element specific technique, has been widely used to determine the local coordination geometry of Cu2+ ions in a variety of systems.37–40 Whilst this technique is demonstrated to be powerful in determining a coordination number and interatomic distances around copper, it is difficult to determine the local site symmetry from this method. For example, both tetrahedral and square planar configurations will have coordination number of four for the first neighbour with subtle differences in interatomic distances; similarly, distorted octahedra, depending on the nature of distortion, may fail to reveal the longer Cu–O neighbours.
It is well-known that the X-ray absorption near edge structure (XANES) part of the XAS data is sensitive to the local site symmetry,41,42 and this has been exploited to elucidate structures of numerous transition metal-containing catalysts, including copper.43–48 Furthermore, the advent of high-resolution fluorescence detection methods with superior resolution in XANES (HR-XANES) has stimulated the use of this technique to study a range of metal ion-containing catalysts, inorganic complexes and biological systems with the aim to determine precisely the electronic and local site symmetry of active sites.36,49–54
Encouraged by local-structural diversities seen in a range of oxide-based compounds, and in light of debate over the nature of the coordination environment around Cu2+ ions in the pre-catalytic state, we set out to determine the local structure of copper ions in a Cu–Cr–Fe oxide material.55 We utilised the HR-XANES method at the Cu K-edge36,56 during thermal treatment in air, which is an important step commonly applied in the preparation process of catalytic materials.
To allow for a correct interpretation of the changes in local site symmetry of copper ions, a set of reference compounds were also investigated. In addition, we carried out XANES spectral simulation using FDMNES software57 on structures of Cu2+ ions in an Fe2O3 matrix relaxed with DFT and simulated with molecular dynamics (MD), and compared them with XANES spectra of our materials to determine the local environment.
2. Experimental
2.1. Catalyst preparation
The Cu–Cr–Fe material, investigated in this study, was prepared by established procedure through precipitation of iron, chromium and copper nitrates (90Fe![[thin space (1/6-em)]](https://www.rsc.org/images/entities/char_2009.gif) :8Cr:2Cu atomic ratios) with sodium carbonate, followed by washing and drying.55
:8Cr:2Cu atomic ratios) with sodium carbonate, followed by washing and drying.55
2.2. Catalyst characterization
High resolution X-ray absorption spectroscopy was measured at diamond light source (DLS) on beamline I20-scanning to obtain HR-XANES with a typical energy resolution of ±0.1 eV.58 Cu K-edge XAS data were collected in fluorescence mode. For the experiment, ∼65 mg of the as prepared Cu–Cr–Fe material was pressed into 13 mm pellets and placed in the sample holder of the in situ Microtomo cell.59 Before starting in situ XAS experiments, the cell with the catalyst was purged in N2 (30–60 mL min−1 for 15–20 min). The thermal treatment was carried out in synthetic air (20.9% O2 in N2 at 30 mL min−1 flow rate) from RT to 773 K at a 10 K min−1 heating rate. All gas flows in the Microtomo cell59 were monitored using a Cirrus mass spectrometer. Data was collected at 100 K intervals, under isothermal conditions. References compounds, Cu(OH)2, CuFe2O4, CuO, CuCr2O4 were recorded ex situ to aid analysis. Energy calibration was done with respect to copper metal foil. Athena® (for pre-edge and post-edge background subtraction) and Artemis® (for extracting coordination number, Cu–O interatomic distances and Debye–Waller factor using SO2 of 0.817 derived from CuO as reference compound) programmes of the IFEFFIT software package were used for data processing and analysis.60 Features of the pre-edge such as the area and its position were extracted from the normalized Cu K-edge XANES spectra using ORIGIN software. Curve fitting was typically achieved with a Gaussian component. Two fitting ranges were used: 8975.8–8978.8 eV for the as-prepared material and 8974.9–8979.1 eV for the copper references and the linear simulated mixes. A typical fit is given (see Fig. S1 in the ESI†).X-ray diffraction (XRD) data were collected using a Bruker D8 Advance powder diffractometer. The instrument used a Bragg–Brentano (Reflection) mode employing a copper X-ray tube (Cu Kα Wavelength 1.5406 Å). Diffraction patterns were recorded in the 10–130° 2θ range with a 0.04° 2θ step size and 4 seconds per step. Phase identification was carried out using the Bruker Eva v4.2.1 software and the ICDD PDF4+ structure database.
XPS was measured on a Thermo Scientific K-alpha spectrometer with monochromatic Al Kα radiation, a dual beam charge compensation system and constant pass energy of 50 eV (spot size 400 μm). A survey scan was collected in the binding energy range 0–1200 eV. The principal peaks of Cu 2p were corrected against C 1s (284.8 eV) to determine the binding energies which were then compared with literature.
Raman spectroscopy was performed using a Renishaw spectrometer. A ×50 microscope objective lens was employed to focus on the samples. The spectra were collected at RT using a 785 nm laser. Raman spectra were acquired with 30 repeat scans and acquisition time set to 10 s per scan. The range for the collected spectrum was 100–1200 cm−1.
2.3. Computational modelling
The density functional theory (DFT) calculations presented in this work were performed using the plane-wave DFT method available within the code CASTEP.61 Generalised-gradient approximation for the exchange–correlation energy, was selected in the form of the PBE functional.62 Ground state DFT was expanded by expressing the exchange–correlation potential in terms of local-density band theory via the PBE+U method.63 An effective U value of 5 eV was included in such calculations, as reported in the Materials project database for Fe2O3.64The copper ions in hematite were modelled with the inclusion of a substitutional Cu defect in a 2 × 2 × 2 supercell of Fe2O3. The structure was relaxed with converged parameters of 700 eV for the kinetic energy cut-off and of a (12 × 12 × 12) Monkhorst–Pack k-point grid. Self-consistent cycles were performed to a convergence value of 1 × 10⁻⁷ eV. The relaxed structure was used as a starting configuration for molecular dynamics within NVT ensemble at the constant temperatures of 300 K, 773 K and 1000 K. Structures were allowed to thermalize for 25 fs and then allowed to evolve for further 100 fs, after which, a window of 10 fs was considered and the structure minimising the forces in such time-frame was selected as representative for the material at the temperature of simulation.
The obtained relaxed structures were used (with copper as the central atom) for FDMNES calculations using the freely available software. SCF and Green functions within this software were used for this purpose and 6 Å radius cut off was employed along with the default convolution parameters.
3. Results and discussion
The Cu–Cr–Fe mixed metal oxide that underwent thermal treatment in air at 773 K was examined by XRD (see Fig. 1(a)).65 It is clear that the main crystalline phase present in the system is primarily Fe2O3 and no other phases could be identified based on XRD studies.65 Similar results were observed from Raman analysis (Fig. S2, ESI†) where Fe2O3 was mainly detected and an additional Fe–Cr oxide phase at 773 K could be inferred, however, no clear structural information regarding the copper species can be deduced from the Raman spectrum. The XPS study (see Fig. 1(b)) of the sample calcined at 773 K suggested the presence of Cu2+ state which was also confirmed by the appearance of a satellite peak at 941–943 eV along with the broad 2p3/2 peak and its components between 934–935 eV. Whilst XPS (see Fig. 1(b)) revealed that the copper ions are present as 2+, no evidence can be obtained whether it is CuO or any other forms of copper ions in the system. Furthermore, XPS is sensitive to only the surface species and what is present beneath the surface is difficult to determine. Therefore, to obtain more detailed information on the nature of copper ions it is necessary to use the XAS technique as it is element specific and does not depend on long-range order of the overall structure or its concentration more importantly this technique is sensitive to local site symmetry of copper ions.66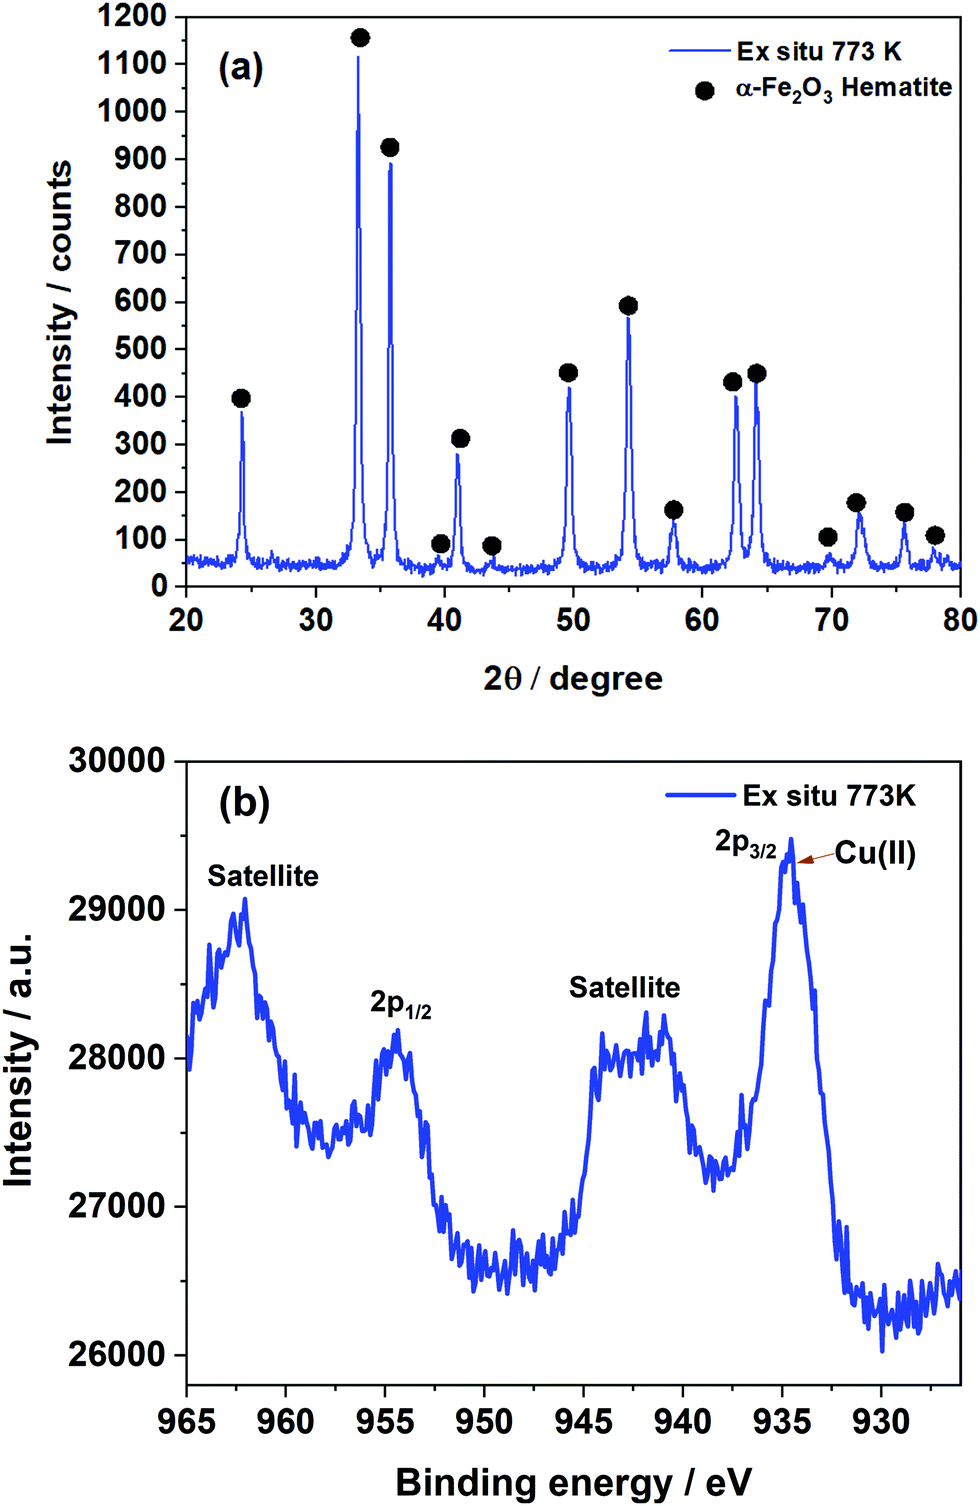 | ||
| Fig. 1 (a) XRD pattern of the Cu–Cr–Fe oxide thermally treated at 773 K. (b) Cu 2p XPS spectra of the same sample. | ||
Fig. 2(a) shows Cu K-edge HR-XANES of a set of Cu2+ reference compounds which clearly demonstrate the differences in all aspects related to the pre-edge, edge and post-edge features of these selected compounds. It is known from the crystallographic data of these systems that they all have different local coordination environment ranging from square planar to tetrahedral and octahedral symmetries. This also demonstrates that the HR-XANES technique is able to resolve all these complex differences in the spectra which appears to be related to different local geometries present in the system. We compare the normalised Cu K-edge HR-XANES data of a Cu–Cr–Fe oxide material23 of an ex situ sample thermally heated at 773 K with the data recorded in situ at a range of air calcination temperatures in Fig. 2(b). There are three regions of interest in a typical XANES spectrum: (1) the pre-edge which is due to the 1s to 3d transition (marked as P in Fig. 2(b)) and has been noted to be sensitive to the local coordination geometry,66 (2) the edge position through the midway of the rising absorption edge which is known to be sensitive to the oxidation state of the metal ions of interest44 and (3) the so-called “white-line” intensity at the top of the edge (marked as WL in Fig. 2(b)),39,67,68 which is known to show differences depending on the nature of the local coordination geometry.
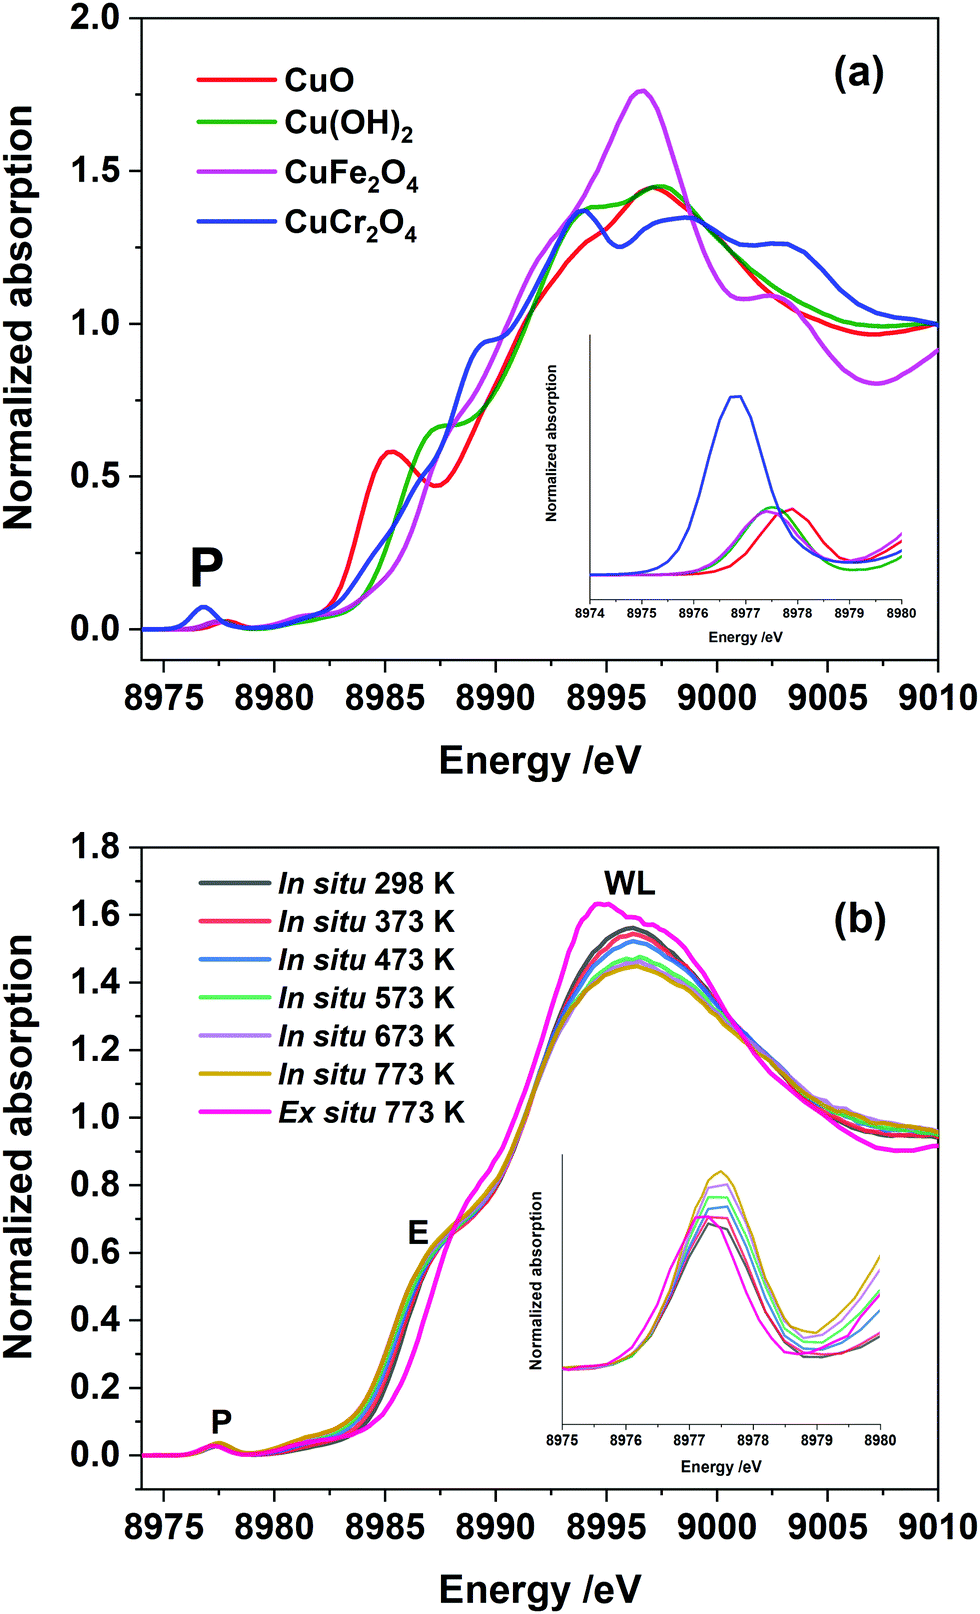 | ||
| Fig. 2 (a) The Cu K-edge HR-XANES spectra of selected reference compounds, representing Cu2+ in tetrahedral, square-planar and octahedral coordination geometries. (b) The Cu K-edge HR-XANES spectra of the Cu–Cr–Fe sample, calcined at various temperatures, in situ, in a flowing air atmosphere. Pre-edge peak is marked as P, E for the edge and WL for the white line on the top of the peak. In the inset in (a and b), we highlight the pre-edge region (marked P) to show variation in the intensity and position of the peak. | ||
First, we discuss the shift in the absorption edge of the systems followed by the analysis of the pre-edge peak area and the white line intensity differences in the top of the edge of the spectrum. We also show the results from the analysis of the EXAFS data, which is less conclusive in determining local symmetry of copper ions.
From the HR-XANES measurements of the Cu–Cr–Fe mixed oxide system (Fig. 2(b) and 3(a)), a slight decrease in edge position upon in situ heating above 473 K from ca. 8986.5 to 8986.1 eV is determined. To emphasise the need for in situ, a comparison of an ex situ sample treated at 773 K (1 h in air) and exposed to atmosphere is shown, which indicates a slight increase in edge position from ca. 8986.5 to 8987.2 eV (Fig. 3(a)). A shift in the edge position within a specific oxidation state of series reference compounds is well-known. For example, CuO shows an enhanced shift to a lower energy of ca. 2.5 eV with respect to the inverse spinel, Fe(Cu,Fe)O4 system, in its absorption edge38,39 (see Fig. 2(a), 3(a) and Table S1 in ESI†) and also CuO shows a distinct shoulder in the rising absorption edge, which was rationalised as due to a square planar geometry and bonding effects.38 The Cu–Cr–Fe oxide material studied here, did not show an enhanced shoulder (either in in situ or ex situ studies) as seen for CuO; thus, we can rule out the formation of any bulk CuO or any square planar coordination geometry, as noted by Gaur et al.38 in copper-containing complexes. To highlight the nature of the edge shift, we plot the “difference-XANES” with respect to the as-prepared starting material in Fig. S3 (ESI†). The plot also highlights the changes in the pre-edge peak with respect to as-prepared material. We plot the edge position of various copper-containing systems studied here in Fig. 3(a), along with the materials that underwent thermal treatments. The Cu2+-containing reference compounds show variation of 2.6 eV in the edge position between 8984.4 to 8987 eV.
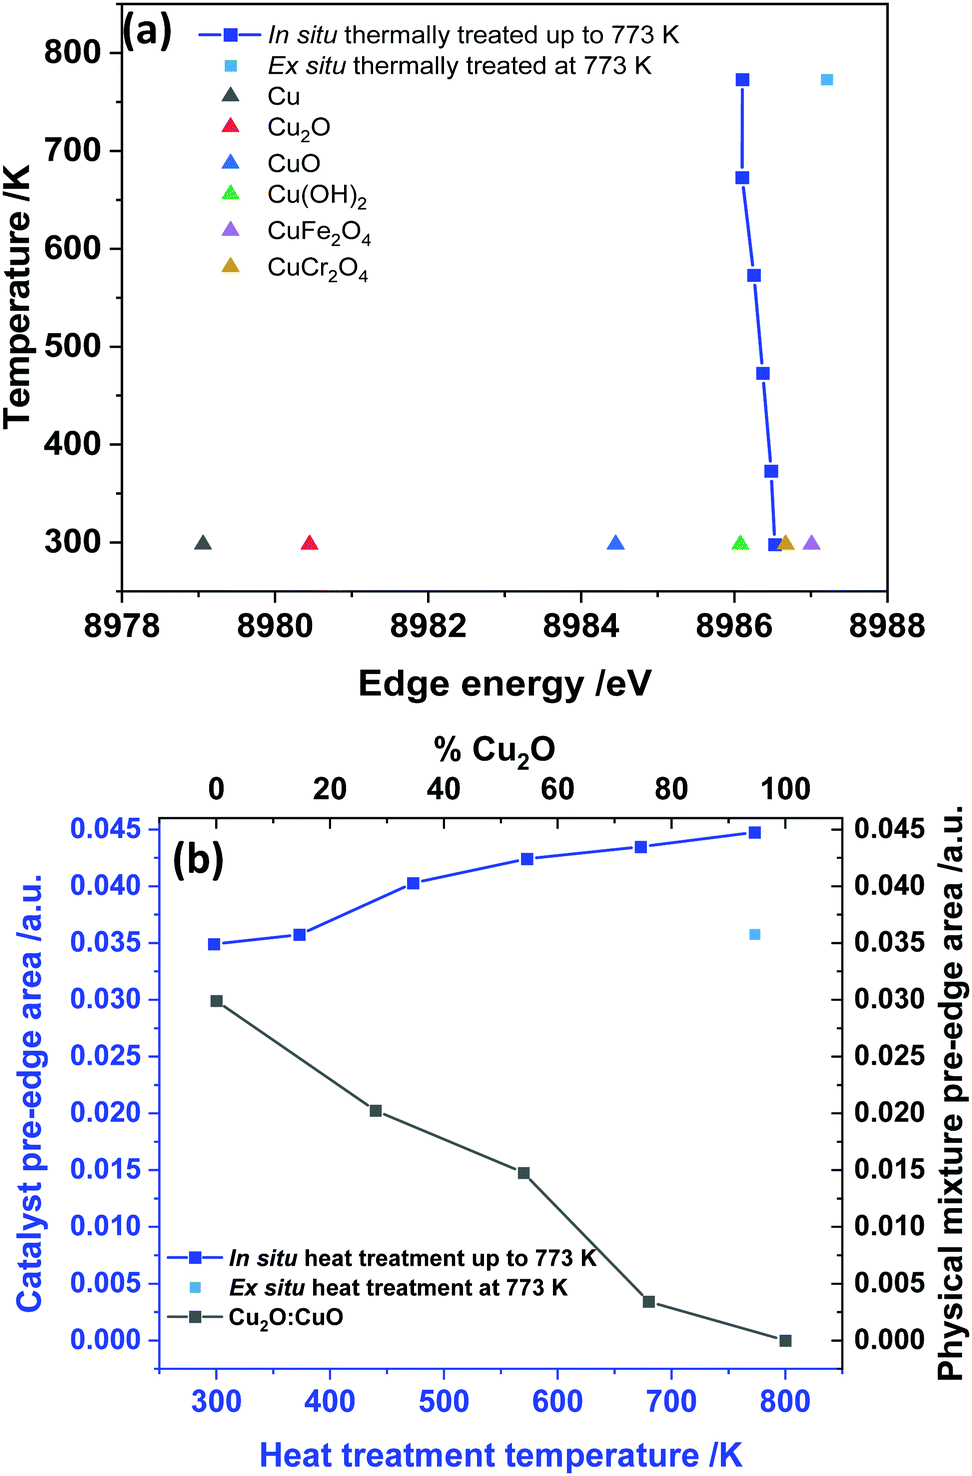 | ||
| Fig. 3 (a) Comparison of the edge position with reference compounds and the Cu–Cr–Fe systems heated from RT to 773 K; (b) change in the pre-edge peak area for the thermally treated samples and for comparison the pre-edge area of physical mixture of CuO and Cu2O are also given. Note that the temperature indicated in y-axis of (a) and x-axis (bottom) of (b) are the actual temperature at which the data were recorded in the case of in situ measurements and for ex situ samples, these were the temperatures at which the samples underwent thermal treatments, but the data were recorded at room temperature. The average estimated error in the area under the peak is ca. 3%. | ||
We also note that CuCr2O4 (normal spinel structure), wherein Cu2+ ions are in tetrahedral geometry, shows a ca. 0.3 eV shift of feature E to a lower value compared with Fe(Cu,Fe)O4 (inverse spinel), wherein Cu2+ are in an octahedral coordination69 (see Fig. 3(a) and 2(a)). All the edge positions of the Cu–Cr–Fe materials calcined at various temperatures indeed show small variations (+0.7 to −0.4 eV with respect to as prepared material) but lie well within the range expected of Cu2+ ions. Further support for the presence of the Cu2+ oxidation state comes from investigating the pre-edge intensity, as one should see a decrease in the pre-edge intensity, in addition to the edge shift to a lower value compared to the starting material, when Cu1+ is present in the material.
Van Bokhoven et al.36 observed a clear decrease in the pre-edge peak intensity as well as a shift in the edge position to a lower value for Cu-MOR catalysts during calcination followed by the methane oxidation catalytic process. Here we demonstrate the effect of presence of reduced copper species in the XANES spectra through the investigation of physical mixtures of CuO and Cu2O, shown in Fig. S4 (ESI†), and the pre-edge peak area vs. the position of these ratios in Fig. 3(b) for various Cu2+/Cu1+ ratios. The pre-edge peak area decreases with an increase in the Cu1+ content, whereas the pre-edge peak area, in the data of our materials (see Fig. 3(b)), shows a clear increase with thermal treatment in air, especially for the samples studied in situ. Therefore, we can discount the small edge shift seen in in situ studies as due to partial reduction of Cu2+ ions.
An attempt was made to extract the Cu–O coordination number of the Cu–Cr–Fe oxides and their interatomic distances by analysing the EXAFS data (using ARTEMIS® software over a k-range of 2.7 and 10 Å−1). The results for the investigated Cu–Cr–Fe oxides together with the reference compounds are shown in Table 1. Almost all the samples, including most of the reference compounds, showed an average coordination number of 4 with Cu–O distances in the range of ca. 1.94 ± 0.04 Å (see Table 1). For example, both CuCr2O4 and CuO showed a coordination number of ca. 4, which is expected for a tetrahedral and square planar configuration, respectively, and EXAFS failed to distinguish the site symmetry. Similarly a restrained refinement is necessary to get the best fit between experimental and calculated EXAFS for the Fe(Cu,Fe)O4 system, where 4 short and two long Cu–O distances of ca. 1.97 and 2.22 Å, respectively, are noted to exist.70 Although the analysis of Cu(OH)2 suggests that it is 4 coordinated, the crystallographic report71 indicates that they are slightly distorted four Cu–O short distance and two long Cu–O distances between 2.35 and 2.91 Å due to the Jahn–Teller effect.
| System | CNa | Cu–O, R/Åa | Crystallographic Cu–O distance/Å |
σ
2/Å2a |
Fit indexa |
|---|---|---|---|---|---|
| CN – Average coordination number for the first neighbour; Cu–O, R is the average interatomic distance (Å) for the first neighbour and σ2/Å2 is the Debye–Waller factor for this atom pair (cumulant terms were not included in the analysis).a The values reported based on the EXAFS analysis from this work. All the data were analysed over the k-range of 2.7 and 10 Å−1 and over the R-range of 1 and 2.7 Å. Amplitude reduction factor, SO2 was fixed at 0.817 based on the analysis of CuO taking only the square planar, 4 oxygen neighbours in the same k and R ranges. Error in estimation of coordination number is ca. 15% and interatomic distances are ca. ±0.02 Å. Typical best fit to the Cu K-edge EXAFS and corresponding FT's are given in Fig. S5 in the ESI. | |||||
| CuO72 | 4 | 1.95 | 2 × 1.95 | 0.0065 | 0.062 |
| 2 × 1.96 | |||||
| 2 × 2.78 | |||||
| CuCr2O473 | 4 | 1.95 | 4 × 1.96 | 0.006 | 0.13 |
| Fe(Cu,Fe)O470 | 4 | 1.98 | 4 × 1.97 | 0.0076 | (0.41) |
| 2 | 2.25 | 2 × 2.22 | 0.0076 | ||
| Cu(OH)271 | 3.7 | 1.94 | 2 × 1.95 | 0.0069 | 0.033 |
| 2 × 1.97 | |||||
| 1 × 2.35 | |||||
| 1 × 2.91 | |||||
| Cu hydroxy carbonate | 3.6 | 1.93 | — | 0.0088 | 0.039 |
| As-prepared material | 4.1 | 1.97 | — | 0.0079 | 0.041 |
| Ex situ 773 K | 6.2 | 1.98 | — | 0.0137 | 0.116 |
| In situ at 373 K | 4.5 | 1.96 | 0.0103 | 0.037 | |
| In situ at 473 K | 4.7 | 1.96 | 0.0130 | 0.041 | |
| In situ at 573 K | 4.4 | 1.95 | 0.0115 | 0.032 | |
| In situ at 673 K | 4.8 | 1.95 | 0.0151 | 0.036 | |
| In situ at 773 K | 4.3 | 1.95 | 0.0131 | 0.052 | |
The analysis of the EXAFS data (only a limited k-range was available between 2.7 and 10 Å−1 from this data and was used for extracting only the average first neighbour local structure) indeed shows variations in the copper coordination number between 4 and 6 depending on the samples. Although the CN of 6 is obtained for the samples treated at 773 K for the ex situ sample, the fit index is not satisfactory, and inclusion of distorted octahedra did not yield satisfactory structural parameters due to high correlations. The analysis of the EXAFS data of in situ thermally treated samples showed an increase in Debye–Waller factor, as expected for an increase in temperature, and a small increase in coordination number (from 4.3 and 4.8) but the distances remained closely similar (see Table 1). Thus, the EXAFS analysis is insufficient to gain any detailed information on the local geometry of copper ions in various systems studied here.
In such a situation the use of XANES is more appropriate for the investigation of the site symmetry of Cu2+ ions. Evidence for the effect of change in the local coordination geometry (site symmetry) around copper ions on the pre-edge intensity can be clearly seen by comparing the HR-XANES of various Cu2+-containing reference compounds (see Fig. 2(a)). Here, a tetrahedrally coordinated copper-containing system (CuCr2O4, normal spinel) shows the highest intensity and lowest energy position of its pre-edge peak compared to octahedrally coordinated (CuFe2O4, inverse spinel); square planar coordinated CuO shows a low pre-edge peak intensity and highest in its peak energy position. Similar observations have been made in a previous study of copper ions with various ligands.36,66 Therefore, important information can be extracted by comparing the pre-edge peak area and its position for all the catalysts with respect to these reference compounds. The plot of pre-edge peak position versus peak area of four relevant reference compounds (Fig. 4) shows the nature of variation in the area under the pre-edge peak and position of the peak.
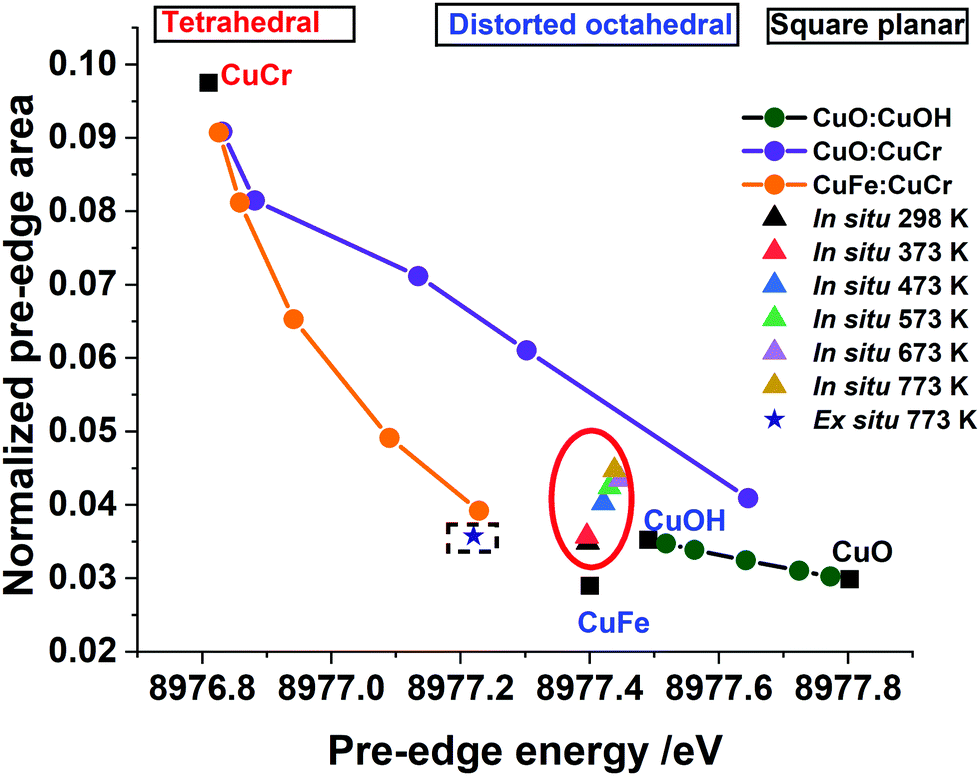 | ||
| Fig. 4 The pre-edge area against the pre-edge position for the ex situ sample thermally treated in air at 773 K (in dotted square) and in situ, recorded during thermal treatment in air of the Cu–Cr–Fe mixed oxide sample from RT to 773 K (red circle), compared with linear combinations of reference compounds with ratios of 0.1:0.9, 0.25:0.75, 0.5:0.5, 0.75:0.25, 0.9:0.1, of CuCr:CuFe (orange line), CuCr:CuO (purple line) and CuOH:CuO (dark green line). Here CuOH = Cu(OH)2, CuCr = CuCr2O4, and CuFe = CuFe2O4. Note that the peak area was obtained from the normalised HR-XANES data and the estimated error in the determination of the area under the peak is ca. 3%. | ||
A similar method of analysing the pre-edge peak position against intensity has been applied for a selected range of systems, notably for Ti(IV) and Fe based minerals by Farges et al.42,74 Sankar and co-workers75,76 exploited this method to examine titanium-containing porous materials; Weckhuysen and co-workers77 as well as Grunwaldt54 used high resolution XANES to investigate Fe-ZSM5 catalysts. In general, the trend seen for Cu2+-containing systems is very similar to the Ti- and Fe-containing materials where tetrahedrally coordinated ions showed higher pre-edge peak intensity compared to octahedrally coordinated Ti or Fe.41,42,74 At the same time, the energy position of the peak was lowest for the tetrahedral and highest for octahedrally coordinated systems. Fig. 4 illustrates that this is an ideal method to determine changes in local structure around active metal cations in copper-containing catalysts. In Fig. 4 we also show the observed change in the intensity of the pre-edge peak and its position for the Cu–Cr–Fe oxide both measured under in situ during thermal treatment and compared with the same material heated ex situ at 773 K. Selected linear combinations of the respective reference compounds are shown here to determine whether there are multiple copper 2+ sites (including mixed components) present in the oxide system. The samples measured in situ HR-XANES during the thermal treatments clearly reveal enhancement in the pre-edge peak area of ca. 0.01, while the peak position remains largely unchanged with a marginal shift in energy of within 0.03 eV. In the case of ex situ sample, a marginal variation (±0.001 with respect to the fresh material) in the pre-edge peak area and a slight shift (ca. 0.18 eV) in its peak position to a lower energy are observed in comparison to the as-prepared material. Comparison with the data (see Fig. 4) of reference compounds and the ones obtained through linear combinations of different Cu2+ symmetries indicates that the ex situ sample heated at ca. 773 K showed a decrease in its pre-edge peak position, almost coinciding with the linear combination of CuCr2O4 and Fe(Cu,Fe)O4 in ca. 10:90 ratio. We discount this possibility of a mixture of tetrahedral and octahedral sites as they differ considerably when comparing the white line features (see Fig. S6, ESI†) in which Cu2+ in tetrahedral and octahedral coordination differs significantly.
Spectral changes in other in situ thermally treated samples do not appear to follow any trend resulting from linear combination of the various possible coordination environments. Therefore, we propose the Cu2+ in the Cu–Cr–Fe-oxide are likely to be in a unique distorted octahedral environment, rather than a mixture of two phases or combination of possible sites (tetrahedral and octahedral) arising from relocation of Cu2+ species in two different environments in the material during the thermal treatment in air. In addition to the pre-edge peak and its energy position, it is also noted that the white line (WL) intensity can reveal changes in the local coordination environment of copper ions. We therefore carried out the evaluation of the white line (WL) intensity of the absorption spectrum.36,38 In Fig. 5(a), we plot the WL part of the XANES spectra for both the ex situ and in situ materials. The WL part of the XANES spectra of the in situ heat treated samples show a continuous decrease in the WL intensity with increasing temperature, whilst their positions are unchanged as a function of the temperature. The increase in WL intensity for ex situ 773 K sample and shift to a distorted octahedral environment is different from the in situ samples; we suggest that this distorted coordination environment may include adsorbed water molecules coordinated to copper ions as this material was exposed to the atmosphere. In general, the WL of all the Cu–Cr–Fe materials were in between those of Fe(CuFe)O4 and CuO (reference compounds are shown in Fig. 2(a)). To understand this behaviour, specifically the change in normalised white-line intensity, we undertook a series of XANES calculations using the FDMNES suite of software.57 As suggested by Puig-Molina et al., Grunwaldt et al., and Kappen et al.,17,25,78 the HTWGS catalysts may have Cu2+ ions interacting with the iron oxide host lattice.26
 | ||
| Fig. 5 In (a) white line part of the experimental Cu K-edge HR-XANES is shown here to highlight the change in intensity of this peak in the materials studied in situ. In (b) the simulated Cu K-edge XANES using FDMNES software of the four clusters (generated by MD simulation and clusters are shown Scheme 1) along with as-prepared, ex situ and in situ samples treated at 773 K. | ||
The copper ions in hematite were modelled with the inclusion of a substitutional Cu defect in a supercell of Fe2O3. The cell was relaxed with DFT methods and the resulting structure was used as a starting configuration for molecular dynamics (MD) simulations at the temperatures of 300, 773 and 1000 K. The final local structure (see Scheme 1) obtained from this calculation is used for further XANES simulation using the code FDMNES to evaluate the effect of local structure on the WL intensity (simulation of the pre-edge feature is not shown here as it is not reliably calculated) and they are plotted in Fig. 5(b). Here, we also compare the as-prepared and thermally treated materials. It is interesting to note that the WL intensity of the as-prepared material appears similar to the structure calculated for the 300 K than 0 K cluster. This emphasises that the Cu2+ in the as prepared material has distorted octahedral environment supporting the pre-edge intensity observation. Similarly, the XANES spectra for the material treated in situ at 773 K is comparable to the simulated XANES using the structure obtained from MD at 773 K calculations, thus suggesting that the distortions in the coordination environment are likely to be similar to this computed structure. The ex situ calcined sample at 773 K shows intensity approaching that of the DFT calculated structure but with lesser intensity, indicating that the ex situ calcined sample is likely to be more distorted compared to the DFT simulated structure.
 | ||
| Scheme 1 Proposed local structure of Cu2+–O coordination environment in the iron oxide (hematite) lattice obtained using combination of DFT and MD simulation at selected temperatures. Various Cu–O distances resulting from these quenched structures are also given. | ||
4. Conclusions
Based on the high-resolution XANES observations combined with DFT and MD simulations, we propose the following local structural model for copper ions in the Cu–Cr–Fe oxide in the thermally activated state, prior to catalytic reactions. The as-prepared material is proposed to have a distorted CuO6 environment, specifically the WL part of the data closely resembles that simulated at 300 K. During thermal treatment, the Cu2+ ions remain as Cu2+ but undergo a further distortion in their octahedral environment. Our work is in agreement with the proposal that copper ions are in a solid solution17,23 and certainly discount any physical mixture of CuO (in any noticeable amounts) along with the solid solution. Importantly, the present work clearly demonstrates that the use of all the spectral features present in the HR-XANES spectra, in particular the pre-edge peak area and its position and comparison with selected relevant reference compounds, can be the basis for evaluating and understanding the local site symmetry of copper ions in a range of copper-containing materials.Author contributions
Experimental plan: T. L., L. L., T. H., L. V. D. W. and G. S.; Material preparation: L. L. and L. V. D. W.; Synchrotron measurements: T. L., T. H. and G. S.; Beamline support: M. A., Laboratory measurements support: T. L. and L. L. Data analysis: T. L. M. A. and G. S.; Original draft preparation: T. L. and G. S.; Manuscript review: all authors; Supervision: G. S., L. L., L. V. D. W., M. A. and T. H.; Funding acquisition: G. S.Conflicts of interest
There are no conflicts to declare.Acknowledgements
We thank EPSRC, UCL and Johnson Matthey for funding. Diamond Light Source (under the SP18039-1 proposal number) for providing beamtime and other facilities is gratefully acknowledged. We also thank Dr Diego Gianolio for useful discussions and Miss Meltem Yilmaz with their help in XAS experiments. PSDS service for providing crystallographic data of some of the compounds used in this work is gratefully acknowledged. MA thank Computing resources provided by STFC Scientific Computing Department's SCARF cluster and the High Throughput Computing infrastructure of Diamond Light Source.Notes and references
- C. Mondelli, D. Ferri, J. D. Grunwaldt, N. Ravasio and A. Baiker, Catal. Today, 2011, 178, 124–131 CrossRef CAS.
- R. P. Ye, L. Lin, Q. Li, Z. Zhou, T. Wang, C. K. Russell, H. Adidharma, Z. Xu, Y. G. Yao and M. Fan, Catal. Sci. Technol., 2018, 8, 3428–3449 RSC.
- S. Zhang, G. Fan and F. Li, Green Chem., 2013, 15, 2389–2393 RSC.
- U. De-La-Torre, B. Pereda-Ayo, M. Moliner, J. R. González-Velasco and A. Corma, Appl. Catal., B, 2016, 187, 419–427 CrossRef CAS.
- A. M. Beale, F. Gao, I. Lezcano-Gonzalez, C. H. F. Peden and J. Szanyi, Chem. Soc. Rev., 2015, 44, 7371–7405 RSC.
- C. W. Andersen, E. Borfecchia, M. Bremholm, M. R. V. Jørgensen, P. N. R. Vennestrøm, C. Lamberti, L. F. Lundegaard and B. B. Iversen, Angew. Chem., Int. Ed., 2017, 56, 10367–10372 CrossRef CAS PubMed.
- Z. Li, S. G. Divakara and R. M. Richards, in Advanced materials, ed. K. E. Geckeler and H. Nishide, Wiley-VCH, Weinheim, Germany, 2010, pp. 333–355 Search PubMed.
- S. Dang, H. Yang, P. Gao, H. Wang, X. Li, W. Wei and Y. Sun, Catal. Today, 2019, 330, 61–75 CrossRef CAS.
- K. A. Ali, A. Z. Abdullah and A. R. Mohamed, Renewable Sustainable Energy Rev., 2015, 44, 508–518 CrossRef CAS.
- D. W. Jeong, W. J. Jang, J. O. Shim, W. B. Han, H. S. Roh, U. H. Jung and W. L. Yoon, Renewable Energy, 2014, 65, 102–107 CrossRef CAS.
- D. Vovchok, C. J. Guild, J. Llorca, W. Xu, T. Jafari, P. Toloueinia, D. Kriz, I. Waluyo, R. M. Palomino, J. A. Rodriguez, S. L. Suib and S. D. Senanayake, Phys. Chem. Chem. Phys., 2017, 19, 17708–17717 RSC.
- L. Barrio, M. Estrella, G. Zhou, W. Wen, J. C. Hanson, A. B. Hungría, A. Hornés, M. Fernández-García, A. Martínez-Arias and J. A. Rodriguez, J. Phys. Chem. C, 2010, 114, 3580–3587 CrossRef CAS.
- A. M. Beale, E. K. Gibson, M. G. O’Brien, S. D. M. Jacques, R. J. Cernik, M. Di Michiel, P. D. Cobden, Ö. Pirgon-Galin, L. Van De Water, M. J. Watson and B. M. Weckhuysen, J. Catal., 2014, 314, 94–100 CrossRef CAS.
- R. Rao, A. Dandekar, R. T. K. Baker and M. A. Vannice, J. Catal., 1997, 171, 406–419 CrossRef CAS.
- H. Adkins and R. Connor, J. Am. Chem. Soc., 1931, 53, 1091–1095 CrossRef CAS.
- M. Zhu, T. C. R. Rocha, T. Lunkenbein, A. Knop-Gericke, R. Schlögl and I. E. Wachs, ACS Catal., 2016, 6, 4455–4464 CrossRef CAS.
- A. Puig-Molina, F. M. Cano and T. V. W. Janssens, J. Phys. Chem. C, 2010, 114, 15410–15416 CrossRef CAS.
- C. J. Keturakis, M. Zhu, E. K. Gibson, M. Daturi, F. Tao, A. I. Frenkel and I. E. Wachs, ACS Catal., 2016, 6, 4786–4798 CrossRef CAS.
- F. Polo-Garzon, V. Fung, L. Nguyen, Y. Tang, F. Tao, Y. Cheng, L. L. Daemen, A. J. Ramirez-Cuesta, G. S. Foo, M. Zhu, I. E. Wachs, D. E. Jiang and Z. Wu, J. Am. Chem. Soc., 2019, 141, 7990–7999 CrossRef CAS PubMed.
- A. Andreev, V. Idakiev, D. Mihajlova and D. Shopov, Appl. Catal., 1986, 22, 385–387 CrossRef CAS.
- C. Rhodes, B. P. Williams, F. King and G. J. Hutchings, Catal. Commun., 2002, 3, 381–384 CrossRef CAS.
- M. Zhu and I. E. Wachs, ACS Catal., 2016, 6, 722–732 CrossRef CAS.
- M. A. Edwards, D. M. Whittle, C. Rhodes, A. M. Ward, D. Rohan, M. D. Shannon, G. J. Hutchings and C. J. Kiely, Phys. Chem. Chem. Phys., 2002, 4, 3902–3908 RSC.
- C. Rhodes and G. J. Hutchings, Phys. Chem. Chem. Phys., 2003, 5, 2719–2723 RSC.
- P. Kappen, J.-D. Grunwaldt, B. S. Hammershøi, L. Tröger and B. S. Clausen, J. Catal., 2001, 198, 56–65 CrossRef CAS.
- M. Zhu, P. Tian, R. Kurtz, T. Lunkenbein, J. Xu, R. Schlögl, I. E. Wachs and Y. F. Han, Angew. Chem., Int. Ed., 2019, 58, 9083–9087 CrossRef CAS PubMed.
- M. Zhu, J. Chen, L. Shen, M. E. Ford, J. Gao, J. Xu, I. E. Wachs and Y. F. Han, Appl. Catal., B, 2020, 271, 118943 CrossRef CAS.
- F. Meshkani and M. Rezaei, Ind. Eng. Chem. Res., 2015, 54, 1236–1242 CrossRef CAS.
- D. Jiang, L. Men, J. Wang, Y. Zhang, S. Chickenyen, Y. Wang and F. Zhou, Biochemistry, 2007, 46, 9270–9282 CrossRef CAS PubMed.
- S. E. Allen, R. R. Walvoord, R. Padilla-Salinas and M. C. Kozlowski, Chem. Rev., 2013, 113, 6234–6458 CrossRef CAS PubMed.
- S. T. Korhonen, D. W. Fickel, R. F. Lobo, B. M. Weckhuysen and A. M. Beale, Chem. Commun., 2011, 47, 800–802 RSC.
- T. Anggara, C. Paolucci and W. F. Schneider, J. Phys. Chem. C, 2016, 120, 27934–27943 CrossRef CAS.
- M. Agote-Arán, I. Lezcano-González, A. G. Greenaway, S. Hayama, S. Díaz-Moreno, A. B. Kroner and A. M. Beale, Appl. Catal., A, 2019, 570, 283–291 CrossRef.
- T. Günter, D. E. Doronkin, H. W. P. Carvalho, M. Casapu and J. D. Grunwaldt, J. Phys.: Conf. Ser., 2016, 712, 012071 CrossRef.
- F. Giordanino, E. Borfecchia, K. A. Lomachenko, A. Lazzarini, G. Agostini, E. Gallo, A. V. Soldatov, P. Beato, S. Bordiga and C. Lamberti, J. Phys. Chem. Lett., 2014, 5, 1552–1559 CrossRef CAS PubMed.
- E. M. C. Alayon, M. Nachtegaal, E. Kleymenov and J. A. Van Bokhoven, Microporous Mesoporous Mater., 2013, 166, 131–136 CrossRef CAS.
- P. Frank, M. Benfatto, M. Qayyam, B. Hedman and K. O. Hodgson, J. Chem. Phys., 2015, 142, 084310-1–084310-14 CrossRef PubMed.
- A. Gaur, W. Klysubun, N. Nitin Nair, B. D. Shrivastava, J. Prasad and K. Srivastava, J. Mol. Struct., 2016, 1118, 212–218 CrossRef CAS.
- A. Gaur, W. Klysubun, B. Soni, B. D. Shrivastava, J. Prasad and K. Srivastava, J. Mol. Struct., 2016, 1121, 119–127 CrossRef CAS.
- C. Prestipino, S. Bordiga, C. Lamberti, S. Vidotto, M. Garilli, B. Cremaschi, A. Marsella, G. Leofanti, P. Fisicaro, G. Spoto and A. Zecchina, J. Phys. Chem. B, 2003, 107, 5022–5030 CrossRef CAS.
- F. Farges, P. E. Petit, G. Brown and F. Martin, Am. Mineral., 2001, 86, 714–730 CrossRef.
- F. Farges, G. E. Brown and J. J. Rehr, Phys. Rev. B: Condens. Matter Mater. Phys., 1997, 56, 1809–1819 CrossRef CAS.
- G. S. Henderson, F. M. F. De Groot and B. J. A. Moulton, Rev. Mineral. Geochem., 2014, 78, 75–138 CrossRef CAS.
- M. Fernández-García, Catal. Rev.: Sci. Eng., 2002, 44, 59–121 CrossRef.
- M. Fernandez-Garcia, C. M. Alvarez and G. L. Haller, J. Phys. Chem., 1995, 99, 12565–12569 CrossRef CAS.
- V. L. Sushkevich, D. Palagin and J. A. van Bokhoven, Angew. Chem., Int. Ed., 2018, 57, 8906–8910 CrossRef CAS PubMed.
- J. Meyet, K. Searles, M. A. Newton, M. Wörle, A. P. van Bavel, A. D. Horton, J. A. van Bokhoven and C. Copéret, Angew. Chem., Int. Ed., 2019, 58, 9841–9845 CrossRef CAS PubMed.
- C. Lamberti, C. Prestipino, F. Bonino, L. Capello, S. Bordiga, G. Spoto, A. Zecchina, S. D. Moreno, B. Cremaschi, M. Garilli, A. Marsella, D. Carmello, S. Vidotto and G. Leofanti, Angew. Chem., Int. Ed., 2002, 41, 2341–2344 CrossRef CAS.
- J. Singh, C. Lamberti and J. A. Van Bokhoven, Chem. Soc. Rev., 2010, 39, 4754–4766 RSC.
- E. Borfecchia, K. A. Lomachenko, F. Giordanino, H. Falsig, P. Beato, A. V. Soldatov, S. Bordiga and C. Lamberti, Chem. Sci., 2015, 6, 548–563 RSC.
- A. R. Fahami, T. Günter, D. E. Doronkin, M. Casapu, D. Zengel, T. H. Vuong, M. Simon, F. Breher, A. V. Kucherov, A. Brückner and J. D. Grunwaldt, React. Chem. Eng., 2019, 4, 1000–1018 RSC.
- T. Günter, H. W. P. Carvalho, D. E. Doronkin, T. Sheppard, P. Glatzel, A. J. Atkins, J. Rudolph, C. R. Jacob, M. Casapu and J. D. Grunwaldt, Chem. Commun., 2015, 51, 9227–9230 RSC.
- O. V. Safonova, M. Tromp, J. A. Van Bokhoven, F. M. F. De Groot, J. Evans and P. Glatzel, J. Phys. Chem. B, 2006, 110, 16162–16164 CrossRef CAS PubMed.
- A. Boubnov, H. W. P. Carvalho, D. E. Doronkin, T. Gunter, E. Gallo, A. J. Atkins, C. R. Jacob and J. D. Grunwaldt, J. Am. Chem. Soc., 2014, 136, 13006–13015 CrossRef CAS PubMed.
- http://h http://ttps://patents.google.com/patent/US5656566A/en .
- M. Bauer, Phys. Chem. Chem. Phys., 2014, 16, 13827–13837 RSC.
- O. Bunau and Y. Joly, J. Phys.: Condens. Matter, 2009, 21, 1–11 CrossRef.
- S. Hayama, G. Duller, J. P. Sutter, M. Amboage, R. Boada, A. Freeman, L. Keenan, B. Nutter, L. Cahill, P. Leicester, B. Kemp, N. Rubies and S. Diaz-Moreno, J. Synchrotron Radiat., 2018, 25, 1556–1564 CrossRef CAS PubMed.
- D. Bellet, B. Gorges, A. Dallery, P. Bernard, E. Pereiro and J. Baruchel, J. Appl. Crystallogr., 2003, 36, 366–367 CrossRef CAS.
- B. Ravel and M. Newville, J. Synchrotron Radiat., 2005, 12, 537–541 CrossRef CAS PubMed.
- S. J. Clark, M. D. Segall, C. J. Pickard, P. J. Hasnip, M. I. J. Probert, K. Refson and M. C. Payne, Zeitschrift fur Krist., 2005, 220, 567–570 CAS.
- J. P. Perdew, K. Burke and M. Ernzerhof, Phys. Rev. Lett., 1996, 77, 3865–3868 CrossRef CAS PubMed.
- S. P. Gao, C. J. Pickard, M. C. Payne, J. Zhu and J. Yuan, Phys. Rev. B: Condens. Matter Mater. Phys., 2008, 77, 115122-1–115122-7 Search PubMed.
- K. Mathew, C. Zheng, D. Winston, C. Chen, A. Dozier, J. J. Rehr, S. P. Ong and K. A. Persson, Sci. Data, 2018, 5, 1–8 CrossRef PubMed.
- V. Martis, R. Oldman, R. Anderson, M. Fowles, T. Hyde, R. Smith, S. Nikitenko, W. Bras and G. Sankar, Phys. Chem. Chem. Phys., 2013, 15, 168–175 RSC.
- K. I. Shimizu, H. Maeshima, H. Yoshida, A. Satsuma and T. Hattori, Phys. Chem. Chem. Phys., 2001, 3, 862–866 RSC.
- J. L. DuBois, P. Mukherjee, T. D. P. Stack, B. Hedman, E. I. Solomon and K. O. Hodgson, J. Am. Chem. Soc., 2000, 122, 5775–5787 CrossRef CAS.
- N. C. Tomson, K. D. Williams, X. Dai, S. Sproules, S. Debeer, T. H. Warren and K. Wieghardt, Chem. Sci., 2015, 6, 2474–2487 RSC.
- M. Estrella, L. Barrio, G. Zhou, X. Wang, Q. Wang, W. Wen, J. C. Hanson, A. I. Frenkel and J. A. Rodriguez, J. Phys. Chem. C, 2009, 113, 14411–14417 CrossRef CAS.
- V. Krishnan, R. K. Selvan, C. O. Augustin, A. Gedanken and H. Bertagnolli, J. Phys. Chem. C, 2007, 111, 16724–16733 CrossRef CAS.
- H. R. Oswald, A. Reller, H. W. Schmalle and E. Dubler, Acta Crystallogr., Sect. C: Cryst. Struct. Commun., 1990, C46, 2279–2284 CrossRef CAS.
- S. Åsbrink and L. J. Norrby, Acta Crystallogr., Sect. B: Struct. Crystallogr. Cryst. Chem., 1970, B26, 8–15 CrossRef.
- W. A. Dollase and H. S. C. O’Neill, Acta Crystallogr., Sect. C: Cryst. Struct. Commun., 1997, C53, 657–659 CrossRef CAS.
- E. Chalmin, F. Farges and G. E. Brown Jr, Contrib. Mineral. Petrol., 2009, 157, 111–126 CrossRef CAS.
- M. P. Attfield, G. Sankar and J. M. Thomas, Catal. Lett., 2000, 70, 155–158 CrossRef CAS.
- R. D. Oldroyd, G. Sankar, J. M. Thomas and D. Özkaya, J. Phys. Chem. B, 1998, 102, 1849–1855 CrossRef CAS.
- W. M. Heijboer, P. Glatzel, K. R. Sawant, R. F. Lobo, U. Bergmann, R. A. Barrea, D. C. Koningsberger, B. M. Weckhuysen and F. M. F. De Groot, J. Phys. Chem. B, 2004, 108, 10002–10011 CrossRef CAS.
- J. D. Grunwaldt, P. Kappen, B. S. Hammershøi, L. Tröger and B. S. Clausen, J. Synchrotron Radiat., 2001, 8, 572–574 CrossRef CAS PubMed.
Footnote |
| † Electronic supplementary information (ESI) available. See DOI: 10.1039/d0cp06468h |
| This journal is © the Owner Societies 2021 |