
 Open Access Article
 This Open Access Article is licensed under a
 Creative Commons Attribution 3.0 Unported Licence
High-resolution UV spectroscopy of 1-indanol
A. O.
Hernandez-Castillo
 ,
Johannes
Bischoff
,
Ju Hyeon
Lee
,
Jennifer
Langenhan†
,
Mallikarjun
Karra
,
Gerard
Meijer
and
Sandra
Eibenberger-Arias
*
,
Johannes
Bischoff
,
Ju Hyeon
Lee
,
Jennifer
Langenhan†
,
Mallikarjun
Karra
,
Gerard
Meijer
and
Sandra
Eibenberger-Arias
*
Fritz-Haber-Institut der Max-Planck-Gesellschaft, Faradayweg 4-6, 14195 Berlin, Germany. E-mail: eibenberger@fhi-berlin.mpg.de
First published on 8th February 2021
Abstract
We report on rotationally resolved laser induced fluorescence (LIF) and vibrationally resolved resonance-enhanced multiphoton ionization (REMPI) spectroscopy of the chiral molecule 1-indanol. Spectra of the S1 ← S0 electronic transition are recorded in a jet-cooled, pulsed molecular beam. Using two time-delayed pulsed lasers, the lifetimes of the S1 state of the two most stable conformers, referred to as eq1 and ax2, have been determined. The S1 ← S0 origin bands of these conformers as well as the transition to a vibrationally excited level in the S1 state of eq1 are recorded with full rotational resolution (25 MHz observed linewidth) by measuring the LIF intensity following excitation with a tuneable, narrowband cw laser. On selected rotationally resolved electronic transitions, Lamb-dips are measured to confirm the Lorentzian lifetime-contribution to the observed lineshapes. The rotationally resolved S1 ← S0 origin band of a neon-complex of eq1 is measured via LIF as well. The fit of the rotationally resolved LIF spectra of the origin bands to those of an asymmetric rotor yields a standard deviation of about 6 MHz. The resulting spectroscopic parameters are tabulated and compared to the outcome of ab initio calculations. For both conformers as well as for the Ne-eq1 complex, the geometric structures in the S0 and S1 states are discussed. For all systems, the transition dipole moment is mainly along the a-axis, the contributions along the b- and c-axes being about one order of magnitude smaller.
1 Introduction
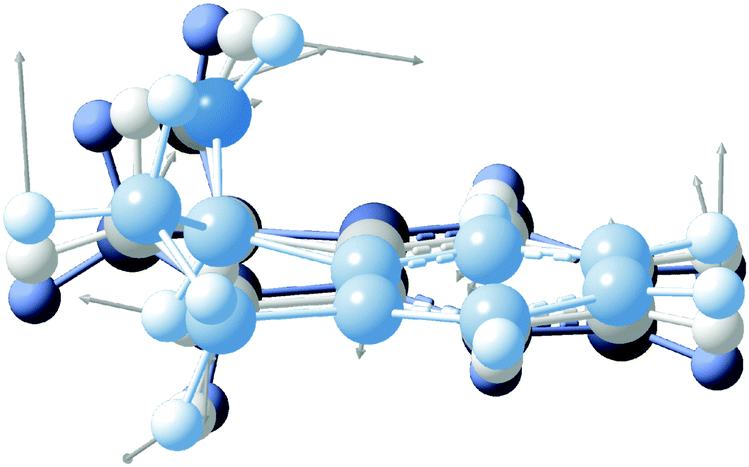
The intermolecular forces between chiral molecules and their chiral surroundings play an important role in the molecular recognition that accompanies many biological processes.1 Moreover, the efficacy of most drugs is intimately related to the chirality of their stereogenic centers.2 Gas phase spectroscopy enables the exploration of chiral molecules in isolation, without interference from any physical medium. If desired, these chiral molecules can be complexed with other molecules, e.g. water, in order to study molecular solvation as a function of cluster size. As a result, there is a significant role to be played by studies of chiral molecules and their complexes in the gas phase.Chiral alcohols are commonly used in the preparation of hormones, flavors, and fragrances.3 Moreover, they are important intermediates in the synthesis of many chiral medicines.4 1-Indanol is a relatively simple and rigid aromatic alcohol composed of a phenyl ring fused with a 5-membered aliphatic ring. The substituted carbon in the 1-position is the single chiral center in the molecule. The alicyclic ring can undergo large-amplitude puckering motion that results in two sets of conformations in which the O atom is either axial or equatorial (Fig. 1).5,6 In addition, the OH group can take on different orientations due to its torsional degree of freedom.
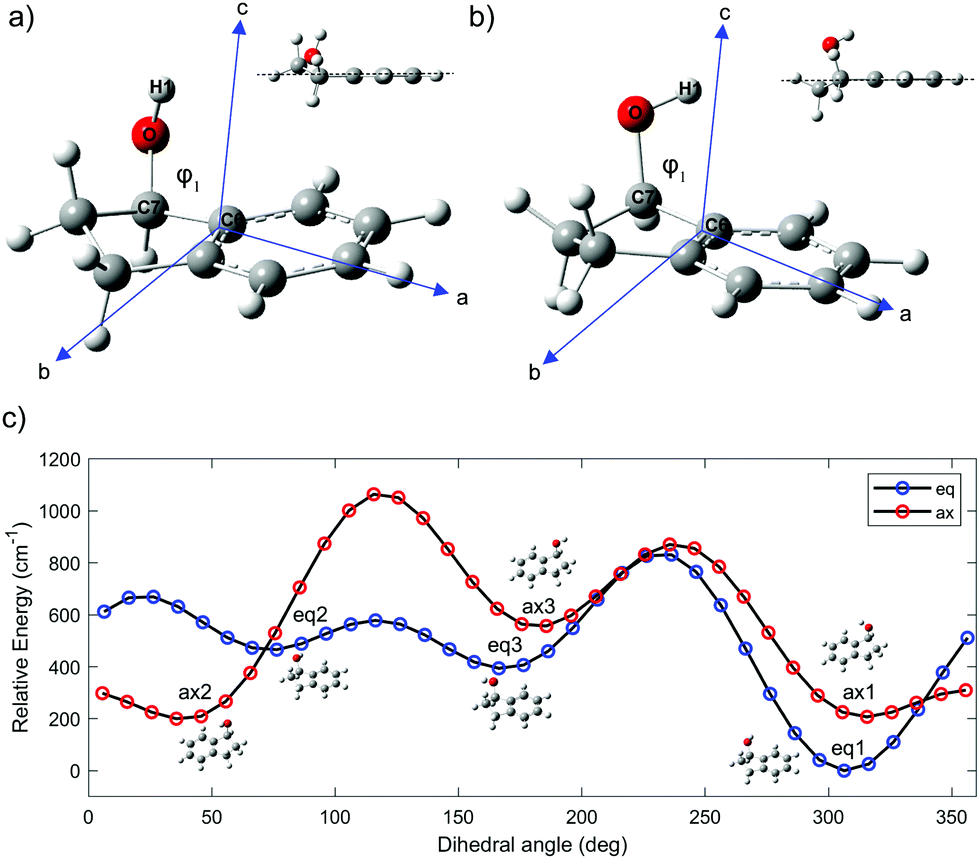 | ||
| Fig. 1 Conformational landscape of 1-indanol. (a) Lowest energy conformer eq1, with inertial axes as indicated. The inset visualizes the equatorial position of the OH group with respect to the 5-membered ring. (b) Second-lowest energy conformer ax2 with inertial axes as indicated. The inset visualizes the axial position of the OH group with respect to the 5-membered ring. (c) Cut of the calculated potential energy surface along the dihedral angle, ϕ1, for the equatorial and axial configurations. | ||
Three conformers of 1-indanol were previously identified using resonance-enhanced multiphoton ionization (REMPI) in the gas phase under jet-cooled conditions. The assignment of the spectral features to a specific conformer was accomplished with the aid of the single vibronic level dispersed fluorescence spectra, which was directly compared with predictions of the ground state vibrational frequencies for the low-frequency Franck–Condon active vibrations.7 The lowest energy conformer was determined to have the O atom in the equatorial position relative to the alicyclic ring with the structure shown in Fig. 1a. Previous studies have also shown that the relative abundance of conformers varies with cooling conditions of the supersonic expansion.8 Furthermore, IR-UV double resonance spectra of 1-indanol were recorded under expansion-cooled conditions, thereby obtaining the IR-active high-frequency vibrational transitions of each conformer.7
Even though three conformers have been identified in previous works, only one high-resolution study has been carried out. This study used microwave spectroscopy to determine accurate rotational constants for the lowest energy conformer eq1 in the ground electronic state.9 Moreover, the assignment of the other two conformers was not unambiguous.7 Various computational studies have been performed, focusing mainly on the interesting conformational potential energy surface (PES) of 1-indanol. The puckering barriers of similar molecules, indane and a variety of substituted indanes,10,11 have also been thoroughly investigated, providing the basis for comparison with the PES of 1-indanol.
The combination of supersonic molecular beams and narrow linewidth lasers is a very powerful tool in experimental high resolution molecular spectroscopy.12 In a supersonic molecular beam the vibrational and rotational temperatures of the molecular sample are significantly reduced. Furthermore, when the laser beam is orthogonal to the molecular beam, the linewidth due to Doppler broadening is reduced.13,14 Rotationally resolved laser-induced fluorescence (LIF) spectra can probe the geometrical structures of interrogated molecules in both ground and electronically excited states.15–19 In the present work, we report electronic spectra recorded in an apparatus that can perform both low-resolution REMPI and high-resolution LIF measurements under identical conditions. Fits to the fully rotationally-resolved UV spectra of the electronic origin bands of the two lowest energy conformers (eq1 and ax2, Fig. 1a and b) provide further structural insight to the conformational geometries. In addition, we fit the S1(ν2) ← S0(ν0) vibrational band of conformer eq1. We were also able to record the high-resolution spectrum of the neon complex of the lowest energy conformer eq1, tentatively determining the preferred binding site of the neon atom. From such data, one can deduce the perturbations provided by the binding partner on the electronic states of the chromophore.20,21
2 Experimental
2.1 Experimental setup
A sketch of the experimental setup is shown in Fig. 2. It consists of a source chamber and a detection chamber in which both low and high resolution UV experiments can be performed under identical conditions.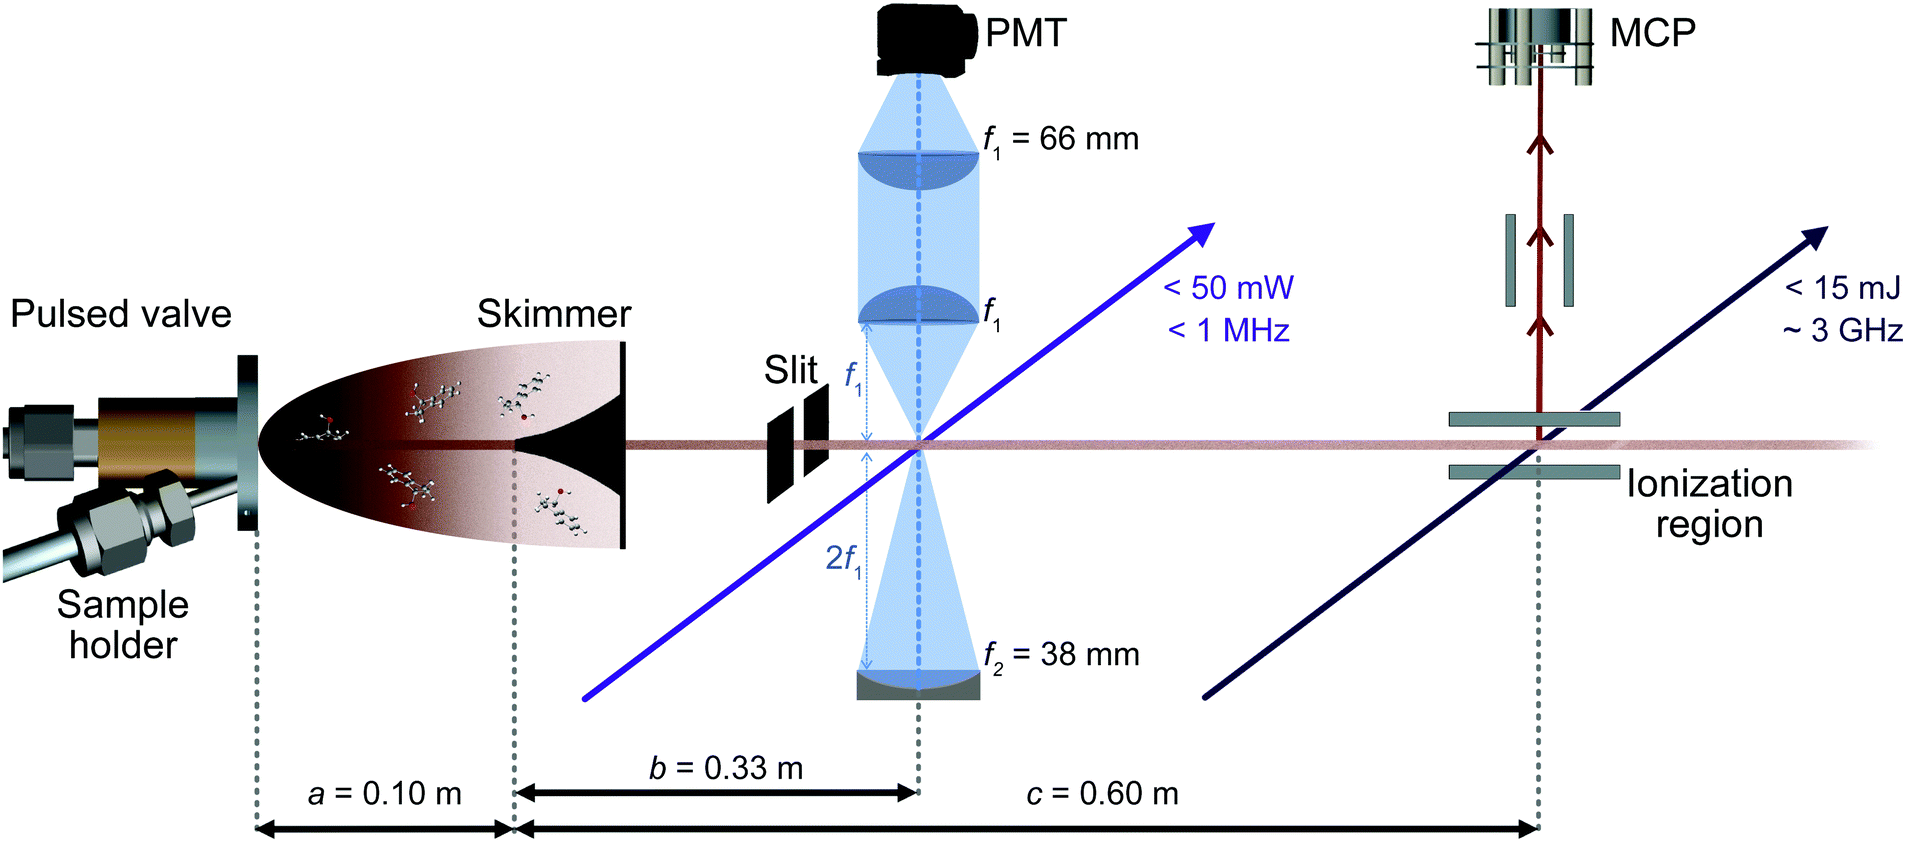 | ||
| Fig. 2 Schematic diagram of the experimental setup. Molecules are introduced into the chamber through a pulsed valve. After a ∼2 mm diameter skimmer the molecular beam is further collimated by a 2 mm slit located just before the LIF region, 30.5 cm downstream from the skimmer orifice. Low resolution electronic spectra are acquired by using resonance-enhanced two-photon ionization in combination with time-of-flight mass-selective detection. High resolution spectra are obtained by interrogating the molecular beam with a continuous narrow band laser and detecting fluorescence with a UV-sensitive photomultiplier tube (PMT). | ||
The solid sample of racemic 1-indanol (Alfa Aesar, 98% purity, used without further purification) is entrained in the carrier gas at a backing pressure of 3 bar. Jet-cooled 1-indanol is produced by a supersonic expansion using a pulsed valve (General valve, Series 9) with a nozzle diameter of 0.9 mm, operating at a frequency of 10 Hz. For sample heating capabilities we incorporated a custom sample holder close to the front plate of the valve. The sample reservoir and nozzle assembly are heated to ∼340 K. A skimmer (∼2 mm diameter) is placed between the source and the detection vacuum chamber to form a collimated molecular beam.
Low resolution UV spectra are recorded using REMPI time-of-flight (TOF) mass spectrometry (Fig. 2). The output of a frequency-doubled dye laser (Sirah PSCAN-D-18, ∼0.05 cm−1 UV resolution), pumped by the third harmonic of a Nd-YAG laser (Quanta Ray Lab-Series, 355 nm light) operated at 10 Hz, is used to record a one-color (1 + 1)-REMPI spectrum. Ions corresponding to the mass of 1-indanol are detected by a dual microchannel plate detector. Throughout the scans the wavelength of the pulsed dye laser is recorded using a wavemeter (HighFinesse WS6-600). This provides values which are then used to set the starting wavelength for the acquisition of high-resolution spectra. Moreover, the conformer-specific excited state lifetimes can be extracted from time delay scans in a two-color (1 + 1′)-REMPI measurement.
We recorded high-resolution (HR) UV-spectra of 1-indanol using LIF (Fig. 2). For excitation, we excite the molecules with a continuous frequency-quadrupled high power diode laser (TOPTICA, TA-FHG pro) with a tuning range from 262–271 nm and an output power above 50 mW. The mode-hop-free tuning range is ∼50 GHz at a linewidth of <1 MHz. During the spectral scan the wavelength of the laser is measured with a wavemeter (HighFinesse WS8-10, absolute accuracy of 10 MHz around 535 nm, which translates to 20 MHz absolute accuracy in the UV), and the wavelength of the frequency-doubled light is recorded.
The LIF is collected perpendicular to both the exciting light and the molecular beam, and detected by a photomultiplier tube (PMT, Hamamatsu R7154). The collection optics are comprised of a combination of two plano-convex lenses and a concave mirror (Fig. 2). The scattered light is reduced by placing a 0° high reflectivity 266 nm laser mirror in front of the second plano-convex lens, filtering out the excitation light with an efficiency above 99% and transmitting the off-resonance fluorescence with wavelengths longer than ∼275 nm. The digitized output of both REMPI and LIF experiments is recorded using a National Instrument oscilloscope (NI PXIe-5160, 500 MHz, 2.5 GS s−1). We ensure that the laser intersects the molecular beam perpendicularly by retro-reflecting the light with a plane mirror and aligning it such that the resulting spectral linewidth is minimized. Consequently, only the off-axis velocity distribution contributes to the residual Doppler broadening. This off-axis component of the velocity distribution is typically two orders of magnitude less than the one in the forward direction. In addition, the molecular beam is collimated using a 2 mm slit positioned 2.5 cm before the laser interaction region. In this way, we achieve a FWHM linewidth of ∼25 MHz when using neon as carrier gas, limited mainly by residual Doppler broadening.
Importantly, the laser double-pass arrangement enables Lamb dip measurements that provide precise center frequencies for the optical transitions. The Lamb dip is a Doppler free process that produces a dip at the line center with a Lorentzian profile due to the saturation of the molecular transition.22 The FWHM of the Lorentzian contribution is determined by the natural lifetime of the excited state. To perform these measurements the step-size of the laser is reduced to ∼0.2 MHz.
2.2 Calculations
The ground-state potential-energy surface (PES) of 1-indanol has a set of quasi-degenerate conformational minima associated with two coordinates; the torsional dihedral angle of the OH group and the configuration of the ring with respect to the hydroxyl group (the alicyclic puckering motion). Previous studies identified six minima, which are the same energy minima we find in our PES.9 The six minima on the conformational potential energy surface have the hydroxyl group in either axial or equatorial positions on the 5-membered ring. For each configuration, the OH group can take up one of three different orientations. To identify the structures, we use eq for equatorial and ax for axial to refer to the position of the O atom with respect to the puckering ring. Noticeably, there seems to be a subtle interaction between the OH group and the aromatic ring.23 This is shown in Fig. 1a and b, where the atomic positions in the principal axis system are indicated. The three different orientations of the OH are indicated with numbers referring to the dihedral angle ϕ. For the equatorial structures, when ϕ = +306° (−54°), +76°, +180° we ascribe the label 1, 2, 3 respectively. The corresponding minima for the axial structures occur when ϕ = +315° (−45°), +35°, +166°. In order to locate these minima and to better understand the potential energy landscape, we calculate a relaxed PES for the ax and eq conformers (Fig. 1c). The ϕ(H1OC7C6) dihedral angle (Fig. 1), associated with the OH rotation, is varied over a grid of points separated by 10° while optimizing all remaining coordinates.We optimize the structure of 1-indanol at a range of levels of theory in order to establish which one most closely reproduces the experimental rotational constants. The global minimum conformer (eq1) is used as point of comparison. Since we are interested in the subtle interaction between the OH and the π-cloud, as well as the steric interaction of the 5-membered ring, we choose a level of theory that uses a dispersion-corrected functional24,25 and a basis set that includes diffuse functions (B3LYP-D3BJ/6-311++G(d,p)). This level of theory is used to optimize the geometry of each of the six 1-indanol conformers and to obtain harmonic vibrational frequencies. Excited state geometry optimizations are performed using time-dependent DFT (TD-DFT) at the same level of theory, and both vertical and adiabatic excitation energies are calculated. All calculations are carried out with the Gaussian 16 suite of programs.26
The global minimum conformer, eq1, has the OH group in the equatorial position and pointing back towards the π cloud. The ax1 and ax2 are within ∼1 cm−1 of each other (essentially isoenergetic) and ∼150 cm−1 above eq1. Moreover, the energy barrier between these two conformers (ax1 and ax2) amounts to only 109 cm−1. This has made the assignment difficult in previous studies.7 The next most stable conformer is one of the equatorial conformers, labeled as eq3. Its energy is 333 cm−1 above the lowest energy conformer (Fig. 1c). Even though the PES shows 6 minima, since the barrier between eq2 and eq3 is also only ∼100 cm−1, it is likely that in the molecular beam there are only up to four conformers present, even when the lowest mass carrier gas (helium) is being used.27 It is worth noting that the three most stable conformers have the hydroxyl group directed towards the π cloud of the phenyl ring, suggesting that a weak π-hydrogen bond contributes to the stabilization of such conformers. This is also supported by the fact that the conformer minima are not equally spaced by 120°.
2.3 Overview of the fitting process
We analyze the rotationally resolved spectra using PGOPHER.28 As a starting point a spectrum is simulated using the calculated rotational constants at the B3LYP-D3BJ/6-311++G(d,p) level of theory. We compare this spectrum with the experimental one and make a tentative initial assignment of a set of transitions. Then, we include the assigned transitions to the fitting program producing adjustments to the rotational constants and a new simulation is performed. We continue this iterative process until all the observed transitions are assigned and reproduced in the fit.3 Results and discussion
The mass-resolved one-color REMPI spectrum of 1-indanol in the S1 ← S0 origin region is shown in Fig. 3a. The spectrum is nearly identical to those previously recorded by other research groups.5,7 Consistent with previous studies we find that the number of detected 1-indanol conformers and their relative abundance depend on the carrier gas (Ar, Ne, and He). In argon we only observe the lowest energy conformer with the S1 ← S0 origin at ∼37![[thin space (1/6-em)]](https://www.rsc.org/images/entities/char_2009.gif) 059 cm−1, whereas with neon and helium additional bands appear, the most characteristic ones are shifted by −31 cm−1, +71 cm−1, and +116 cm−1 from the origin of eq1. These transitions were assigned in previous work7 to the ax2/ax1 conformer, the eq3 conformer, and a vibrational band of eq1, respectively. Since with neon as buffer gas three conformers are present in the spectrum, and it provides a lower rotational temperature than helium, we choose this buffer gas for all the following experiments.
059 cm−1, whereas with neon and helium additional bands appear, the most characteristic ones are shifted by −31 cm−1, +71 cm−1, and +116 cm−1 from the origin of eq1. These transitions were assigned in previous work7 to the ax2/ax1 conformer, the eq3 conformer, and a vibrational band of eq1, respectively. Since with neon as buffer gas three conformers are present in the spectrum, and it provides a lower rotational temperature than helium, we choose this buffer gas for all the following experiments.
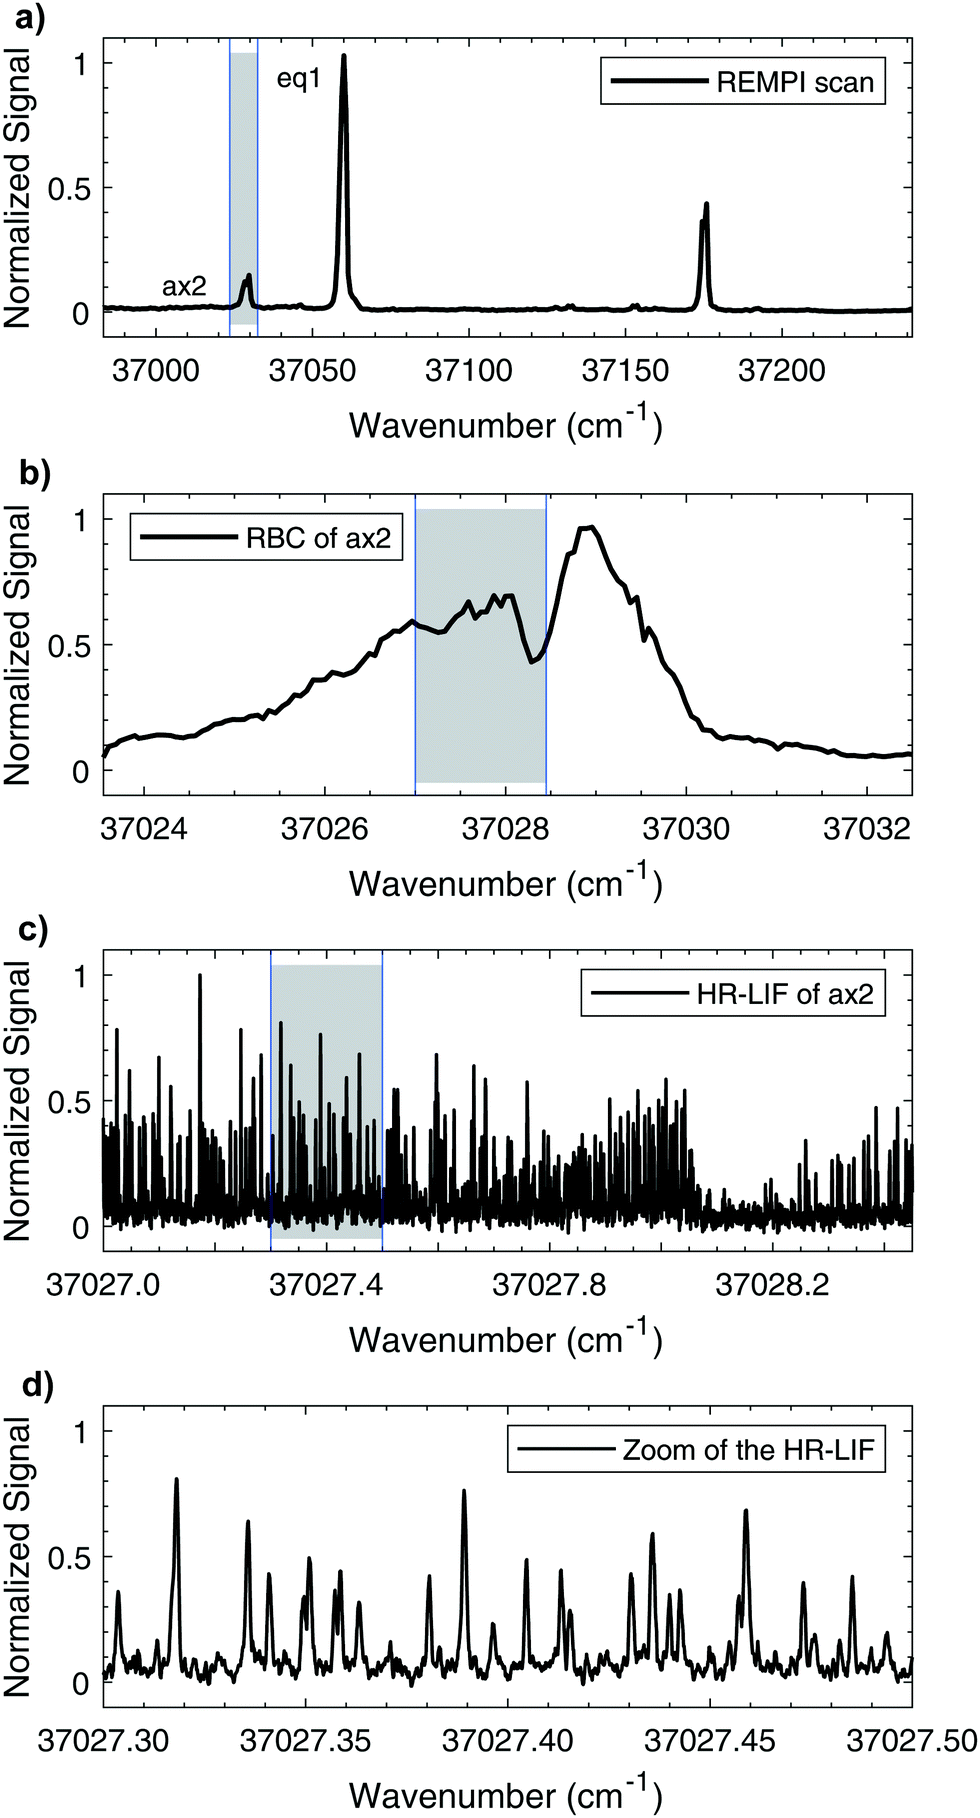 | ||
| Fig. 3 High- and low-resolution UV electronic spectra of 1-indanol. (a) REMPI spectrum recorded with Neon as carrier gas and 0.7 cm−1 step size using a frequency-doubled pulsed dye laser. (b) REMPI rotational band contour (RBC) of conformer ax2, recorded with a step size of 0.07 cm−1. (c) HR-LIF spectrum at ∼15 K of ax2, recorded using a continuous frequency-quadrupled high power diode laser. (d) Zoomed-in section of the HR-LIF spectrum of ax2. The highlighted grey areas indicate the regions plotted in the respective next lower sub-figure. | ||
Fig. 3 shows a series of scans going from low to high resolution, highlighting the capabilities of our instrument. The increasing magnification of the wavenumber scale goes from vibronic to full rotational resolution. The rotational band contours of the origin bands for eq1 and ax2 are recorded with a step size of 0.01 cm−1, using neon as a carrier gas. The contour for ax2 is shown in Fig. 3b. Comparison of these band contour scans with the high resolution spectra at ∼15 K shows good resemblance. For both conformers it is possible to clearly observe the P, Q, and R branches. Fig. 3c shows a portion of the same ax2 S1 ← S0 origin transition recorded with the high resolution UV laser, while Fig. 3d shows a small section on the scale where individual rotational transitions can be observed. The full width at half-maximum (FWHM) linewidth of each transition is ∼25 MHz. The measured linewidth is dominated by Doppler broadening with minor contributions from the natural and laser linewidths.
3.1 eq1, 1-indanol
We measure the HR-LIF spectrum of the electronic origin (T00, S1 ← S0) of eq1 over a ∼50 GHz range. Based on the best fits at two different rotational temperatures (∼1 K and ∼7 K) we determine the rotationless electronic origin to be located at 37058.9385(3) cm−1. Fig. 4a shows the characteristic P, Q, and R branches of the spectrum at ∼1.5 K which we use to obtain an initial fit. We use the warmer spectrum to add more transitions to the fit, thus improving the accuracy of the rotational constants, leading to a final fit of 407 spectral lines. In the experimental spectrum we find recognizable patterns of lines characteristic of a predominantly a-type spectrum. Nonetheless, there are some b- and c-type transitions as well. By comparing the experimental intensities with the simulation, we determine that the band intensities have an approximate a:b:c ratio of 81:11:8. The non-zero contribution from the c inertial axis arises from the out-of-plane heavy atoms that break the Cs symmetry of the 5-membered ring.
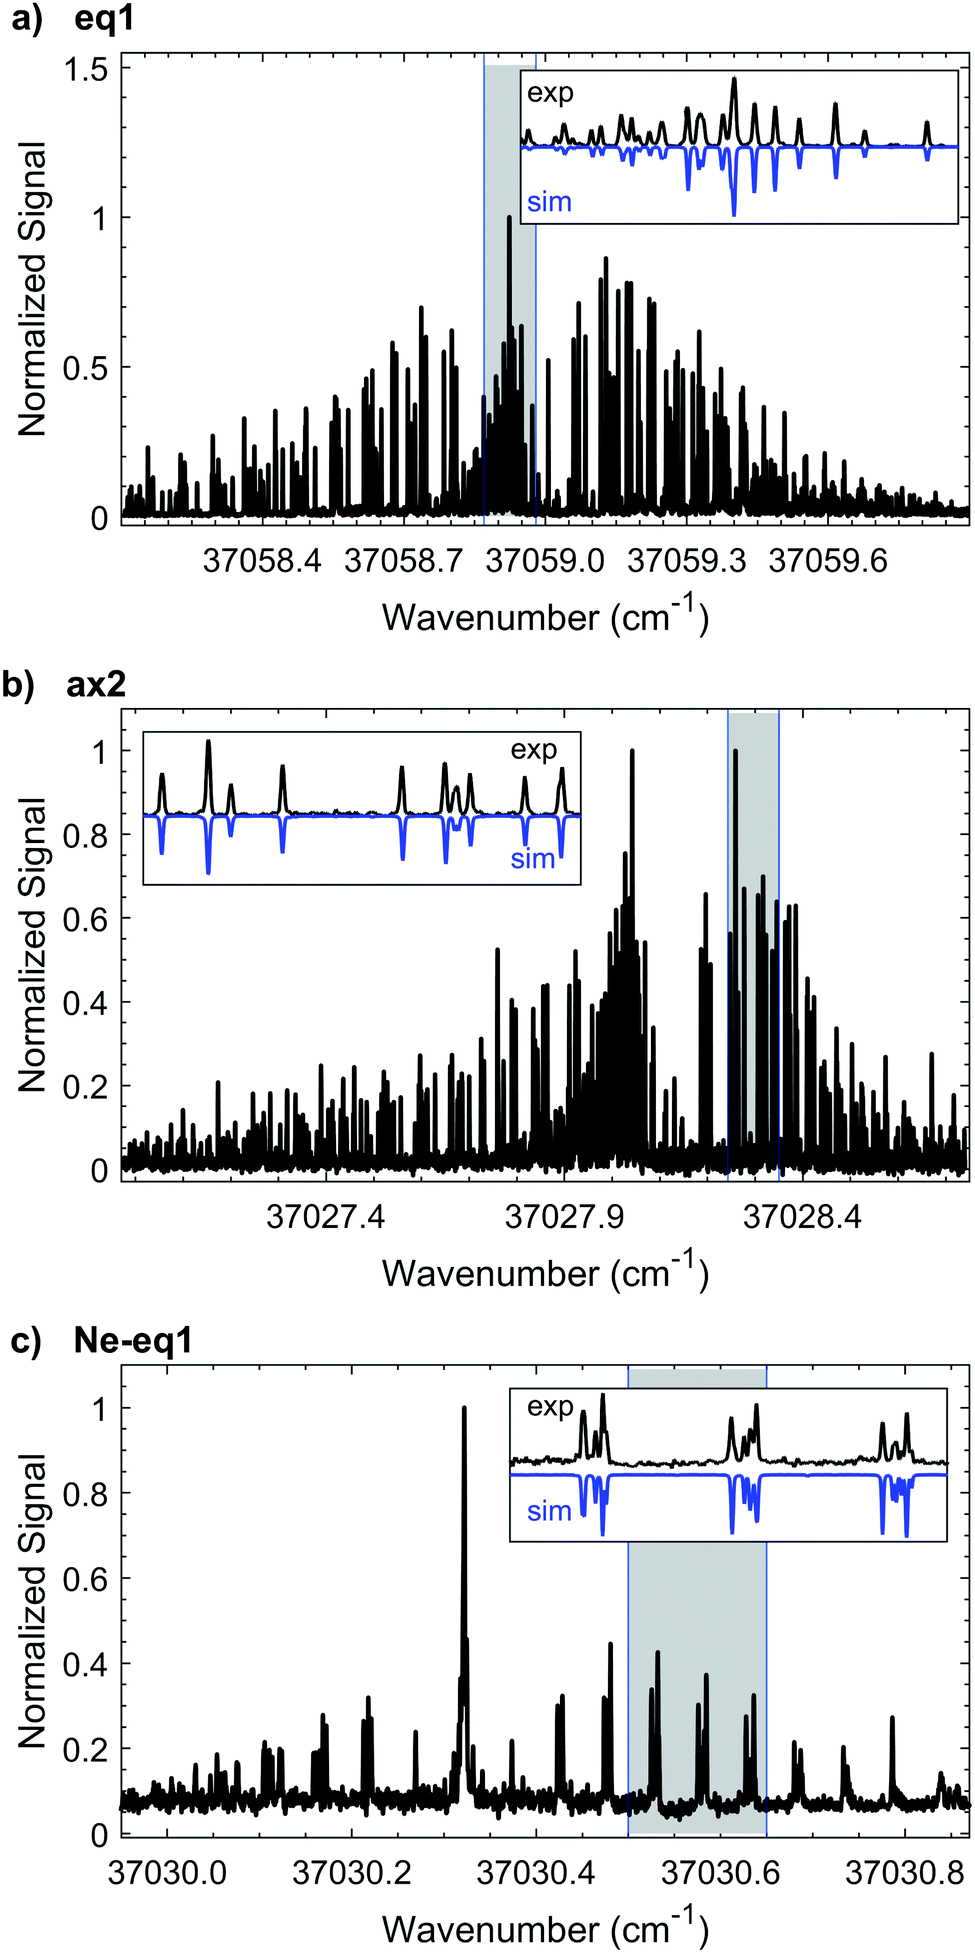 | ||
| Fig. 4 HR-LIF spectra of 3 species of 1-indanol: (a) conformer eq1 recorded at ∼1 K, (b) conformer ax2 recorded at ∼1.5 K, and (c) neon complex Ne-eq1 recorded at ∼1.5 K. In the insets the blue traces show the simulated spectra and the black traces are experimental data. These insets correspond to the domains shadowed with grey These spectra were recorded at a scan rate of ∼5 MHz per second. | ||
The ground state rotational parameters of conformer eq1 are taken from the literature9 without further attempt to optimize them. This is the only conformer that has been previously studied with microwave spectroscopy. We determine the rotational constants of the electronically excited state to be A = 2365.469(14) MHz, B = 1210.106(11) MHz, and C = 829.496(6) MHz. Table 1 lists the rotational constants, the asymmetry parameter κ, and the inertial defect Δ that are derived from our overall fit to the experimental data. The standard deviation of the fit is less than 6 MHz for eq1.
| eq1 (S1(ν0) ← S0(ν0)) | eq1 (S1(ν2) ← S0(ν0)) | ax2 (S1(ν0) ← S0(ν0)) | ax1 (S0(ν0) ← S0(ν0)) | |||
|---|---|---|---|---|---|---|
| Experimentala,b | Calculations | Experimentala,b | Experimentalb | Calculations | Calculations | |
| a The ground state constants are obtained from microwave experiments. b The 1σ standard deviations in parentheses are in units of the last digit. | ||||||
| Ground state | ||||||
| A (MHz) | 2410.071 (2) | 2411.975 | 2410.071 (2) | 2550.42 (24) | 2552.505 | 2501.443 |
| B (MHz) | 1231.257 (4) | 1228.787 | 1231.257 (4) | 1191.066 (28) | 1188.903 | 1197.064 |
| C (MHz) | 846.356 (6) | 845.221 | 846.356 (6) | 897.572 (25) | 895.344 | 886.764 |
| D k | 0.215 (7) | 0.176 | 0.215 (7) | — | 0.137 | 0.155 |
| d j | 0.014 (2) | 0.012 | 0.014 (2) | — | 0.042 | 0.005 |
| κ | −0.507 | −0.510 | −0.507 | −0.645 | −0.646 | −0.616 |
| Δ (amu Å2) | −23.03 (4) | −22.88 | −23.03 (4) | −59.41 (27) | −58.62 | −54.30 |
| Excited state | ||||||
| T00 (cm−1) | 37058.9385 (3) | 39033 |
37174.3952 (3) | 37028.0620 (3) | 39292 |
39111 |
| ΔA (MHz) | −44.602 (15) | −36.002 | −46.8 (2) | −61.37 (34) | −59.217 | −57.182 |
| ΔB (MHz) | −21.151 (12) | −11.859 | −19.725 (93) | −14.866 (39) | −8.444 | −10.386 |
| ΔC (MHz) | −16.856 (8) | −13.039 | −9.813 (43) | −16.116 (36) | −14.380 | −24.809 |
| κ′ | −0.504 | −0.502 | −0.509 | −0.633 | −0.628 | −0.590 |
| Δ (amu Å2) | −22.02 (6) | −20.70 | −22.55 (48) | −59.40 (28) | −57.15 | −46.32 |
| Transition dipole moments | ||||||
| a | — | 0.46 | — | — | −0.39 | −0.37 |
| b | — | −0.05 | — | — | −0.07 | −0.09 |
| c | — | −0.06 | — | — | −0.03 | −0.02 |
| σ (MHz) | 5.7 | — | 11.5 | 5.5 | — | — |
The change in rotational constants between the ground and excited states amounts to about 2% and is spread over all three inertial axes (ΔA = −44.602(15) MHz, ΔB = −21.151(12) MHz, ΔC = −16.856(8) MHz). This indicates that both states have similar geometries. The difference between the calculated (B3LYP-D3BJ/6-311++G(d,p)) and the observed rotational constants is 0.6% or less for both the ground and excited state. This gives confidence that the calculated structures can be used to enhance the structural insight. It is important to highlight that for the excited state all three rotational constants are slightly smaller than those in the ground states. Thus, there is a small increase in the dimensions of the molecule in all directions. This is captured by the calculations and consistent with the expansion of the aromatic ring associated with the ππ* transition.15 For a rigid planar structure, the inertial defect is zero, thus it serves as a measure of a molecule's planarity. The inertial defect of the excited state (−22.02(6) amu Å2) is slightly smaller than that of the ground state (−23.03(4) amu Å2). The main change stems from the flattening of the 5-membered ring.
High-resolution, rotationally-resolved electronic spectroscopy can be used to track the changes in rotational constants with vibrational excitation in the excited state.29,30 Previous studies of the vibronic spectroscopy of 1-indanol have shown that the low-frequency vibrations are sensitive to the conformation of the molecule.7 In the REMPI spectrum in Fig. 3a, a prominent band appears at +116 cm−1 above the electronic origin of eq1. Its counterpart in the electronic ground state has a frequency of +147 cm−1 based on dispersed emission measurements.7 Our calculations predict these vibrational frequencies within a few cm−1 (147 cm−1 and 114 cm−1 for the ground and excited state, respectively) of the experimental values. The form of the normal mode is shown in Fig. 5, corresponding to an out-of-plane folding motion of the 5-membered ring and the aromatic ring relative to one another.
 | ||
| Fig. 5 Normal mode associated with the +116 cm−1 band. The displacement of the vibration is shown with grey arrows. The overlaid molecular structures depict various stages of the vibration. | ||
By projecting the changes in the vibrationally-averaged structure onto the moments of inertia, one can view the form of those structural changes induced by the vibration. We record the HR-LIF spectrum of the vibrational band (S1(ν2) ← S0(ν0)) of eq1, located 116 cm−1 to the blue of the origin of eq1 at a rotational temperature of ∼2 K. Given the dominant a-type transition dipole moment it is not possible to identify b- or c-type transitions. The standard deviation of the fit amounts to 11.5 MHz, with the rotational constant A having the biggest uncertainty. In comparison to the other fits presented in this paper, this standard deviation is about a factor of two larger. The reason for this is systematic uncertainty in the wavelength readout. Instead of reading out the frequency-doubled light, for this scan the light of the fundamental wavelength is recorded, and the presence of more than one mode in the fundamental light entering the wavemeter causes instability in the wavelength reading which results in a lower frequency accuracy. Table 1 shows the change in the excited state rotational constants of the S1(ν2). Compared to the S1 zero-point level, there is a small change in all three rotational constants, with the largest change occurring in the C rotational constant. Recalling that the c-axis is perpendicular to the plane, the folding motion of the two rings brings the distant heavy atoms closer to this axis, resulting in an increase in C relative to the same rotational constant in the S1(ν0) state.
The analysis of rotational structure becomes difficult if the natural lifetime of the excited state is too short, since that leads to broadening of the individual spectral lines.15 We determined the lifetime of the S1 electronic state of eq1 through Lamb dip measurements and REMPI delay scans. For the Lamb dip measurement the lifetime is extracted from the profile by using the expression for the saturated absorption coefficient for a sample in a standing wave field:
 | (1) |
 we extract the linewidth γ = 4.1 ± 0.3 MHz (Fig. 6a), corresponding to a lifetime of 39 ± 3 ns.
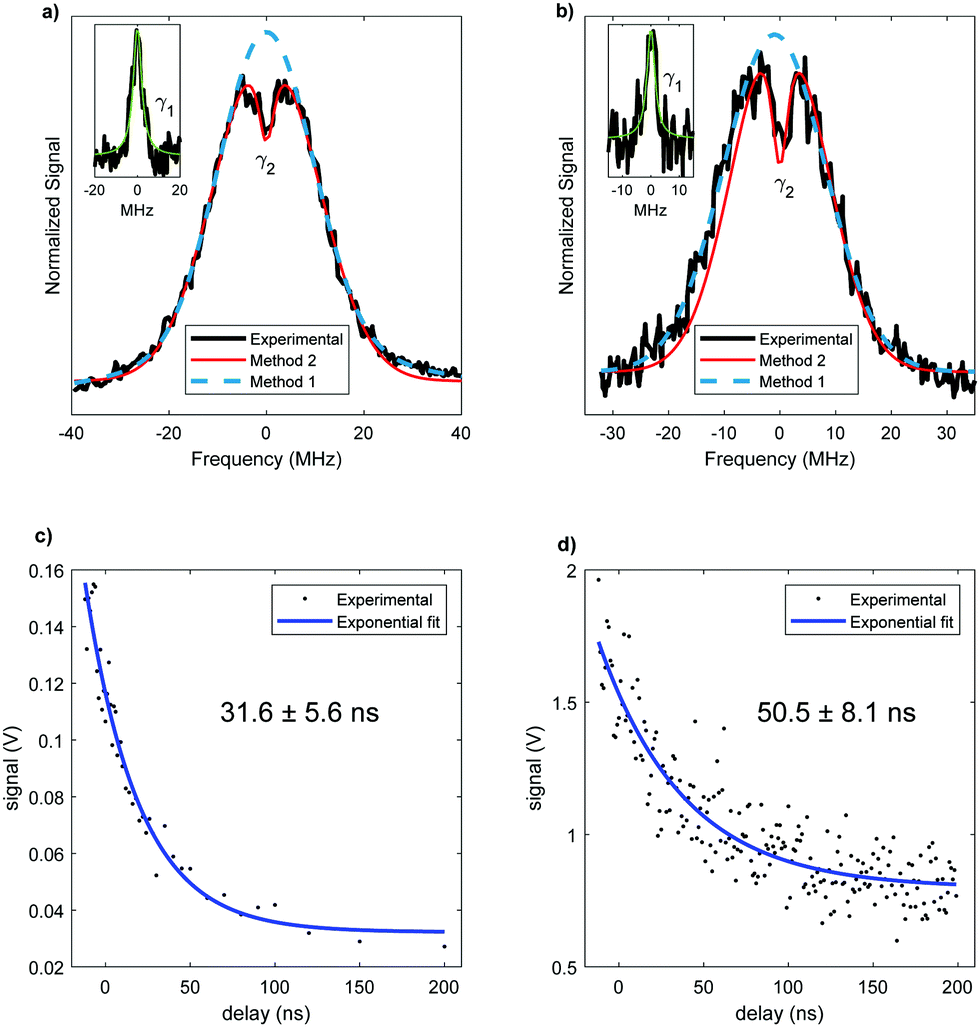 | ||
| Fig. 6 Lifetime measurements of the S1 excited state. (a) and (b) show Lamb dip measurement of eq1 and ax2, respectively. The experimental data is plotted in black, the blue curve is the fit to a Voigt profile. The subtraction of these two curves is shown in the inset, together with its fit to a Lorentzian (green curve). The red curve is the fit using the saturated absorption coefficient which determines D0 and γs. (c) and (d) are the two-color REMPI delay scans of eq1 and ax2, respectively. The lifetimes are extracted by fitting the experimental measurements to two single exponential decays. | ||
Our two-color REMPI delay scans are consistent with this result. We use the frequency-doubled output of a pulsed dye laser for the S1 ← S0 excitation step and an ArF excimer laser (193 nm) for the ionization step. The dye laser is set to the central wavelength associated with the S1 ← S0 transition of the conformer. The energies of the lasers are reduced using density filters to ensure that background signals from either laser by themselves are negligible. A delay scan is recorded by varying the timing between the two lasers. To determine Γ we fit a single exponential decay (Fig. 6c). Given that the ionizing wavelength is 193 nm, in principle, in case of intersystem crossing, we should have enough photon energy to ionize out of the triplet state. However, since we did not observe a biexponential decay, we can conclude that there is no long-lived component due to an excited triplet state. The determined lifetime from REMPI delay scans is 32 ± 6 ns, with the error representing the 95% confidence limit.
3.2 ax2, 1-indanol
The experimental HR-LIF spectrum around the electronic origin (T00, S1 ← S0) of ax2 at ∼1.5 K is shown in Fig. 4b. Two spectra, at 1.5 K and 15 K, are recorded and used for the fit. With the contribution of 445 spectral lines seven parameters (A, B, C, ΔA, ΔB, ΔC, T00) are varied simultaneously and fit within experimental accuracy (Table 1). Due to the signal-to-noise, we are only able to identify a- and b-type transitions with a:b of 87:13. In order for us to observe c-type transitions its contribution to the transition dipole moment would have to be larger than 4%.
When the hydroxyl group is in the axial position, there are two conformations (ax1 and ax2) that are calculated to be very close in energy and have a small barrier between them, as shown in Fig. 1c. Based on infrared and electronic spectroscopy, previous studies were not able to identify with certainty which one of these conformers was observed. Using our molecular parameters and comparing them with the calculated structures of ax1 and ax2, we are now able to confidently identify that the observed conformation is ax2. Moreover, this indicates that ax2 is slightly lower in energy than ax1, and that ax2 is the only one of these two structures that is populated in the molecular beam.
There is excellent agreement between the experimentally derived rotational constants and those predicted by the calculations, making it possible to deduce structural changes. Following the same reasoning as for eq1, we interpret the decrease in the A rotational constant as the expansion of the aromatic ring that accompanies the ππ* excitation. The inertial defect for both the ground and excited state is −59.4 amu Å2, confirming that the structure of 1-indanol in the S1 state, even in the puckered ring, is changed very little upon electronic excitation. On the other hand, eq1 has a structure closer to planar than ax2, an effect ascribable to the eq1 having the puckering of its 5-membered ring toward the OH group.
The lifetime for this conformer is also measured. The Lamb dip measurement (Fig. 6b) results in γ = 3.4 ± 0.6 MHz. Thus, the determined lifetime is 47 ± 8 ns. The two color REMPI time profile of conformer ax2 is fit to a single exponential decay, yielding the excited state lifetime of 51 ± 8 ns (Fig. 6d). As with eq1, there is no detectable long-lived component that could be ascribed to an excited triplet state. The lifetimes obtained using these two measurements are in agreement. With both methods the resulting excited state lifetime of ax2 is longer than the one of eq1, suggesting a conformer-dependence of the lifetime. However, the 95% confidence limits for the lifetimes of the two conformers slightly overlap, which could indicate an equivalent lifetime of both conformers. Nonetheless, a difference in lifetime for different conformers has been previously reported for similar molecules.32
3.3 Ne-eq1, neon complex of conformer eq1
High resolution spectroscopy of van der Waals complexes provides a unique view of large amplitude motion and the anisotropy of intermolecular forces.21 We measure the high resolution spectrum around the S1 ← S0 origin of the Ne-eq1 complex, shown in Fig. 4c. The band origin is located at 37030.3216(3) cm−1, −28.6169(4) cm−1 shifted from the origin of the bare conformer eq1. In the experimental spectrum it is only possible to identify a-type transitions indicating that the transition dipole moment is parallel to the a-inertial axis. Furthermore, the FWHM linewidth of each transition is still ∼25 MHz, as for the bare molecule. Based on a fit of 120 transitions, we determine the rotational constants for the ground and excited states, as listed in Table 2. The Neon complex spectrum is only present with significant intensity under the coldest expansion conditions, preventing acquisition under warm conditions where more rotational transitions could be included in the fit. Nonetheless, the standard deviation of the fit is 5.8 MHz. The change for all rotational constants between ground and excited state is less than 2%, and is associated primarily with changes around the b- and c-inertial axes.| Ne-eq1 complex (S1(ν0) ← S0(ν0)) | |
|---|---|
| Ground state | |
| A (MHz) | 1084.17 (66) |
| B (MHz) | 840.42 (12) |
| C (MHz) | 725.05 (10) |
| Excited state | |
| Origin (T00) (cm−1) | 37030.3216 (3) |
| ΔA (MHz) | 2.85 (92) |
| ΔB (MHz) | −13.55 (16) |
| ΔC (MHz) | 9.983 (13) |
When forming the complex, it is possible for neon to attach to several different positions. In a system such as a van der Waals complex, the weak interaction between the two species allows for some freedom in their relative motions. Thus, based on the rotational constants alone, it is difficult to state with certainty a single unique binding position for the neon atom to 1-indanol. However, several HR studies of complexes involving aromatic molecules have been performed, and we can use those as a guide.33 van der Waals complexes of benzene34 and its derivatives with rare gases35–37 generally have a preferred geometry where the rare gas atom lies approximately on a line perpendicular to the aromatic ring at a distance of about 3.5 Å from it.34 Using that position as a starting point, we explore the binding surface for the neon atom placed above and below the plane of the aromatic ring. The surface has small corrugations, however it is quite flat over regions that include parts of both the 5- and 6-membered rings. Thus, the rotational constants for most of the found minima are very similar.
However, when the neon atom binds on the opposite side of the ring plane from the OH group, the rotational constants of the predicted structures are closer to those experimentally determined. Furthermore, for these structures the transition dipole moment is localized nearly parallel to the a-axis which is consistent with the experimental observations. On this basis, we tentatively assign the observed Ne-eq1 complex to a structure in which the neon atom is on the opposite side of the OH group. The structures in which neon is on either side of the aromatic plane are nearly isoenergetic, and cold collisions in the expansion apparently exclusively produce this lowest energy conformer.27
4 Conclusions and outloook
We measured the rotationally resolved spectra of the two lowest-energy conformers of 1-indanol (eq1 and ax2) and the neon complex of its global minimum conformer. Confident assignments for the two lowest energy conformers were made for the S1 ← S0 origin band. Moreover, we were able to determine the rotational constants of the S1(ν2) ← S0(ν0) vibrational band of eq1. Based on the fits of the HR-LIF spectra we determined both the ground and electronically excited state rotational constants, which are directly related to the geometries of the molecule in the two electronic states. In addition, we determined that the transition dipole moment in all of them is mainly parallel to the a-inertial axis. When comparing the ground and excited state rotational constants for both conformers, it is clear that upon excitation both conformers expand slightly along all three axes due to the expansion of the aromatic ring associated with the ππ* transition. Of the two conformers, eq1 has a more planar structure, because the puckering of the 5-membered ring is in the same direction as the OH group.The Ne-eq1 complex has a well-resolved rotational structure that we have also fit to determine a set of spectroscopic rotational constants. While it is clear from this fit that the Ne atom is complexed to the eq1 conformer, the position of the Ne atom is difficult to determine with precision due to the multiple sites to which it can bind with 1-indanol. Furthermore, the weak nature of that binding can give rise to large-amplitude motions which would appear in the vibrationally averaged inertial constants measured in the experiment. Based on a comprehensive search of the different binding sites, we can claim that the Ne atom likely prefers to binds above the molecular plane on the side opposite to the OH group.
We were also able to record a HR-LIF spectrum around the transition that previous studies have tentatively assigned to the eq3 conformer. This transition is +71 cm−1 above the origin of eq1. However, its spectrum has not been fully understood yet, thus the structural insight will be discussed in the future. Finally, since 1-indanol is a chiral molecule, the present work serves as a necessary foundation for future enantiomer-specific measurements38 that use a combination of microwave and UV transitions to enhance the sensitivity of enantiomeric enrichment.
Conflicts of interest
There are no conflicts to declare.Acknowledgements
We gratefully acknowledge Henrik Haak who designed important portions of the experimental apparatus and Uwe Hoppe who has been instrumental in developing the instrument control software of our experiment. We thank Johanna Hofmann and Christian Schewe for their contributions during the early stages of the experiment, and Sebastian Kray for fast and friendly technical support. We also gratefully acknowledge the mechanical workshop of the Fritz-Haber-Institut for building key components of the experimental setup. Open Access funding provided by the Max Planck Society.Notes and references
- K. Michaeli, N. Kantor-Uriel, R. Naaman and D. H. Waldeck, Chem. Soc. Rev., 2016, 45, 6478–6487 RSC.
- Z. Juvancz and J. Szejtli, TrAC, Trends Anal. Chem., 2002, 21, 379–388 CrossRef CAS.
- L. Ou, Y. Xu, D. Ludwig, J. Pan and J. H. Xu, Org. Process Res. Dev., 2008, 12, 192–195 CrossRef CAS.
- A. Matsuyama, H. Yamamoto and Y. Kobayashi, Org. Process Res. Dev., 2002, 6, 558–561 CrossRef CAS.
- A. Bouchet, J. Altnöder, M. Broquier and A. Zehnacker, J. Mol. Struct., 2014, 1076, 344–351 CrossRef CAS.
- C. R. Torok, R. J. Lavrich and M. J. Tubergen, Chem. Phys., 2002, 283, 125–133 CrossRef CAS.
- K. L. Barbu-Debus, F. Lahmani, A. Zehnacker-Rentien, N. Guchhait, S. S. Panja and T. Chakraborty, J. Chem. Phys., 2006, 125, 174305 CrossRef.
- K. L. Barbu-Debus, A. Scherrer, A. Bouchet, D. Sebastiani, R. Vuilleumier and A. Zehnacker, Phys. Chem. Chem. Phys., 2018, 20, 14635–14646 RSC.
- B. Velino, P. Ottaviani, W. Caminati, A. Giardini and A. Paladini, ChemPhysChem, 2006, 7, 565–568 CrossRef CAS.
- Z. Arp, N. Meinander, J. Choo and J. Laane, J. Chem. Phys., 2002, 116, 6648–6655 CrossRef CAS.
- K. H. Hassan and J. Hollas, J. Mol. Spectrosc., 1991, 147, 100–113 CrossRef CAS.
- Handbook of High-resolution Spectroscopy, ed. M. Quack and F. Merkt, John Wiley & Sons, Ltd, 2011 Search PubMed.
- W. Majewski and W. Meerts, J. Mol. Spectrosc., 1984, 104, 271–281 CrossRef CAS.
- G. Berden, W. L. Meerts, M. Schmitt and K. Kleinermanns, J. Chem. Phys., 1996, 104, 972–982 CrossRef CAS.
- G. Berden, W. Meerts and W. Kreiner, Chem. Phys., 1993, 174, 247–253 CrossRef CAS.
- D. M. Miller, P. J. Morgan and D. W. Pratt, J. Phys. Chem. A, 2009, 113, 6964–6970 CrossRef CAS.
- S. Kunishige, T. Katori, M. Baba, M. Hayashi, H. Hasegawa and Y. Ohshima, J. Chem. Phys., 2015, 143, 244303 CrossRef.
- M. Wilke, M. Schneider, J. Wilke, J. A. Ruiz-Santoyo, J. J. Campos-Amador, M. E. González-Medina, L. Álvarez-Valtierra and M. Schmitt, J. Mol. Struct., 2017, 1140, 59–66 CrossRef CAS.
- J. T. Yi, S. Romero-Servin, L. Álvarez-Valtierra and D. F. Plusquellic, J. Chem. Phys., 2020, 152, 144307 CrossRef CAS.
- D. Scuderi, A. Paladini, M. Satta, D. Catone, S. Piccirillo, M. Speranza and A. G. Guidoni, Phys. Chem. Chem. Phys., 2002, 4, 4999–5003 RSC.
- W. E. Sinclair and D. W. Pratt, J. Chem. Phys., 1996, 105, 7942–7956 CrossRef CAS.
- G. Meijer, W. Ubachs, J. T. Meulen and A. Dymanus, Chem. Phys. Lett., 1987, 139, 603–611 CrossRef CAS.
- J. Altnöer, A. Bouchet, J. J. Lee, K. E. Otto, M. A. Suhm and A. Zehnacker-Rentien, Phys. Chem. Chem. Phys., 2013, 15, 10167–10180 RSC.
- S. Grimme, J. Antony, S. Ehrlich and H. Krieg, J. Chem. Phys., 2010, 132, 154104 CrossRef.
- S. Grimme, S. Ehrlich and L. Goerigk, J. Comput. Chem., 2011, 32, 1456–1465 CrossRef CAS.
- M. J. Frisch, G. W. Trucks, H. B. Schlegel, G. E. Scuseria, M. A. Robb, J. R. Cheeseman, G. Scalmani, V. Barone, G. A. Petersson, H. Nakatsuji, X. Li, M. Caricato, A. V. Marenich, J. Bloino, B. G. Janesko, R. Gomperts, B. Mennucci, H. P. Hratchian, J. V. Ortiz, A. F. Izmaylov, J. L. Sonnenberg, D. Williams-Young, F. Ding, F. Lipparini, F. Egidi, J. Goings, B. Peng, A. Petrone, T. Henderson, D. Ranasinghe, V. G. Zakrzewski, J. Gao, N. Rega, G. Zheng, W. Liang, M. Hada, M. Ehara, K. Toyota, R. Fukuda, J. Hasegawa, M. Ishida, T. Nakajima, Y. Honda, O. Kitao, H. Nakai, T. Vreven, K. Throssell, J. A. Montgomery, Jr., J. E. Peralta, F. Ogliaro, M. J. Bearpark, J. J. Heyd, E. N. Brothers, K. N. Kudin, V. N. Staroverov, T. A. Keith, R. Kobayashi, J. Normand, K. Raghavachari, A. P. Rendell, J. C. Burant, S. S. Iyengar, J. Tomasi, M. Cossi, J. M. Millam, M. Klene, C. Adamo, R. Cammi, J. W. Ochterski, R. L. Martin, K. Morokuma, O. Farkas, J. B. Foresman and D. J. Fox, Gaussian16 Revision C.01, Gaussian Inc., Wallingford, CT, 2016 Search PubMed.
- U. Erlekam, M. Frankowski, G. von Helden and G. Meijer, Phys. Chem. Chem. Phys., 2007, 9, 3786 RSC.
- C. M. Western, University of Bristol, http://pgopher.chm.bris.ac.uk.
- L. Álvarez-Valtierra, D. F. Plusquellic, J. T. Yi and D. W. Pratt, J. Phys. Chem. A, 2011, 115, 9557–9566 CrossRef.
- H. Ishikawa, M. Sugiyama, T. Kishi, M. Kira, N. Mikami, O. Kajimoto and A. M. Reddy, Chem. Phys., 2002, 283, 379–388 CrossRef CAS.
- W. Demtröder, Laser Spectroscopy, Basic Concepts and Instrumentation, Sringer, 3rd edn, 2003, vol. 1 Search PubMed.
- Y. Loquais, E. Gloaguen, M. Alauddin, V. Brenner, B. Tardivel and M. Mons, Phys. Chem. Chem. Phys., 2014, 16, 22192–22200 RSC.
- M. Becucci and S. Melandri, Chem. Rev., 2016, 116, 5014–5037 CrossRef CAS.
- T. Weber, E. Riedle, H. Neusser and E. Schlag, J. Mol. Struct., 1991, 249, 69–80 CrossRef CAS.
- F. Mazzoni, M. Becucci, J. Řezáč, D. Nachtigallová, F. Michels, P. Hobza and K. Müller-Dethlefs, Phys. Chem. Chem. Phys., 2015, 17, 12530–12537 RSC.
- M. Becucci, G. Pietraperzia, N. Lakin, E. Castellucci and P. Bréchignac, Chem. Phys. Lett., 1996, 260, 87–94 CrossRef CAS.
- T. Jayasekharan and C. S. Parmenter, J. Chem. Phys., 2004, 120, 11469–11478 CrossRef CAS.
- S. Eibenberger, J. Doyle and D. Patterson, Phys. Rev. Lett., 2017, 118, 123002 CrossRef.
Footnote |
| † Current address: Federal Institute for Materials Research and Testing (BAM), Department of Analytical Chemistry, Richard-Willstätter-Straße 11, 12489 Berlin, Germany. |
| This journal is © the Owner Societies 2021 |