 Open Access Article
Theoretical prediction by DFT and experimental observation of heterocation-doping effects on hydrogen adsorption and migration over the CeO2(111) surface†
Kota
Murakami
a,
Yuta
Mizutani
a,
Hiroshi
Sampei
a,
Atsushi
Ishikawa
 b,
Yuta
Tanaka
a,
Sasuga
Hayashi
a,
Sae
Doi
a,
Takuma
Higo
 a,
Hideaki
Tsuneki
a,
Hiromi
Nakai
a,
Hideaki
Tsuneki
a,
Hiromi
Nakai
 c and
Yasushi
Sekine
 *a
*a
aApplied Chemistry, Waseda University, 3-4-1, Okubo, Shinjuku, Tokyo 169-8555, Japan. E-mail: ysekine@waseda.jp
bNational Institute for Materials Science, 1-1, Namiki, Tsukuba, Ibaraki 305-0044, Japan
cChemistry and Biochemistry, Waseda University, 3-4-1, Okubo, Shinjuku, Tokyo 169-8555, Japan
First published on 26th January 2021
Abstract
Hydrogen (H) atom adsorption and migration over the CeO2-based materials surface are of great importance because of its wide applications to catalytic reactions and electrochemical devices. Therefore, comprehensive knowledge for controlling the H atom adsorption and migration over CeO2-based materials is crucially important. For controlling H atom adsorption and migration, we investigated irreducible divalent, trivalent, and quadrivalent heterocation-doping effects on H atom adsorption and migration over the CeO2(111) surface using density functional theory (DFT) calculations. Results revealed that the electron-deficient lattice oxygen (Olat) and the flexible CeO2 matrix played key roles in strong adsorption of H atoms. Heterocations with smaller valence and smaller ionic radius induced the electron-deficient Olat. In addition, smaller cation doping enhanced the CeO2 matrix flexibility. Moreover, we confirmed the influence of H atom adsorption controlled by doping on surface proton migration (i.e. surface protonics) and catalytic reaction involving surface protonics (NH3 synthesis in an electric field). Results confirmed clear correlation between H atom adsorption energy and surface protonics.
1. Introduction
Hydrogen (H) atom adsorption and migration over a metal oxide surface are fundamentally important for various catalytic reactions, as summarized in an earlier review.1 Many researchers have investigated passive migration of H atoms (i.e. hydrogen spillover) that are useful for hydrogenation and dehydrogenation of hydrocarbons,2–4 CO2 reduction5–7 and NH3 synthesis.8 Furthermore, most recently, we demonstrated novel low-temperature catalysis involving H atom migration activated by an electric field, i.e. surface protonics.9–11 The electric field provokes the reaction through collision between H+ over support and molecules (i.e. N2,11–15 methylcyclohexane,16 and CH417,18) over loading metals at the three-phase boundary (TPB). The H atom adsorption energy over metal oxides plays a fundamentally important role in catalytic reactions related to passive and electrochemically activated migration of H+.8,13 Therefore, control of H atom adsorption over metal oxides is a central subject in the field of catalysts.Doping of heterocations is a leading method among the methods that control metal oxide functions. Actually, H atom adsorption enhancement by doping has been reported for the cleavage of H–H, C–H, and O–H bonds.19–23 Therefore, elucidation of the correlation between dopant features and H atoms adsorption is highly demanded for tuning catalytic reactions involving H atoms adsorption and migration.
As described herein, we examined the doping effects on H2 dissociative adsorption over the CeO2 surface using irreducible divalent, trivalent, and quadrivalent heterocations. CeO2-based materials have been used for various catalytic reactions24 including catalysis related to surface protonics in the electric field.15,17,18 Its utilization is not limited to catalysis. Many researchers have anticipated the usefulness of CeO2-based materials as an electrolyte.25–27 Therefore, comprehensive understanding of H atom adsorption over CeO2-based materials is needed. DFT calculations presented in this work clarified the key roles of the electron-deficient lattice oxygen (Olat) and flexible CeO2 matrix controlled by valence and ionic radius of heterocations. Additionally, the performance of doped CeO2 was investigated experimentally using NH3 synthesis in the electric field as a model reaction. Results confirmed close agreement with those obtained from DFT studies.
2. Method
2.1 Electronic structure calculations
We conducted DFT calculations for CeO2(111) surfaces with dopants, as described in our earlier report.20 We have already confirmed the validity of the calculation conditions and models. We used the Vienna ab initio simulation program (VASP 5.4.4) for all DFT calculations.28–31 The core–valence interaction was described using the projector augmented wave (PAW) method.32 The valence electrons were expanded with the cutoff energy of 400 eV. We summarized the configurations of valence electrons in Table S1 (ESI†). The generalized gradient approximation (GGA) of Perdew–Burke–Ernzerhof (PBE) was applied to express the exchange correlation.33 Spin was polarized for all simulations. We used k-point mesh with Gaussian smearing for CeO2 bulk (5 × 5 × 5) and slab (1 × 1 × 1) models.34 The energy convergence was checked with 10−5 eV criteria. The van der Waals (vdW) dispersion forces were applied using the DFT-D3 method described by Grimme.35 The DFT+U method was used for considering the on-site Coulomb repulsion of Ce 4f orbitals. The U value was set to 5.0 eV.20,36–432.2 Computational models
We used the CeO2(111) surface as a repeated (4 × 4) supercell containing O–Ce–O tri-layers. The lattice constant of the DFT–optimized CeO2 bulk structure (5.43 Å) was applied to that of slab models. Each slab was separated in the z direction with 20 Å vacuum gap. Only the bottom O–Ce–O layer was fixed during geometry optimizations without other notations. Two Ce at the uppermost surface were replaced by divalent (Ca, Sr, Ba), trivalent (Al, Ga, Sc, Y, La), and quadrivalent (Hf, Zr) cations for expressing the doped surfaces. Gaseous H2 was placed in a 10 × 10 × 10 Å cubic box. Calculations were performed at Γ point. All calculation models were depicted for observation using VESTA.44 H atoms were placed at the top of surface oxygen of Ce1−xMxO2−δ(111), and the geometry was optimized. The most stable H atom adsorption structures on each surface are shown in Fig. S1 (ESI†). The detail of the calculation flows is shown in Section 3.1.2.3 Preparation of Fe-supported CeO2-based materials
Using a complex polymerization method, CeO2 and Ce0.9M0.1O2−δ (M: Sr, Al, Y, and Zr) were synthesized. First, citric acid monohydrate (Kanto Chemical Co. Inc.) and ethylene glycol (Kanto Chemical Co. Inc.) were dissolved in distilled water. Then, stoichiometric amounts of precursors (Kanto Chemical Co. Inc.) were added. The precursors are presented in Table S2 (ESI†). The mixture was stirred at 343 K overnight. Subsequently, the obtained solution was dried and crushed. Finally, the obtained powder was calcined at 773 K for 5 h with a ramping rate of 5 K min−1.5 wt% of Fe was loaded over synthesized CeO2-based materials using a liquid-phase reduction method as reported elsewhere.45 First, Fe(NO3)3·9H2O (Kanto Chemical Co. Inc.) was poured into distilled water. The support was dispersed in the obtained Fe aqueous solution by stirring for 1 h. Subsequently, the solution was heated at 393 K for 1 h under Ar flow. Then, 10% N2H4 solution (Fujifilm Wako Pure Chemical Corp.) was added dropwise. The slurry was stirred at 393 K for 1 h under Ar flow. The slurry was filtered. The obtained cake was dried at 393 K overnight.
2.4 Activity tests
NH3 synthesis rates were examined using a fixed bed flow type reactor equipped with a quartz tube under 0.1 MPa. 5 wt%Fe/support was sieved into 355–500 μm granules. Then 0.1 g of them were charged into the reactor. For application of the electric field, two stainless steel (SUS 304) rods were attached on the catalyst bed. Then 6 mA direct current was applied using a power supply device. The temperature of the catalyst bed when heated with Joule heat was measured directly using a thermocouple attached on the bottom of the catalyst bed. Applied currents and response voltages were detected using a digital phosphor oscilloscope (TDS 2001C; Tektronix Inc.). A schematic image of the reactor is portrayed in Fig. S2 (ESI†). The activities were measured under N2![[thin space (1/6-em)]](https://www.rsc.org/images/entities/char_2009.gif) :
:![[thin space (1/6-em)]](https://www.rsc.org/images/entities/char_2009.gif) H2 = 1
H2 = 1![[thin space (1/6-em)]](https://www.rsc.org/images/entities/char_2009.gif) :
:![[thin space (1/6-em)]](https://www.rsc.org/images/entities/char_2009.gif) 3 (total flow 240 SCCM) at room temperature. Before the activity tests, pre-reduction was conducted at 773 K for 1 h under reaction conditions. The produced NH3 was dissolved into distilled water and was quantified using an ion chromatograph (IC-2001; Tosoh Corp.).
3 (total flow 240 SCCM) at room temperature. Before the activity tests, pre-reduction was conducted at 773 K for 1 h under reaction conditions. The produced NH3 was dissolved into distilled water and was quantified using an ion chromatograph (IC-2001; Tosoh Corp.).
2.5 X-ray photoelectron spectroscopy (XPS)
XPS measurements were performed using a Versa Probe II (Ulvac-Phi Inc.) with Al Kα as the X-ray source. The obtained binding energies were calibrated using C 1s assigned to C–H or C–C (284.8 eV). Samples (CeO2 and Ce0.9M0.1O2−δ) were pre-reduced in the same manner as activity tests before XPS measurements. The pre-treated samples were transported to the measurement system without exposure to air using a transfer vessel. The peak fittings were conducted using the Proctor–Sherwood–Shirley method.46,473. Results and discussion
3.1 Optimization of calculation models
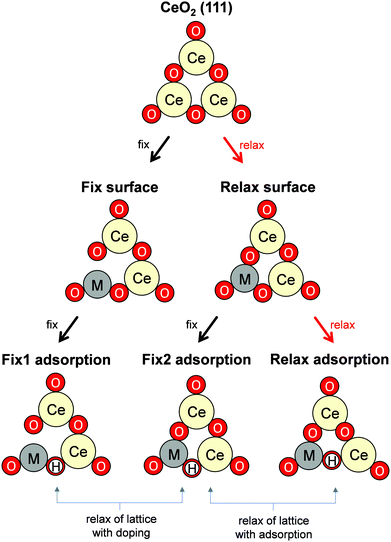
Governing factors of the adsorption energies over the doped surface were investigated using the calculation flows presented in Fig. 1. Here, surfaces of two types and hydrogen adsorption energies of three types were considered. First, structures of the CeO2(111) slab were optimized. Then, a ‘Fix surface’ and ‘Relax surface’ with heterocations were constructed. All possible arrangements of heterocations were considered similarly to our earlier study.20 The arrangements which exhibited the smallest total energies were applied to the next step. Fig. 2 portrays the obtained dopant distribution. Quadrivalent cations (Hf: 0.83 Å, Zr: 0.84 Å) and large cations with other valences (La: 1.16 Å, Sr: 1.26 Å, Ba: 1.42 Å) tend to separate from one another. Additionally, small divalent (Ca: 1.12 Å) or trivalent cations (Al: 0.54 Å, Ga: 0.62 Å, Sc: 0.87 Å, Y: 1.02 Å) favourably adjoin. The smaller the ionic radius of a heterocation, the more likely it is to cause lattice shrinkage on the CeO2 surface. To mitigate this shrinkage, small cations need to be placed next to each other. In contrast, heterocations with large ionic radii push away surrounding atoms. To relax this distortion, the cations with larger ionic radii must exist apart from each other. It was also empirically known that the solubility of heterocations depends on ionic radii.48 The heterocations with lower valences also cause lattice distortion because of the change in the number of bonds allowed by the cations. Hence, the valence also affects the distribution of heterocations. In the CeO2 matrix, Ce ions exist as quadrivalent cations. Therefore, as the next step, divalent or trivalent cation doping can be expected to induce voluntary oxygen vacancy formation. It is known that localized electron holes are formed on the lattice oxygen when metal oxides are doped with lower valence cations.49–51 The formation of electron holes by doping with lower valent cations and the compensation of the holes by the formation of oxygen vacancies were elucidated in our previous works.20 We examined all arrangements of oxygen vacancy at the surface and sub-surface. The sites which show the smallest oxygen vacancy formation energies were taken over for the following calculations. The obtained oxygen vacancy formation energies are presented in Table S3 (ESI†). Aside from Al-doping, the oxygen formation for charge compensation was an exothermic reaction. Peroxide (O22−) was specifically formed; it compensated the charge difference as for Al-doped CeO2(111).20 The obtained surfaces are depicted in Fig. 2. Those surfaces are the structure of the ‘Relax surface’ presented in Fig. 1. As the next step, the ‘Fix surface’ was constructed. Here, two of Ce were replaced by heterocations and oxygen vacancies for charge compensation were arranged (peroxide was placed over CeO2 with Al). Then, the dopant position was optimized solely, although the other atoms were fixed. Dopants and oxygen vacancy were arranged along with the ‘Relax surface’ presented in Fig. 1. The obtained models of the ‘Fix surface’ are shown in Fig. S3 (ESI†). After that, H atom adsorptions of three types (‘Fix 1 adsorption’, ‘Fix 2 adsorption’ and ‘Relax adsorption’) were investigated using the ‘Fix surface’ and ‘Relax surface’. ‘Fix surface’ was applied to the calculations of ‘Fix 1 adsorption’. Only the adsorbed H atoms were relaxed in this calculation. In addition, the calculations of ‘Fix 2 adsorption’ and ‘Relax adsorption’ were conducted over the ‘Relax surface’. Regarding ‘Fix 2 adsorption’, only H atom was relaxed. The surfaces were optimized for the calculation of ‘Relax adsorption’. Comparison between ‘Fix 1 adsorption’ and ‘Fix 2 adsorption’ shed light on the effects of lattice constraint caused by heterocation-doping. Furthermore, the difference between ‘Fix 2 adsorption’ and ‘Relax adsorption’ shows us doping effects on surface distortion along with H atom adsorption.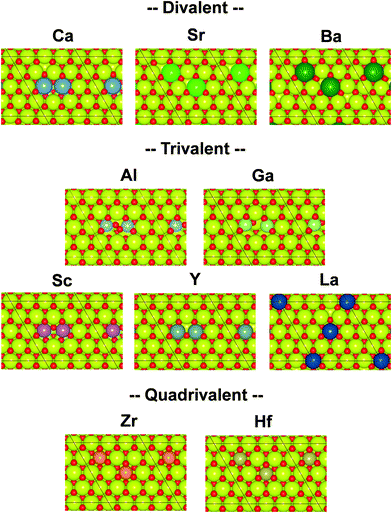 | ||
| Fig. 2 Top view of the DFT-optimized heterocation-doped CeO2(111) surface with oxygen vacancy for charge compensation (‘Relax surface’ in Fig. 1). Yellow denotes Ce. Red denotes oxygen. Others represent dopants. | ||
3.2 Doping effects on H atom adsorption
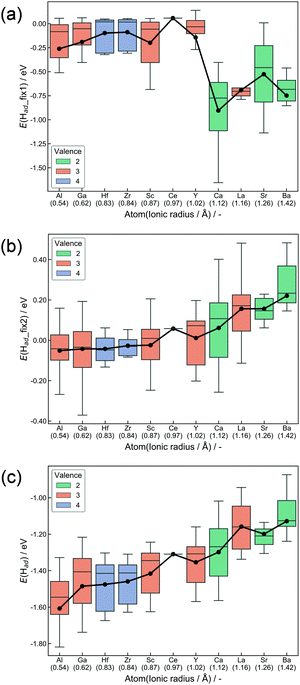
H atoms preferably adsorb at the surface oxygen of CeO2, where they exist as H+.52 Adsorption at all surface oxygens was considered for all doping models. Fig. 3 presents box plots of adsorption energies. The expression of E(Had) denotes adsorption energies of ‘Relax adsorption’, whereas E(Had_fix1) and E(Had_fix2), respectively, represent adsorption energies for ‘Fix 1 adsorption’ and ‘Fix 2 adsorption’. Adsorption energies (Ead) are calculated as eqn (1).| Ead = E(slab with H) − E(slab without H) − 1/2E(H2) | (1) |
Hereinafter, E(slab with H) and E(slab without H), respectively, denote energy values of the slab with and without adsorbed H atoms. E(H2) represents the energy of gaseous H2. Hence, the energy of H–H bond cleavage is included into the calculated Ead. However, it is constant among all surfaces. Hence, the energy of H–H bond cleavage does not affect the trends of adsorption energies. Boxes in Fig. 3 are colored along with dopant valences. Black plots show average adsorption values. The box arrangement is determined by the ionic radius of dopants. The DFT calculations elucidated the importance of ionic radius and valence. First, results in ‘Fix 1 adsorption’ (Fig. 3(a)) showed strong binding of H atoms over the divalent-cation-doped surfaces. The second was trivalent-cation-doped surfaces. The third was quadrivalent. The electron donation from cations to adjacent Olat decreases as the dopant valence becomes smaller when the dopants are placed forcibly into the metal oxide matrix suitable for higher valence cations. Accordingly, doping of lower valence cations results in the formation of Lewis acid sites.53,54 Then, the H atom was anchored strongly over the divalent-cation-doped surfaces. Lattice relaxation of two types evidently changed this trend. The former is the change from ‘Fix 1 adsorption’ to ‘Fix 2 adsorption’, and the latter is from ‘Fix 2 adsorption’ to ‘Relax adsorption’. Smaller cation doping positively influences the H2 dissociative adsorption as for both ‘Fix 2 adsorption’ and ‘Relax adsorption’. The first reason is the change of Olat charge induced by lattice distortion after doping. The Ce valence after oxygen vacancy formation depends on the Ce–O bond length.55 Therefore, we can assume that Ce–O bond expansion makes Olat electron deficient. In contrast, the Ce–O bond shrinkage makes the Olat electron-rich. Large cations pushed the surrounding oxygen away, signaling shrinkage of the Ce–O bond as summarized in Fig. S4 (ESI†). As a result, the Lewis acidity derived from the difference of valence was moderated by the shrinkage. This moderation became smaller with the decrement in the dopant ionic radius. The change in the charge of Olat by heterocation-doping and lattice distortion is summarized in Fig. S5–S10 (ESI†). In terms of ‘Relax adsorption’, the smaller cation-doped surface became more favourable sites for H atom adsorption. The difference between ‘Fix 2 adsorption’ and ‘Relax adsorption’ exhibited effects of lattice distortion during H2 dissociative adsorption. A smaller cation-doped surface can take various relaxation patterns that are suitable for the acceptance of H atoms because of the spatial margin. In contrast, larger cations hinder the reconstruction of the surface along with adsorption. It means that the flexibility of the CeO2 matrix related to H atom adsorption is an important factor for controlling adsorption energies. For this reason, H2 dissociative adsorption over CeO2 is facilitated by doping with small ionic radii. The salient results of DFT calculations are presented below.
(1) Lower-valency dopant addition without lattice relaxation produces Lewis acid sites.
(2) The Lewis acidity above is alleviated by lattice relaxation when the ionic radius of dopants is large.
(3) The flexibility of the CeO2 matrix was enhanced by dopants with smaller ionic radius, leading to the strong adsorption of H atoms.
3.3 Evaluation of OH amount using XPS
The effect of doping on H2 dissociative adsorption was experimentally confirmed using XPS measurements. Fig. S14 and S15 (ESI†) represent the C 1s and O 1s spectrum of pre-reduced CeO2 and Ce0.9M0.1O2−δ (M: Sr, Al, Y, and Zr). Following the shape of differentiated spectra, the C 1s and O 1s spectra were decomposed into three and two components. The peaks around 285, 286 and 289 eV in C 1s spectra can be, respectively, assigned to C–C or C–H, C–O and O–C![[double bond, length as m-dash]](https://www.rsc.org/images/entities/char_e001.gif) O.56,57 Also, the peaks around 528 and 530 eV in O 1s spectra can be assigned to Olat and O–H or C–O or O–C
O.56,57 Also, the peaks around 528 and 530 eV in O 1s spectra can be assigned to Olat and O–H or C–O or O–C![[double bond, length as m-dash]](https://www.rsc.org/images/entities/char_e001.gif) O, respectively.57–59 Then, the OH ratio over each sample was calculated as follows:
O, respectively.57–59 Then, the OH ratio over each sample was calculated as follows: | (2) |
Here, RSFx (x = O 1s, C 1s) denotes a relative sensitivity factor reported by Ulvac-Phi Inc. Fig. 4 shows the correlation between OH ratios from XPS measurements and averages of E(Had) from DFT calculations using the ‘Relax adsorption’ model. Consequently, a clear correlation between experimental values and DFT calculated energies was confirmed, indicating the validity of the DFT calculation results.
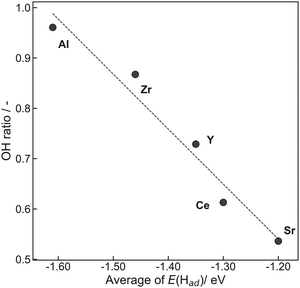 | ||
| Fig. 4 Correlation between OH ratios obtained from XPS measurements and averages of E(Had) obtained from DFT calculations using the ‘Relax adsorption’ model. | ||
3.4 Doping effects on the surface protonics and NH3 synthesis in the electric field
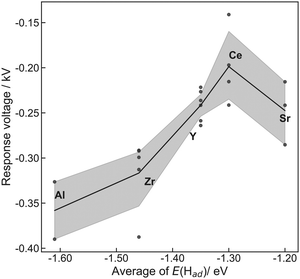
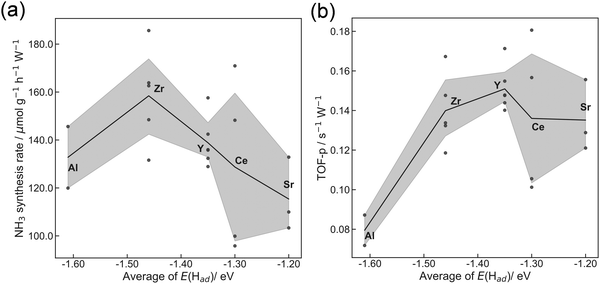
The former sections described that we could control the H atom adsorption over CeO2-based materials by the dopant valence and ionic radius. Therefore, we evaluated an actual effect of H2 dissociative adsorption energy on surface protonics and NH3 synthesis in the electric field. First, 6 mA constant direct current was applied to 5 wt%Fe/CeO2 and 5 wt%Fe/Ce0.9M0.1O2−δ (M: Sr, Al, Y and Zr). Consequently, the response voltages increased as the average E(Had) decreased and encountered a limit at around −1.30 eV (Fig. 5). As reported elsewhere in the literature, H+ migrates over the metal oxide surface under an H2 atmosphere.60 Presumably, the high response voltage under constant direct current corresponds to the lower H+ conductivity over the metal oxide surface. Considering results of both DFT calculations (Fig. 3(c)) and experimentation (Fig. 4 and 5), we concluded that the larger cation doping decreased the H+ stability over the CeO2-based surface, leading to higher H+ mobility. In contrast, the excess decrease in the H+ stability causes a deficiency of H+. For that reason, the conductivity reached a limit at certain H atom adsorption energy even with high mobility of H+.Next, we evaluated the heterocation-doping effect on catalytic reactions involving surface protonics. NH3 synthesis in the electric field was used as a model reaction. Enhancement of the NH3 synthesis rate in a low-temperature region using the electric field has been reported.11–15 We obtained knowledge that NH3 synthesis in the electric field proceeds via the ‘associative mechanism’.1 The H+ over the support reacts with N2 over the loading metal. Therefore, the reaction rate depends strongly on the amount of metal atoms at the periphery. Moreover, H atom stability over supports is an important factor for controlling activity.13 The NH3 synthesis rate in the electric field can be a good indicator of heterocation-doping effects on H+ stability. Fig. 6 presents the apparent NH3 synthesis rate and turnover frequency at the periphery (intrinsic activity at each active site, TOF-p) per unit of applied power. The TOF-p per unit of applied power was calculated as presented below.
 | (3) |
Metal atoms at the perimeter were counted from the metal loading weight and mean particle sizes using the hemisphere approximation of the loading Fe particle structure. Volcano plots are presented for both apparent activity and intrinsic activity at each site (Fig. 6). This dependence is also explainable by H+ stability over the support, as considered in H+ conductivity (Fig. 5). When the H+ binds too strongly over supports, the reactivity is limited, but excessively loose binding of H+ engenders a decrement of reactants (H+ coverage over supports). This trade-off led to the volcano type relation between DFT calculated E(Had) and NH3 synthesis rate in the electric field. In this manner, key roles of H+ stability over CeO2-based materials on surface protonics and NH3 synthesis in the electric field were elucidated by virtue of guidance given by DFT calculations, as presented in Fig. 7. Based on our findings, the optimal dopant for NH3 synthesis in the electric field is expected to depend on temperature and H2 partial pressure as shown below. The effect of the decrease in H+ coverage is more pronounced under low H2 partial pressure, and high temperature. Hence, the doping of heterocations with a small ionic radius (e.g. Al) is optimal under such conditions. Conversely, the effect of the increase in H+ coverage becomes important when the H2 partial pressure is high, and the temperature is low. Therefore, heterocations with a large ionic radius (e.g. Ba) are the best dopants.
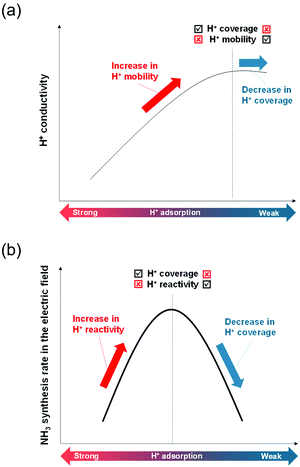 | ||
| Fig. 7 Schematic image of the correlation among H+ adsorption energy, and (a) H+ conductivity or (b) NH3 synthesis rate in the electric field. | ||
4. Conclusions
In summary, we clarified heterocation-doping effects on H2 dissociative adsorption over CeO2(111) using DFT calculations. DFT-calculated adsorption energy of three types (‘Fix 1 adsorption’, ‘Fix 2 adsorption’ and ‘Relax adsorption’) shed light on the influence of dopant valence and ionic radius distinguishably. A Lewis acid site was formed with lower valence heterocation-doping (‘Fix 1 adsorption’). However, CeO2 with lower valence dopants lost its acidity along with the lattice distortion caused by doping (‘Fix 2 adsorption’). This tendency was evident for dopants with larger ionic radii. Eventually, the addition of dopants with a small ionic radius led to strong binding of H atoms (‘Relax adsorption’). This strong adsorption resulted from the favourable lattice distortion during H2 dissociative adsorption. Furthermore, the important role of H atom stability on surface protonics and NH3 synthesis in the electric field was confirmed experimentally. The balance of H+ reactivity (mobility) and H+ coverage was fundamentally important for high H+ conductivity and catalysis involving surface protonics. Those insights for H atom adsorption over CeO2-based materials are important not only for catalytic reactions involving hydrogen subtraction and migration (hydrogen spillover and surface protonics), but also for electrochemical devices such as fuel cells and sensors.Conflicts of interest
There are no conflicts to declare.Acknowledgements
We gratefully appreciate support received from JST MIRAI and use of the supercomputer system at the Information Initiative Center at Hokkaido University.References
- K. Murakami and Y. Sekine, Phys. Chem. Chem. Phys., 2020, 22, 22852–22863 RSC.
- L. Kuai, Z. Chen, S. Liu, E. Kan, N. Yu, Y. Ren, C. Fang, X. Li, Y. Li and B. Geng, Nat. Commun., 2020, 11, 48 CrossRef.
- S. Campisi, C. E. Chan-Thaw, L. E. Chinhilla, A. Chutia, G. A. Botton, K. M. H. Mohammed, N. Dimitratos, P. P. Wells and A. Villa, ACS Catal., 2020, 10, 5483–5492 CrossRef CAS.
- X. Xue, J. Liu, D. Rao, S. Xu, W. Bing, B. Wang, S. He and M. Wei, Catal. Sci. Technol., 2017, 7, 650–657 RSC.
- T. Franken, J. Terreni, A. Borgschulte and A. Heel, J. Catal., 2020, 382, 385–394 CrossRef CAS.
- S. K. Beaumont, S. Alayoglu, C. Specht, N. Kruse and G. A. Somorjai, Nano Lett., 2014, 14(8), 4792–4796 CrossRef CAS.
- Y. Guo, S. Mei, K. Yuan, D.-J. Wang, H.-C. Liu, C.-H. Yan and Y. W. Zhang, ACS Catal., 2018, 8, 6203–6215 CrossRef CAS.
- S. Wu, Y.-K. Peng, T.-Y. Chen, J. Mo, A. Large, I. McPherson, H.-L. Chou, I. Willkinson, F. Venturini, D. Grinter, P. F. Escorihuela, G. Held and S. C. E. Tsang, ACS Catal., 2020, 10, 5614–5622 CrossRef CAS.
- M. Torimoto, K. Murakami and Y. Sekine, Bull. Chem. Soc. Jpn., 2019, 92(10), 1785–1792 CrossRef CAS.
- Y. Sekine and R. Manabe, Faraday Discuss. 10.1039/C9FD00129H.
- R. Manabe, H. Nakatsubo, A. Gondo, K. Murakami, S. Ogo, H. Tsuneki, M. Ikeda, A. Ishikawa, H. Nakai and Y. Sekine, Chem. Sci., 2017, 8, 5434–5439 RSC.
- K. Murakami, R. Manabe, H. Nakatsubo, T. Yabe, S. Ogo and Y. Sekine, Catal. Today, 2018, 303, 271–275 CrossRef CAS.
- K. Murakami, Y. Tanaka, S. Hayashi, R. Sakai, Y. Hisai, Y. Mizutani, A. Ishikawa, T. Higo, S. Ogo, J. G. Seo, H. Tsuneki, H. Nakai and Y. Sekine, J. Chem. Phys., 2019, 151, 064708 CrossRef.
- K. Murakami, Y. Tanaka, R. Sakai, K. Toko, K. Ito, A. Ishikawa, T. Higo, T. Yabe, S. Ogo, M. Ikeda, H. Tsuneki, H. Nakai and Y. Sekine, Catal. Today, 2020, 351, 119–124 CrossRef CAS.
- K. Murakami, Y. Tanaka, R. Sakai, Y. Hisai, S. Hayashi, Y. Mizutani, T. Higo, S. Ogo, J. G. Seo, H. Tsuneki and Y. Sekine, Chem. Commun., 2020, 56, 3365–3368 RSC.
- K. Takise, A. Sato, K. Murakami, S. Ogo, J. G. Seo, K. Imagawa, S. Kado and Y. Sekine, RSC Adv., 2019, 9, 5918–5924 RSC.
- R. Manabe, S. Okada, R. Inagaki, K. Oshima, S. Ogo and Y. Sekine, Sci. Rep., 2016, 6, 38007 CrossRef CAS.
- A. Takahashi, R. Inagaki, M. Torimoto, Y. Hisai, T. Matsuda, Q. Ma, J. G. Seo, T. Higo, H. Tsuneki, S. Ogo, T. Norby and Y. Sekine, RSC Adv., 2020, 10, 14487–14492 RSC.
- K. Toko, K. Ito, H. Saito, Y. Hosono, K. Murakami, S. Misaki, T. Higo, S. Ogo, H. Tsuneki, S. Maeda, K. Hashimoto, H. Nakai and Y. Sekine, J. Phys. Chem. C, 2020, 124(19), 10462–10469 CrossRef CAS.
- K. Murakami, S. Ogo, A. Ishikawa, Y. Takeno, T. Higo, H. Tsuneki, H. Nakai and Y. Sekine, J. Chem. Phys., 2020, 152, 014707 CrossRef CAS.
- W. Zhang, M. Pu and M. Lei, Langmuir, 2020, 36, 5891–5901 CrossRef CAS.
- M. D. Krcha, A. D. Mayernick and M. J. Janik, J. Catal., 2012, 293, 103–115 CrossRef CAS.
- J. J. Carey and M. Nolan, J. Catal., 2016, 6, 3544–3558 CAS.
- T. Montini, M. Melchionna, M. Monai and P. Fornasiero, Chem. Rev., 2016, 116(10), 5987–6041 CrossRef CAS.
- M. Shirpour, G. Gregori, R. Merkle and J. Maier, Phys. Chem. Chem. Phys., 2011, 13, 937–940 RSC.
- G. Gregori, M. Shirpour and J. Maier, Adv. Funct. Mater., 2013, 23, 5861–5867 CrossRef CAS.
- R. Manabe, S. Stub, T. Norby and Y. Sekine, Solid State Commun., 2018, 270, 45–49 CrossRef CAS.
- G. Kresse and J. Hafner, Phys. Rev. B: Condens. Matter Mater. Phys., 1993, 47, 558 CrossRef CAS.
- G. Kresse and J. Hafner, Phys. Rev. B: Condens. Matter Mater. Phys., 1994, 49, 14251 CrossRef CAS.
- G. Kresse and J. Furthmüller, Comput. Mater. Sci., 1996, 6(1), 15–50 CrossRef CAS.
- G. Kresse and J. Furthmüller, Phys. Rev. B: Condens. Matter Mater. Phys., 1996, 54, 11169 CrossRef CAS.
- G. Kresse and D. Joubert, Phys. Rev. B: Condens. Matter Mater. Phys., 1999, 59, 1758 CrossRef CAS.
- J. P. Perdew, K. Burke and M. Ernzerhof, Phys. Rev. Lett., 1996, 77, 3865–3868 CrossRef CAS.
- H. J. Monkhorst and J. D. Pack, Phys. Rev. B: Condens. Matter Mater. Phys., 1976, 13, 5188–5192 CrossRef.
- S. Grimme, J. Antony, S. Ehrlich and S. Krieg, J. Chem. Phys., 2010, 132, 154104 CrossRef.
- M. D. Krcha, A. D. Mayernick and M. J. Janik, J. Catal., 2012, 293, 103–115 CrossRef CAS.
- H. T. Chen and J. G. Chang, J. Chem. Phys., 2010, 132, 214702 CrossRef.
- M. Nolan, J. Chem. Phys., 2009, 130, 144702 CrossRef.
- M. Nolan, J. Mater. Chem., 2011, 21, 9160–9168 RSC.
- M. Nolan, J. Phys. Chem. C, 2011, 115, 6671–6681 CrossRef CAS.
- Z. X. Yang, G. X. Luo, Z. S. Lu and K. Hermansson, J. Chem. Phys., 2007, 127, 074704 CrossRef.
- A. D. Mayernick and M. J. Janik, J. Phys. Chem. C, 2008, 112(38), 14955–14964 CrossRef CAS.
- M. B. Watkins, A. S. Foster and A. L. Shluger, J. Phys. Chem. C, 2007, 111(42), 15337–15341 CrossRef CAS.
- K. Momma and F. Izumi, J. Appl. Crystallogr., 2011, 44, 1272–1276 CrossRef CAS.
- R. Sakai, K. Murakami, Y. Mizutani, Y. Tanaka, S. Hayashi, A. Ishikawa, T. Higo, S. Ogo, H. Tsuneki, H. Nakai and Y. Sekine, ACS Omega, 2020, 5(12), 6846–6851 CrossRef CAS.
- D. A. Shirley, Phys. Rev. B: Condens. Matter Mater. Phys., 1972, 5(12), 4709 CrossRef.
- A. Proctor and P. M. A. Sherwood, Anal. Chem., 1982, 54(1), 13–19 CrossRef CAS.
- D.-J. Kim, J. Am. Ceram. Soc., 1989, 72(8), 1415–1421 CrossRef CAS.
- M. Nolan and G. W. Watson, Surf. Sci., 2005, 586(1–3), 25–37 CrossRef CAS.
- M. Nolan and G. W. Watson, J. Chem. Phys., 2006, 126, 144701 CrossRef.
- O. F. Schirmer, J. Phys.: Condens. Matter, 2006, 18, 667–704 CrossRef.
- M. G. Melchor and N. López, J. Phys. Chem. C, 2014, 118, 10921–10926 CrossRef.
- Z. Hu, B. Li, X. Y. Sun and H. Metiu, J. Phys. Chem. C, 2011, 115, 3065–3074 CrossRef CAS.
- E. W. McFarland and H. Metiu, Chem. Rev., 2013, 113, 4391–4427 CrossRef CAS.
- H.-Y. Li, H.-F. Wang, X.-Q. Gong, Y.-L. Guo, Y. Guo, G. Lu and P. Hu, Phys. Rev. B: Condens. Matter Mater. Phys., 2009, 79, 193401 CrossRef.
- M. Mantel and J. P. Wightman, Surf. Interface Anal., 1994, 21, 595–605 CrossRef CAS.
- E. McCafferty and J. P. Wightman, Surf. Interface Anal., 1998, 26, 549–564 CrossRef CAS.
- J. T. Newberg, D. E. Starr, S. Yamamoto, S. Kaya, T. Kendelewicz, E. R. Mysak, S. Porsgaard, M. B. Salmeron, G. E. Brown Jr., A. Nilsson and H. Bluhm, Surf. Sci., 2011, 605, 89–94 CrossRef CAS.
- G. P. López, D. G. Castner and B. D. Ratner, Surf. Interface Anal., 1991, 17, 267–272 CrossRef.
- Y. Hisai, K. Murakami, Y. Kamite, Q. Ma, E. Vøllestad, R. Manabe, T. Matsuda, S. Ogo, T. Norby and Y. Sekine, Chem. Commun., 2020, 56, 2699–2702 RSC.
Footnote |
| † Electronic supplementary information (ESI) available. See DOI: 10.1039/d0cp05752e |
| This journal is © the Owner Societies 2021 |

