
 Open Access Article
 This Open Access Article is licensed under a Creative Commons Attribution-Non Commercial 3.0 Unported Licence
Biological nanopores elucidate the differences between isomers of mercaptobenzoic-capped gold clusters
Bobby D.
Cox
 ,
Charles R.
Martin
,
Massimo F.
Bertino
and
Joseph E.
Reiner
*
,
Charles R.
Martin
,
Massimo F.
Bertino
and
Joseph E.
Reiner
*
Department of Physics, Virginia Commonwealth University, Richmond, VA 23284, USA. E-mail: jereiner@vcu.edu
First published on 22nd December 2020
Abstract
Identification of isomers using traditional mass spectroscopy methods has proven an interesting challenge due to their identical mass to charge ratios. This proves particularly consequential for gold clusters, as subtle variations in the ligand and cluster structure can have drastic effects on the cluster functionalization, solubility, and chemical properties. Biological nanopores have proven an effective tool in identifying subtle variations at the single molecule limit. This paper reports on the ability of an α-hemolysin (αHL) pore to differentiate between para-, meta-, and ortho- (p-, m-, and o-, respectively) mercaptobenzoic acid ligands attached to gold clusters at the single cluster limit. Detecting differences between p-MBA and m-MBA requires pH-dependent studies that illustrate the role inter-ligand binding plays in stabilizing m-MBA-capped clusters. Additionally, this paper investigates the difference in behavior for these clusters when isolated, and when surrounded by small ligand–Au complexes (AunLm, n = 0, 1, 2… and m = 1, 2,…) that are present following cluster synthesis. It is found that continuous exposure of clusters to freely diffusing ligand complexes stabilizes the clusters, while isolated clusters either disintegrate or exit the nanopore in seconds. This has implications for long term cluster stability.
I. Introduction
A large body of work shows that small aggregates (i.e. clusters, or, more recently, nano-clusters) of transition metals possess unique physical and chemical properties. Limiting the discussion to Au aggregates, a thorough review of these properties can be found in Kurashige's review on the subject.1 A large number of applications of these gold nanoclusters have been developed that include medical imaging,2,3 virus detection,4 and various applications in pharmacology.5While various applications of nanoclusters continue to motivate further development of this technology, it is worth noting that a considerable amount of recent work has focused on investigating the fundamental mechanisms of cluster dynamics. Specific examples of these dynamics-based cluster studies include etching reactions6,7 (i.e. excess thiols in the presence of gold nanoclusters yield a variety of differently shaped nanoclusters), ligand exchange8–13 (i.e. especially useful for derivatizing Au clusters for biological applications), heteroatom synthesis14–16 (i.e. Ag or Pd can be incorporated into pre-formed Au clusters for catalysis applications), alternate binding mechanisms17 and isomerization effects (i.e. nanocluster modifications with various ligand isomers to tune both the optical and catalytic properties). These studies help further develop cluster applications as they provide a deeper insight into the interactions at play within the clusters themselves. For example, Kornberg's group studied the relative abundance of COOH–Au binding with respect to Au–S bonds in m-MBA capped gold clusters and found that Au144 particles contain only 40 ligands instead of the expected 60.18 It was proposed that the relative weakness of the COOH–Au binding (compared to the Au–S bond) might give rise to an equilibrium situation where the underlying Au atoms remain unprotected and exposed to the ambient environment for a considerable amount of time. This dynamic picture suggests the possibility of catalytic applications via the exposed portions of the cluster surface.
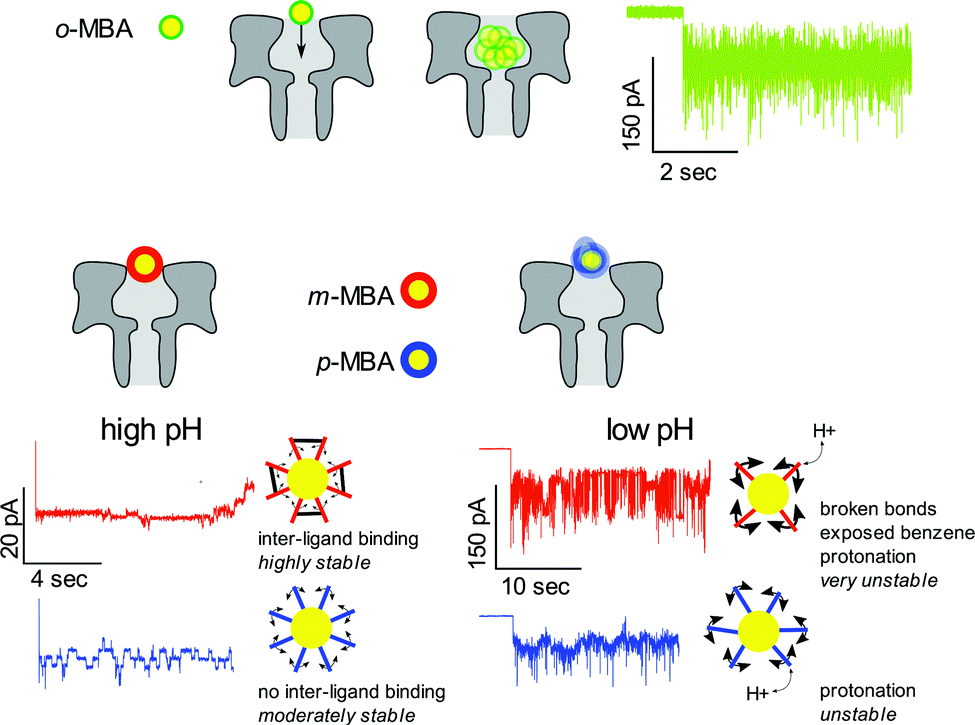
The importance of alternate binding mechanisms in cluster dynamics is receiving growing attention, which includes a particular emphasis on thiolate ligands, specifically the notion that Au–S bonds may not be the exclusive mechanism driving the formation of thiolate-capped gold clusters, but, additionally, weaker hydrogen-like bonds could play a role as well.17,19 More recent work by the Häkkinen group has expanded on this with robust simulations of alternative bonding methods.20 For instance, one common gold capping agent, para-mercaptobenzoic acid (p-MBA), is a relatively simple molecule consisting of a thiolate, a benzene ring, and a carboxyl group with isomers m-MBA and o-MBA (meta- and ortho-, respectively). In addition to the Au–S bonds, Au atoms can also form bonds with both the carboxylic group and the π orbital of the benzene ring. Fig. 1 showcases the chemical structure and interactions implied by the Häkkinen studies, where adjacent m-MBA ligands can form weak hydrogen bonds between their carboxyl groups, and o-MBA can exhibit binding between the carboxyl group and exposed portions of the gold surface.
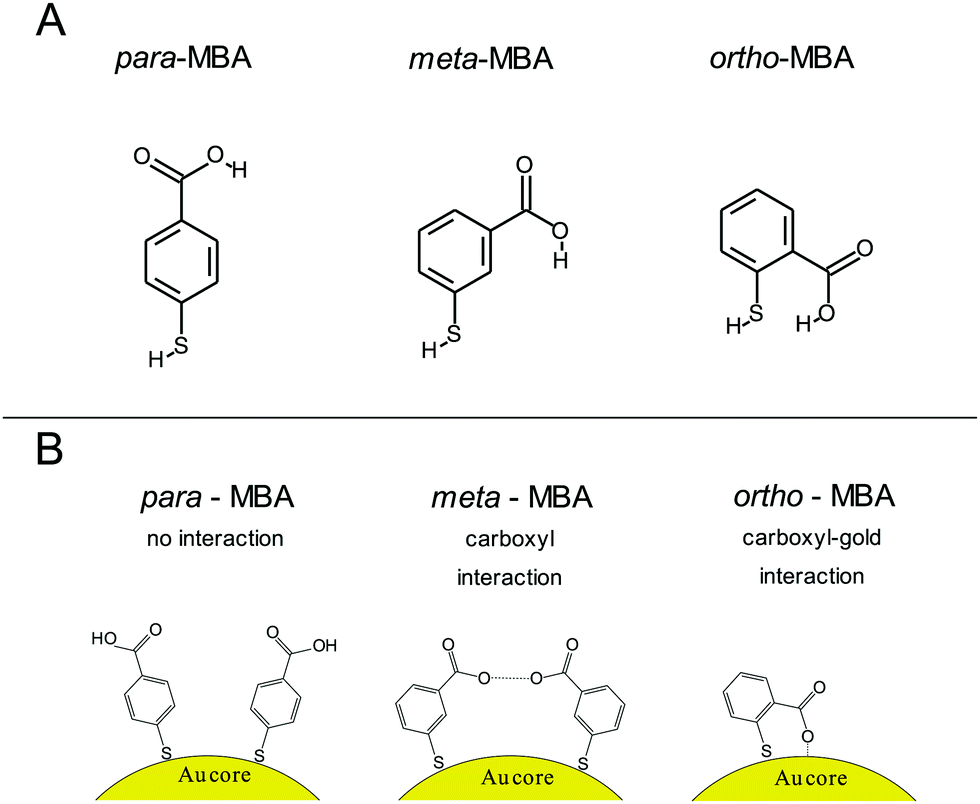 | ||
| Fig. 1 Illustration of the ligands and interactions under consideration. (A) Chemical structure diagram of the three ligands para-, meta-, and ortho-mercaptobenzoic acid (p-, m-, and o-MBA, respectively). (B) Schematic illustration of the p-MBA ligands, which show no inter-ligand interactions, m-MBA ligands, which could exhibit inter-ligand hydrogen bonding through adjacent carboxylic groups, and o-MBA-capped clusters, where the ligands can interact directly with the gold core and expose the benzene ring to the solvent. Each ligand arrangement leads to unique current signatures in the nanopore analysis that can be used to distinguish between the three isomeric ligands. | ||
Capping clusters with different ligand isomers can lead to differences through modified binding mechanisms and this in turn can affect the physical, optical and electronic properties of the clusters.21,22 This suggests that characterizing differences between ligand isomers, and their pairwise interactions, could shed light on cluster properties and enable a better path towards cluster synthesis and design. However, given the identical mass and similar structure of isomer ligands, most standard cluster characterization techniques are limited in their ability to distinguish and characterize differences between clusters capped with ligand isomers. Nevertheless, recent reports23,24 have shown some differences between o-, m- and p-MBA capped gold clusters (isomeric effects). Specifically, it was found that while UV-vis absorption spectroscopy and 2-photon excitation fluorescence (TPEF) showed very few differences between these isomers, ESI-MS (electrospray ionization-mass spectrometry), IM-MS (ion-mobility-mass spectrometry) and CID (collision induced dissociation) analysis could be used to discriminate between these isomers. In particular, the CID data showed a clear isomeric effect in regards to the gas-phase cluster stability.23 More recently, this work was extended24 to study the differences between the charge distributions among the ligands and core for different isomers of MBA-capped Au25(MBA)18 clusters. Interestingly, they found differences in the cluster structure and charge repartition patterns among clusters with the same total charge. While these represent important advances, a characterization technique that informs one about ligand isomer effects in an aqueous environment would be beneficial for designing and optimizing water soluble clusters.
Resistive pulse nanopore sensing is a promising method for detecting and characterizing nanoclusters.25 This application of nanopore sensing has been used to improve DNA detection,26,27 probe ligand–amino acid interactions28 and detect differences between two isomers of polyoxometalate clusters.29 We have contributed to this development by noting that single molecule biological nanopore sensing using an α-hemolysin (αHL) pore provides a powerful tool for characterizing small metallic clusters at the single cluster limit for extended time periods and we have used this fact to characterize ligand-induced cluster structure fluctuations and to observe ligand exchange at the single cluster limit.30,31 In all these examples, αHL is an excellent pore for metallic cluster analysis in part because of the limited interactions between amino acid residues in the pore and the cluster ligands. In particular, it is worth noting that the salt bridges formed between the glutamic acid and lysine residues in the constriction region of the pore limit the possibility of cluster–pore interactions.28
Our work showed that the pore is capable of monitoring previously unknown discrete transitions between physical states whose properties were dependent on the ligand mass and type. We suggested that these transitions result from reorganization of the ligands on the surface of the cluster through either lateral diffusion along the surface or through ligand folding.30 The crucial result from that previous work was to show that studying nanopore-induced current fluctuations enables one to monitor the structural kinetics of isolated clusters. This was followed by a demonstration of ligand exchange at the single cluster limit.31 Although nanopore sensing requires the interaction of the cluster with the nanopore actuator, we believe that it still presents a promising technique to observe cluster dynamics in an aqueous, albeit nanoconfined, environment. This is mostly because ligand–pore interactions have been shown to be limited for wild-type αHL in near neutral pH conditions.28,30 In any case, our results represent a significant development in the area of cluster characterization and provide a unique tool for observing ligand-induced cluster dynamics.
In this paper we apply a nanopore-based methodology to investigate isomeric effects of isolated clusters. For this report, we studied gold clusters protected with ligand isomers of p-, m-, and o-MBA. The physical state transitions previously reported by us for p-MBA were investigated for all three isomers and it was found that the resulting current signatures can be used to distinguish between each of the three ligand types. In particular, we found that varying the solution pH leads to clear differences between these ligands and yields a better understanding of the role that inter-ligand and ligand–cluster interactions play in the cluster dynamics in the nanoconfined aqueous state. As a further demonstration of the advantage of nanopore sensing, we also report on our ability to compare individual cluster nanopore residence times when surrounded by Au–ligand complexes present following cluster synthesis and a ligand-free environment. This shows that the nanopore measurements can illustrate the connection between the cluster stability and surrounding Au–MBA complex concentration.
II. Materials and methods
Nanoparticle synthesis
All chemicals were purchased from Sigma-Aldrich and used as received unless otherwise noted. Particle synthesis was done using the reduction of potassium gold(III) chloride (KAuCl4) in the presence of the desired ligand capping agent (p, m, and o-MBA) using a borane tert-butylamine complex (BTBC).32 The desired ligand and KAuCl4 were dissolved in separate vials of methanol at equal concentrations and then mixed and vortexed for ca. 30 seconds. A solution of BTBC in methanol was added to the ligand gold complex solution and vigorously shaken for ca. 2 minutes before being sonicated for 30 minutes, during which the solution turned dark brown, indicating formation of nanoparticles. The final concentrations of KAuCl4, the MBA ligand, and the BTBC were 1![[thin space (1/6-em)]](https://www.rsc.org/images/entities/char_2009.gif) :1:5 mM, respectively. The ligand capped particle solution, in methanol, was evaporated under an ambient atmosphere overnight and rehydrated in deionized water. We have analyzed our cluster mixtures with two different mass spectrometers (LTQ-Orbitrap Velos, ThermoFisher Scientific, and TripleTOF 5600 +, Sciex LLC), and found that the spectra are dominated by small Au–ligand complexes. No clusters or cluster fragments in the size range expected for our nanopore measurements (i.e. Au25–Au40) were detected, most likely because these cluster masses are higher than the m/z range of these instruments ((m/z)LTQ < 4000, (m/z)TripleTOF < 5000). Nevertheless, we have previously established that the nanopore serves as a size filter that rejects particles larger than the pore opening of around 3 nm, and therefore we did not perform further size limiting steps for the results reported herein.23 We recognize that this may introduce polydispersity in our results, which we have attempted to address through sample averaging and reporting of the corresponding error bars.
:1:5 mM, respectively. The ligand capped particle solution, in methanol, was evaporated under an ambient atmosphere overnight and rehydrated in deionized water. We have analyzed our cluster mixtures with two different mass spectrometers (LTQ-Orbitrap Velos, ThermoFisher Scientific, and TripleTOF 5600 +, Sciex LLC), and found that the spectra are dominated by small Au–ligand complexes. No clusters or cluster fragments in the size range expected for our nanopore measurements (i.e. Au25–Au40) were detected, most likely because these cluster masses are higher than the m/z range of these instruments ((m/z)LTQ < 4000, (m/z)TripleTOF < 5000). Nevertheless, we have previously established that the nanopore serves as a size filter that rejects particles larger than the pore opening of around 3 nm, and therefore we did not perform further size limiting steps for the results reported herein.23 We recognize that this may introduce polydispersity in our results, which we have attempted to address through sample averaging and reporting of the corresponding error bars.
Pore sensing
Experiments were carried out with standard techniques and protocols for single αHL nanopore sensing, which can be found elsewhere,30,31 but will be briefly described here. An unsupported horizontal DPhy:PC (Avanti Polar Lipids, Alabaster, AL) bilipid membrane was formed across a 50 μm hole preformed in a 20 μm thick PTFE (Teflon) partition sheet (Eastern Scientific LLC, Rockville, MD) in an electrolyte solution (3 M KCl, 10 mM TRIS at various pH adjusted with citric acid and KOH) by a modified painting method.33 A single αHL channel (List Biological Laboratories, Inc., Campbell, CA) was inserted into the bilipid membrane and confirmed using the known single channel conductance and rectification of αHL pores.34A particle ejection protocol was used in order to ensure that current blockades originated from desired clusters and not contamination from secondary clusters. A 1:4 nanoparticle:electrolyte solution was backloaded into a micropipette tip formed by a borosilicate capillary (OD = 1.0 mm and ID = 0.78 mm). The pipette was formed using preset program #11 on a P-2000 laser-based pipette puller (Sutter Instruments, Novato, CA) to obtain a final ID of 1–2 μm. This pipette was positioned ca. 50 microns above the membrane and 20 microns to the left edge of the membrane near the cis-side of the pore. A transmembrane voltage was applied (Axopatch 200B, Molecular Devices, Carlsbad, CA) with ground held fixed on the cis-side of the membrane. A backing pressure of ca. 15 hPa (Femtojet, Eppendorf, Hauppauge, NY) was used to eject particles from the tip toward the pore. After a short time (on the order of tens of seconds) a rapid downward step in the current indicated the entry of a single cluster into the pore. While the cluster remains in the pore, the current is reduced by ca. 30% from its open pore level and the resulting fluctuations in the current result from cluster structure fluctuations as demonstrated previously.30 In the isolated cluster case, the backing pressure was immediately reduced to zero. This caused a backflow into the tip, removing the possibility of more particles or excess ligand left over from the synthesis entering the pore and/or interacting with the probed cluster. In the so-called “spray-on” case, the pump was not changed, and it was allowed to continue ejecting particles and leftover excess ligand complexes formed during synthesis. Because of the size and charge of the nanopore-confined cluster, as well as the time between captures, it was assumed that the remaining clusters sprayed from the pipette could not enter the pore when it was already occupied. We are confident that in this spray-on case, only excess ligand (and other small Aun(MBA)m complexes) could enter the pore with the already captured cluster, and any interactions with other sprayed clusters would be minimal. In both the isolated cluster and spray-on cases, the voltage difference was fixed across the membrane and the current was recorded until either the particle escaped from the pore, or, in the case of some clusters in the spray-on case, the voltage was reversed after several minutes to eject the cluster from the pore. An upward transition in current upon particle exit suggests that the particles usually exit the pore from the cis-side vestibule and do not translocate through the pore. Fig. 2 shows a schematic illustration of the experiment, along with a sample current trace of a single p-MBA-capped cluster residing in the pore. The discrete stepwise current fluctuations indicate structure fluctuations of the cluster while confined in the pore. These fluctuations are analyzed to characterize the cluster dynamics.
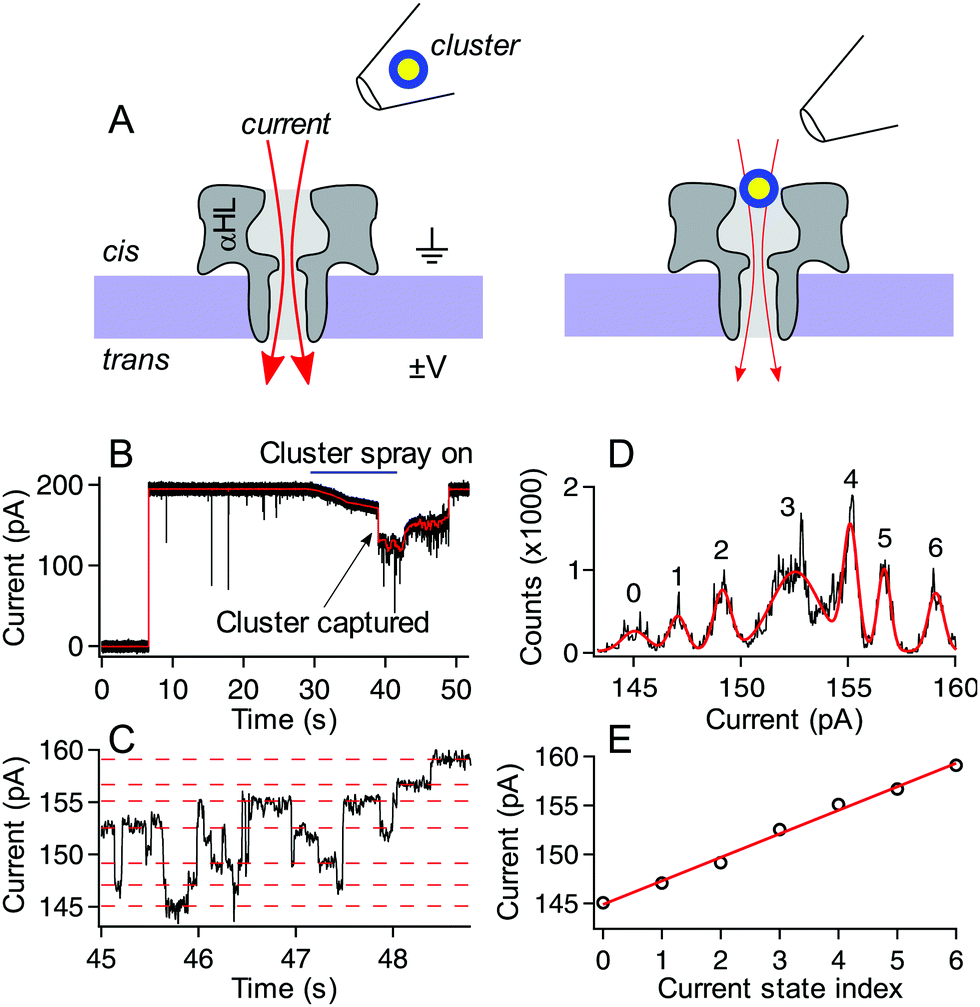 | ||
| Fig. 2 Schematic illustration of the experimental setup (not to scale) and typical current trace for a p-MBA capped gold cluster. (A, left) Ionic current (red arrows) flows through a single alpha hemolysin channel under the influence of an applied transmembrane potential. (A, right) After ejecting a cluster into the cis side chamber of the pore, the particle remains trapped for extended periods, which leads to a reduction in the ionic current. (B) A typical current trace for the capture of a p-MBA-capped cluster both unfiltered (black) and filtered with a 100 Hz low pass filter (red). Prior to applying the cluster spray the current remains in the steady open state. At ca. 30 s the pump is turned on and this leads to a slight reduction in the ionic current. At ca. 38 s a single cluster is captured in the pore and the particle tip is removed, which leads to an increase in the current. At ca. 48 s the particle hops out of the pore and the current returns to its original open state value. (C) The zoomed in view of the filtered current trace from part (B) shows the current transitions between well-defined states. (D) An all-points histogram of the current in part (C) shows that the well-defined states fit with a Gaussian mixture model (red) to extract the current state values. These states are highlighted with red dashed lines in part (C) and (E) plotted by state number where a linear least squares fit (red line) can be used to extract the magnitude of the current steps. The current steps have been shown to scale in magnitude with the mass of the capping ligand. For the data shown here the slope is (2.4 ± 0.1) pA, which is consistent with previously reported values.30 Data shown here was collected with a 70 mV applied transmembrane potential in 3M KCl at pH 8.0. | ||
Data analysis
Current traces were measured with a 10 kHz, four-pole, low-pass Bessel filter and digitally sampled at 50 kHz (Axopatch 200B, Digidata 1440A, Molecular Devices, Carlsbad, CA). Data were recorded as axon binary files (.abf) and stored for offline analysis. To observe the discrete current steps, we applied a fourth-order infinite impulse response (IIR) low-pass digital filter with the low-pass frequency set to 100 Hz. Autocorrelation analysis was performed by first isolating the current from the blockade portion of the data, calculating a histogram of this current and identifying the most likely current value (i.e. the peak of the near-normal distributed current fluctuations). The blockade current was then normalized with respect to this value so the current would exhibit fluctuations about a mean of ≈1. Circular boundary condition autocorrelation analysis was then performed on this normalized data. All-points histograms, digital filtering and autocorrelations were calculated and analyzed with IGOR 6.37 software (Wavemetrics, Portland, OR).III. Results and discussion
Distinguishing between different isomers
All three cluster types (o-, m-, and p-MBA) can be trapped within the sensing region of the pore for extended periods on the order of tens of seconds. As a result, studying the resulting current fluctuations allows one to distinguish between the o-, m- and p-MBA capped clusters. Fig. 3A–C show typical current traces for each of the trapped cluster types. For the m- and p-MBA clusters we can observe discrete changes in the blockade current. We have previously shown that these changes are related to ligand reorganization on the gold surface and they will be hereafter referred to as ‘current step transitions’. It is also worth noting that the m-MBA-capped clusters yield two distinct event types. The first type corresponds to ca. 35% of m-MBA captures, where the current traces are highly stable, and fluctuation-free. This indicates highly stable clusters that do not undergo structural changes in the pore volume. The remaining events yield current fluctuations with clearly resolvable steps indicative of less stable clusters undergoing structural fluctuations. One possible explanation for these two distinct fluctuation types is the polydisperse mixture of the clusters. Perhaps we see a second size particle enter the pore, although the fact that these blockades tend to fluctuate about similar means suggests otherwise. Nevertheless, a more complete discussion of the effects of size polydispersity can be found in our previous manuscript.30 The all-points histograms for the current traces are reported in Fig. 3D–F and the discrete peaks for m-MBA and p-MBA support the observation that these cluster types yield discrete current states. The mean current step size for the m-MBA and p-MBA clusters is (2.18 ± 0.06) pA and (2.35 ± 0.02) pA, respectively. The m-MBA value results from the weighted average of current step distributions for 9 distinct cluster events and the p-MBA value is reproduced from our earlier manuscript.30 The agreement between these two equal mass ligands is expected, but the slightly lower value for m-MBA may be attributed to the smaller volume exclusion as compared to p-MBA ligands. The current distributions for m-MBA and p-MBA are in stark contrast to the single, broad peak distribution for o-MBA, which results from rapid and random fluctuations.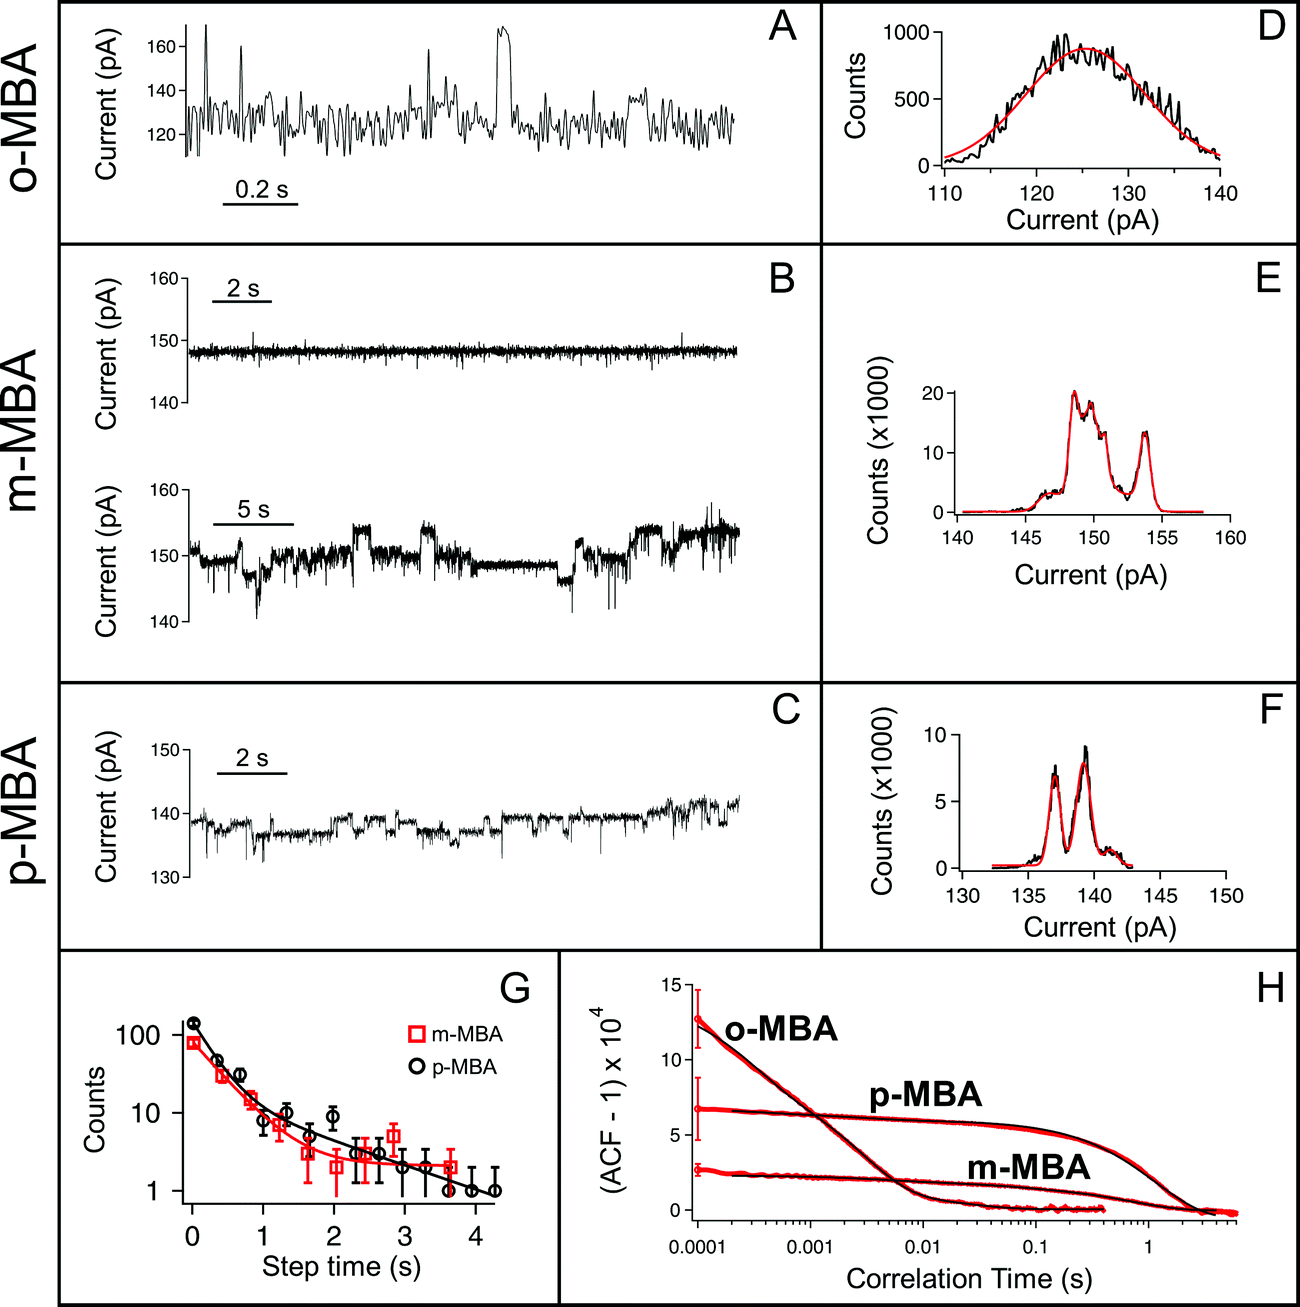 | ||
| Fig. 3 Nanopore-based current traces can distinguish between the different ligand isomers. (A–C) Typical current traces for o-, m-, and p-MBA capped clusters. (D–F) The corresponding all points current histograms (black line) and multipeak Gaussian fits (red line) show the onset of clear current states as one moves from o-MBA to m- and p-MBA. For the case of o-MBA the fluctuations are rapid and it is difficult to distinguish between current states. The m- and p-MBA capped particles yield similar fluctuations, but we note that some of the traces for the m-MBA capped particles (∼35%) give rise to highly stable, fluctuation-free current traces. (G) To distinguish between the m- and p-MBA particles we plot step time distributions for m-MBA (red squares) and p-MBA (black circles) and find a two-time constant exponential behavior. The solid lines are least-squares fits with tfast = (0.41 ± 0.08) s and tslow = (168 ± 1) s for m-MBA and tfast = (0.27 ± 0.06) s and tslow = (1.4 ± 0.5) s for p-MBA. (H) To better distinguish between m- and p-MBA we show normalized autocorrelation functions (ACF) for each particle type. The solid black lines show least square fits of three-time exponential functions that give rise to similar values to the step time distributions. The time constants from each fit are as follows: o-MBA [(23.3 ± 0.1), (2.9 ± 0.1), (0.3 ± 0.1)] ms, m-MBA [(710 ± 1), (48.3 ± 0.1), (4.1 ± 0.1)] ms and p-MBA [(1150 ± 10), (2.9 ± 0.1), (0.3 ± 0.1)] ms. It is worth noting that the variances seen for m-MBA differ from p-MBA in a clear manner, which indicates that the p-MBA clusters give rise to noisier current traces than the m-MBA particles. The error bars in (H) show standard errors calculated from 10 different cluster results for each isomer. All data shown here were collected with a 70 mV applied transmembrane potential in 3 M KCl at pH 8.0. | ||
The goal here is to demonstrate that nanopore sensing can be used to distinguish between different isomers on the gold clusters. At first glance, the all-points histograms show differences between the o-MBA particles (a single peak) and the m- and p-MBA particles (multiple peaks). Additionally, the mean occupation time of the clusters in the pore is different between o-MBA and the other two cluster types. The m- and p-MBA clusters remain in the pore for extended periods of time ((25.7 ± 4.4) s and (20.8 ± 5.2) s, respectively), while the o-MBA clusters exit the pore 8 times faster ((3.6 ± 1.0) s). The reported uncertainties correspond to ±1 standard error with means calculated from n = 9, n = 19 and n = 23 cluster events for the o-, m-, and p-MBA cases, respectively. We believe that the large discrepancy for the o-MBA cluster lifetimes results in part from the carboxyl group of the o-MBA ligands facing inward toward the core (see Fig. 1). This configuration forces the hydrophobic part of the molecule to face the solvent and decreases the solubility, which leads to reduced stability in the nanoconfined region of the pore. It is also possible that this structure yields a slightly smaller cluster that can more easily translocate through the pore.
In addition to the o-MBA clusters spending less time in the pore, the noisier current fluctuations for o-MBA (compared with m- and p-MBA) provide a further means for distinguishing o-MBA-capped clusters. A number of possible explanations could explain the increased fluctuations for o-MBA particles, but we hypothesize that the formation of bonds between the carboxylic acid and Au (see Fig. 1) leads to a slight reduction in the overall size of the o-MBA capped clusters and this in turn causes these clusters to fit more easily down into the vestibule region of the pore,35 where ligand reorganization would be harder to elucidate due to the fact that the cluster's Brownian dynamics will dominate and any current changes associated with ligand fluctuations on the cluster surface would become undetectable.
Regardless of the mechanisms driving the o-MBA-induced current fluctuations and reduced pore lifetimes, the nanopore can clearly distinguish these clusters from the p- and m-MBA-capped particles. Distinguishing between the p- and m-MBA-capped clusters requires more complex analysis of the current fluctuations. Unlike the o-MBA case, current step transitions are clearly visible for the p-MBA and m-MBA particles, and this motivates our attempt to distinguish between these two particle types by comparing their current step-time distributions (i.e. the distribution of times between discrete current transitions). Fig. 3G shows the step time distributions for p-MBA and m-MBA along with least squares fits to these distributions with double exponential functions (A1exp(−t/tfast) + A2exp(−t/tslow)). The resulting fit parameters (tfast,m-MBA = (0.41 ± 0.08) s, tslow,m-MBA = (170 ± 1) s, tfast,p-MBA = (0.27 ± 0.06) s and tslow,p-MBA = (1.4 ± 0.5) s) show that the p-MBA capped clusters exhibit more rapid current steps, which provides a more subtle metric for distinguishing between the m- and p-MBA capped clusters.
While the step time distributions show slight differences between the p- and m-MBA-capped clusters, clearly distinguishing between these two species requires an even more sensitive analytical tool. To do this we utilized normalized autocorrelation analysis (i.e. g(2)(τ) = 〈I(t)I(t + τ)〉/〈I(t)〉2, where I is the current and the brackets represent a time average) to enable a clear extraction of both the magnitude of the current noise and the fluctuation kinetics from the observed current traces. The results are presented in Fig. 3H, which shows averaged autocorrelation functions for each cluster type. The differences between all three cluster types become more easily distinguishable when viewed through the autocorrelation function. The rapid fluctuations from o-MBA yield a more rapid correlation decay, while similar kinetics are present for m-MBA and p-MBA (as expected given the residence time distributions shown in Fig. 3G). However, unlike the residence time distributions, the autocorrelation functions can more easily distinguish between m-MBA and p-MBA because the p-MBA fluctuations exhibit larger variance (greater noise) as evidenced by the greater g(2)(0) value. These results most likely arise from differences in inter-ligand interactions on the cluster surface. Modifying the solution pH will affect these interactions via protonation of the carboxyl groups on each ligand. This motivates our decision to perform pH dependent analysis on the clusters to further elucidate differences between the m- and p-MBA clusters and to better understand the role that inter-ligand interactions may play in the nanopore current signatures.
pH dependent fluctuations
The ability to distinguish current fluctuations between the p- and m-MBA clusters results from the fact that the m-MBA clusters exhibit lower noise fluctuations at higher pH. We hypothesize that this most likely results from the increased stability induced by hydrogen bond formation between adjacent m-MBA ligands (see Fig. 1). Similar hydrogen bonding was previously reported by Wells et al.17 To confirm this, m-MBA capped particles were investigated using the nanopore system under various pH conditions to see if increasing [H+], which increases the number of protonated carboxyl groups on the m-MBA ligands, will reduce the number of ligand–ligand hydrogen bond formations, and destabilize the structural stability of the cluster. To verify this, we also analyzed the autocorrelation of the p-MBA-induced current traces. The idea here is that the p-MBA clusters will not form ligand–ligand bonds because the carboxyl groups on p-MBA point directly away from the cluster surface. Therefore, lowering the pH for the p-MBA clusters should lead to a less significant increase in the cluster fluctuations as compared to the m-MBA particles.Fig. 4 presents pH analysis of the m- and p-MBA clusters over a range of pH (7 to 5.5). It can be seen from the m-MBA current traces in Fig. 4A–D that, as the pH is lowered, the discrete nature of the current steps is washed out. This is most likely because of rapid protonation events similar to those previously observed for p-MBA-capped clusters30 and increasing structural fluctuations resulting from disrupted inter-ligand bonding. The corresponding all-points histograms of the 100 Hz filtered traces (Fig. 4E–H) illustrate this “washing out” of the current steps as the current distributions move away from clear discrete states towards broad distributions. To quantitatively assess these increasing fluctuations, we calculated the autocorrelation functions of the non-filtered current traces for the m-MBA capped particles as a function of pH in Fig. 4I, where it can be seen that decreasing the pH leads to a significant increase in the g2(0) values (i.e. current signal variance) and a reduction in the correlation decay times (i.e. more rapid fluctuations). This is expected if a greater concentration of protons does indeed disrupt the inter-ligand bonds and destabilize the m-MBA-capped clusters.
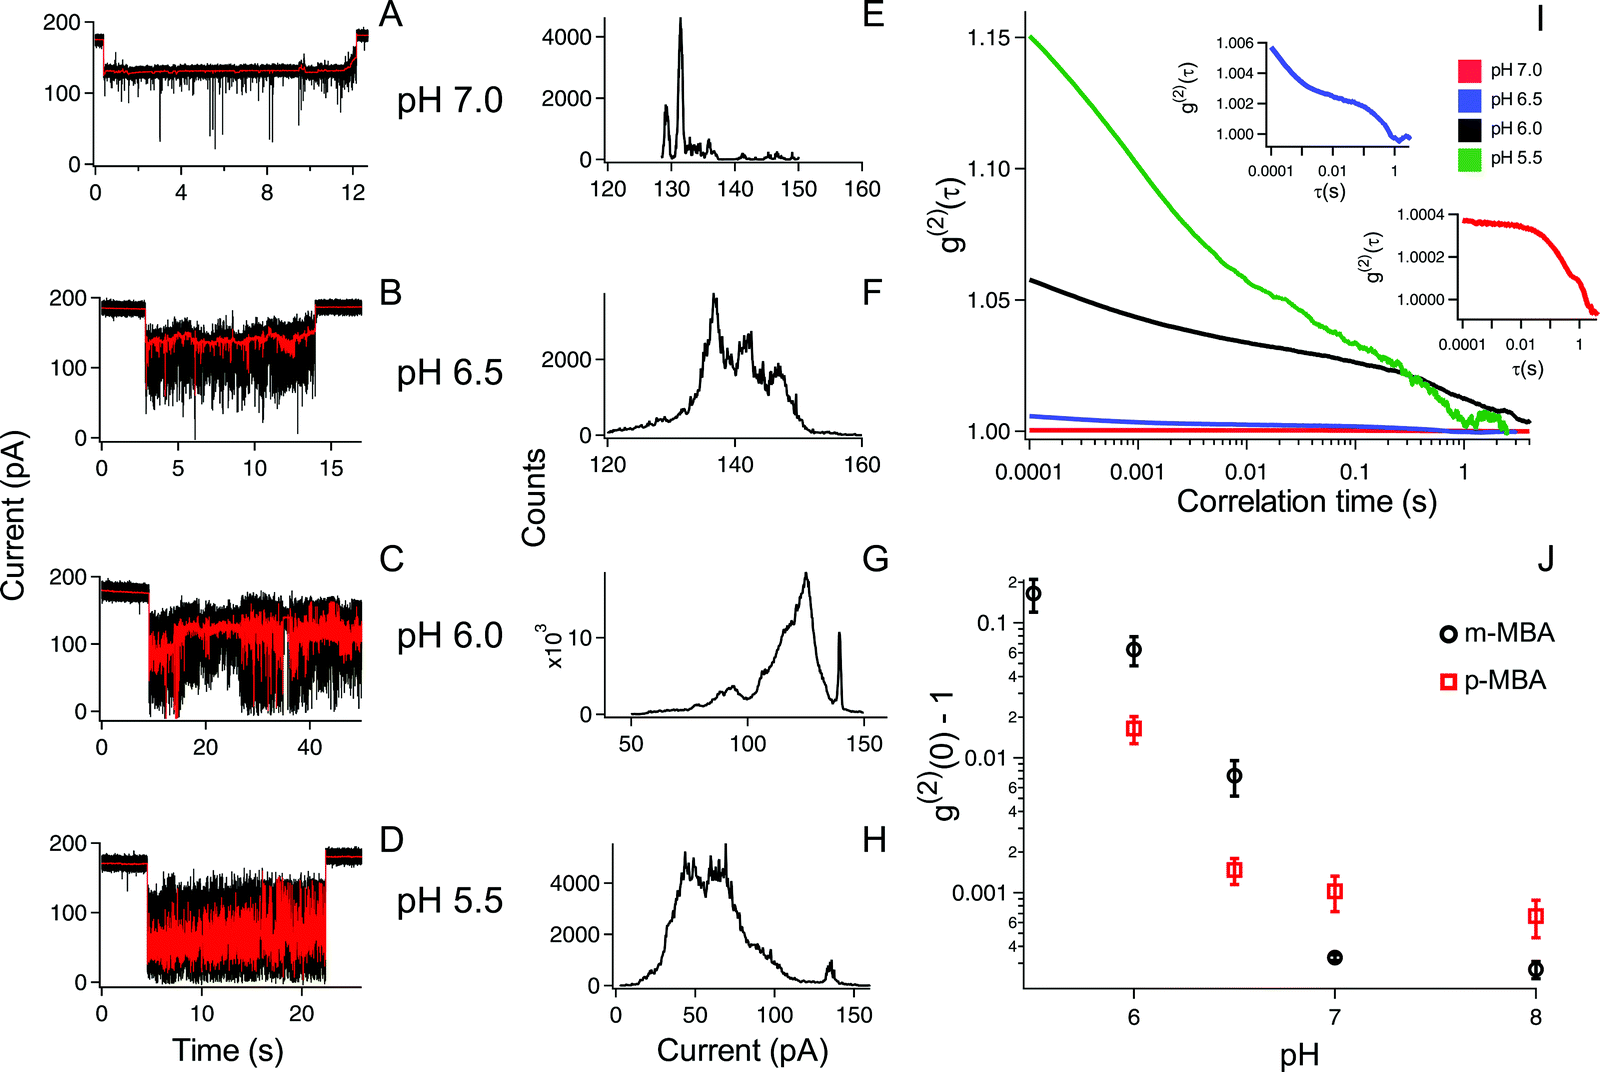 | ||
| Fig. 4 The m-MBA cluster dynamics under varying pH conditions illuminates the role that inter-ligand binding plays in the nanopore current fluctuations. (A–D) The current traces of individual trapped m-MBA capped particles (black) and 100 Hz filtered signals (red) show that the noise in the current fluctuations increases with decreasing pH ((A and E) = pH 7: (B and F) = pH 6.5: (C and G) = pH 6: (D and H) = pH 5.5). (E–H) The corresponding current histograms for the filtered data shown in (A–D) show peak like structures that become wider and less resolved with decreasing pH. (I) This is confirmed with the autocorrelation of unfiltered traces at each pH, which shows similar kinetics but increasing magnitude. The inset curves show magnified views of the pH 6.5 (blue) and pH 7 (red) autocorrelations. (J) The comparison of the g(2)(0) − 1 values between m-MBA (black circles) and p-MBA (red squares) shows that both increase with decreasing pH; however, the magnitude of the fluctuations grows larger for the m-MBA clusters. All data were collected under a 70 mV applied transmembrane potential in 3 M KCl solution. Each autocorrelation function is averaged from five different cluster events. The error bars in (J) correspond to ± 1 S.E. calculated from a minimum of 4 different events for each pH value and isomer type. | ||
To verify this interpretation, we compared the g2(0) values as a function of pH between the m-MBA and p-MBA clusters. Our hypothesis is that the p-MBA clusters should not exhibit inter-ligand bonding (see Fig. 1) and this should result in the p-MBA clusters being less stable than the m-MBA clusters (i.e. larger g2(0) values) at higher pH. Furthermore, as the pH is lowered, we also hypothesize that the m-MBA clusters will exhibit greater fluctuations as they become less stable without their inter-ligand bonds and more of the hydrophobic benzene rings will become exposed to the exterior solvent as compared to the p-MBA particles. This means that we should expect to see a greater increase in the noise for the m-MBA particles as compared to the p-MBA particles as the pH is reduced. Fig. 4J demonstrates both of these predications as the g2(0) values are greater for the p-MBA clusters at pH 8.0 and pH 7.0, but become less than the g2(0) values for m-MBA as the pH is lowered below 7.
In addition to the observed switching in Fig. 4J, we also note that one could associate the sharp increase in the g2(0) values with the cluster pKa values. Given this, it appears that the p-MBA clusters have a slightly lower pKa value than m-MBA, which is expected given the fact that the carboxyl groups on the m-MBA clusters are generally closer to the metallic core.36 One final observation of note is that the m-MBA clusters can still be observed at pH 5.5, while we see no evidence of the p-MBA clusters at pH 5.5. This suggests that the p-MBA clusters begin aggregating and “crashing out” at pH 5.5 as one might expect given that the p-MBA carboxylic groups are more accessible to nearby clusters when diffusing outside the pore.
The bottom line is that by utilizing nanopore sensing it is possible to clearly distinguish between the m- and p-MBA-capped clusters through a comparison of the pH dependent current fluctuations. Fig. 5 provides illustrative descriptions and a summary of our hypothesis and explanations for the current traces for the o-MBA, m-MBA and p-MBA clusters.
 | ||
| Fig. 5 Schematic illustration of the differences between the mercaptobenzoic ligands observed with nanopore sensing. (Top) o-MBA ligands create smaller clusters that can fit into the pore and execute rapid Brownian motion. This leads to a current trace that exhibits rapid fluctuations. (Bottom) m-MBA and p-MBA ligands yield well defined current step transitions at high pH (>7) while reducing the pH gives rise to rapid fluctuations. The cause of these fluctuation differences is highlighted in the main text. | ||
Stability of the clusters in isolation
In addition to studying structural fluctuations and demonstrating the ability to distinguish between the different isomer systems, the nanopore environment also offers the ability to isolate clusters for long time observation in different supporting media. In particular, we are interested in the role free Au–ligand complexes play in affecting the cluster kinetics and stability within the pore environment. We have previously shown that thiolate capped metallic clusters are capable of homogenous exchange when exposed to free ligands of identical species to the capping agent, and that this exchange prompts increased stability (residence time) and activity in the trapped clusters.31 For this free spray mode, the clusters were provided with a continuous supply of Au–ligand complexes, and Fig. 6 reports on the differences between this spray-on mode and the isolated cluster mode, showcasing the role that the excess Au–ligand complexes play in the cluster stability and kinetics within the pore environment.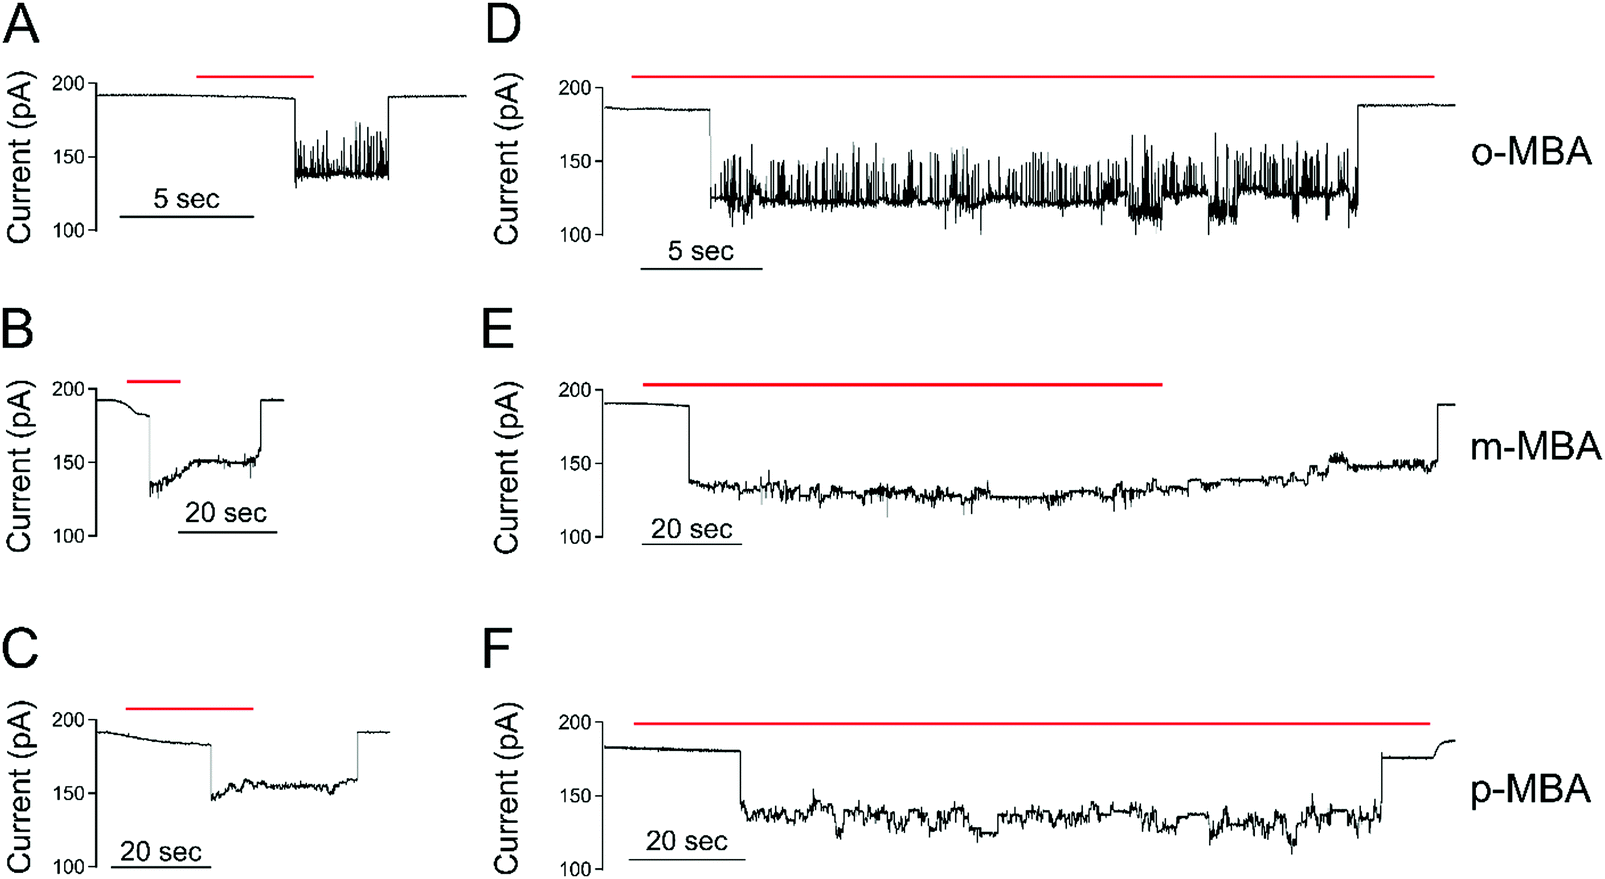 | ||
| Fig. 6 Free ligand complexes increase the stability of the nanopore-bound clusters. The red bar in each trace shows the time when the spray is left on. When the spray turns off the free ligand-complex concentration quickly goes to zero. (A–C) The spray-off cases show short-lived cluster events where the spray is turned off a few seconds after particle capture. (D–F) The spray-on cases show that the particles remain in the pore for extended periods under continued exposure to free ligand complexes. The average cluster occupation times for the spray-off and spray-on cases are as follows: o-MBA: toff = (3.62 ± 1.01) s, ton = (165 ± 57) s, m-MBA: toff = (20.8 ± 5.2) s, ton = (156 ± 33) s, p-MBA: toff = (25.7 ± 4.4) s, ton = (157 ± 65) s. The error bars correspond to ± 1 S.E. All values are calculated from a minimum of 6 capture events. All data are collected under a 70 mV applied transmembrane potential at pH 8.0 in a 3 M KCl solution. Each current trace is filtered with a 100 Hz lowpass filter. | ||
In the spray-on case, all 3 isomers show an increase in activity and residence times. The residence times for the clusters in the spray-on case became comparable for all three isomers, with residence times of (157 ± 65) s, (156 ± 33) s, and (165 ± 57) s for p-, m-, and o-MBA, respectively. The reported uncertainties correspond to ±1 standard error with means calculated from n = 6, n = 7 and n = 7 cluster events for the o-, m-, and p-MBA cases, respectively. These residence times are factors of 6×, 6× and 50× longer than the no-ligand residence times quoted above. Clearly, the presence of Au–ligand complexes serves to help maintain the structural integrity of the clusters in the nanopore environment. For o-MBA, the existence of current substates became more prevalent when supplied with an excess of Au–ligand complexes, but remained significantly below the other isomers’ step transition activity. For all isomers, the self-exchange of ligands likely leads to a reduction in the interactions of the carboxyl groups with adjacent ligands and the gold core. The increase in residence time is likely due to either increased hydrogen bonding between the free ligand complexes and bonded ligands or the regular replacement of ligands. It is assumed here that if a ligand detaches from the isolated cluster (ligand-free case), the cluster is destabilized. When enough ligands detach, it eventually exits the pore due to a decrease in size. In the spray-on case, any ligands that detach are rapidly replaced, allowing for the cluster to maintain its size, and thus decreasing the likelihood of it exiting the pore. Because the Au–ligand complexes are being supplied from the same source as the gold clusters, we cannot rule out that ligands detach with a bound gold atom, as the incoming Au–ligand complexes may provide both a new ligand and replacement gold for any that is lost.
IV. Conclusion
We have shown that nanopore sensing presents a unique and powerful technique for identifying surface kinetic differences between isomer ligands on gold nanoclusters. We identified that p-MBA capped gold clusters show faster, more active kinetics compared to m-MBA at high pH, and this has been attributed to the stabilizing effects of adjacent ligand hydrogen bond like interactions in m-MBA. To explore the role of inter-ligand binding for m-MBA clusters, we also performed a pH dependent comparison of the current fluctuations between m-MBA and p-MBA and found that, as the pH is lowered, the m-MBA clusters exhibit greater fluctuations, most likely as a result of disrupting inter-ligand binding and the corresponding exposure of hydrophobic benzene rings to the solvent. The o-MBA clusters exhibited more rapid fluctuations in the pore that did not yield well defined step transitions between various current substates. We hypothesise that this may be attributable to modified carboxyl–gold bond kinetics or the formation of slightly smaller clusters that fit deeper into the pore volume where Brownian fluctuations dominate. Additionally, we showed that providing a source of excess ligand–cluster complexes promotes homogenous exchange that extends the cluster residence time and increases the kinetic activity for all three isomers.Conflicts of interest
There are no conflicts to declare.Acknowledgements
This material is based upon work supported by the National Science Foundation under Grant CBET-2011173.References
- W. Kurashige, Y. Niihori, S. Sharma and Y. Negishi, Precise synthesis, functionalization and application of thiolate-protected gold clusters, Coord. Chem. Rev., 2016, 320–321, 238–250 CrossRef CAS.
- G. T. van Moolenbroek, T. Patiño, J. Llop and S. Sánchez, Engineering Intelligent Nanosystems for Enhanced Medical Imaging, Advanced Intelligent Systems, 2020, 2, 2000087 CrossRef.
- Y. Zhang, C. Zhang, C. Xu, X. Wang, C. Liu, G. I. N. Waterhouse, Y. Wang and H. Yin, Ultrasmall Au nanoclusters for biomedical and biosensing applications: A mini-review, Talanta, 2019, 200, 432–442 CrossRef CAS.
- L. A. Layqah and S. Eissa, An electrochemical immunosensor for the corona virus associated with the Middle East respiratory syndrome using an array of gold nanoparticle-modified carbon electrodes, Microchim. Acta, 2019, 186, 224 CrossRef.
- H. Jahangirian, K. Kalantari, Z. Izadiyan, R. Rafiee-Moghaddam, K. Shameli and T. J. Webster, A review of small molecules and drug delivery applications using gold and iron nanoparticles, Int. J. Nanomed., 2019, 14, 1633–1657 CrossRef CAS.
- X. M. Lin, C. M. Sorensen and K. J. Klabunde, Digestive Ripening, Nanophase Segregation and Superlattice Formation in Gold Nanocrystal Colloids, J. Nanopart. Res., 2000, 2, 157–164 CrossRef CAS.
- B. L. V. Prasad, S. I. Stoeva, C. M. Sorensen and K. J. Klabunde, Digestive Ripening of Thiolated Gold Nanoparticles: The Effect of Alkyl Chain Length, Langmuir, 2002, 18, 7515–7520 CrossRef CAS.
- R. Dinkel, B. Braunschweig and W. Peukert, Fast and Slow Ligand Exchange at the Surface of Colloidal Gold Nanoparticles, J. Phys. Chem. C, 2016, 120, 1673–1682 CrossRef CAS.
- A. Fernando and C. M. Aikens, Ligand Exchange Mechanism on Thiolate Monolayer Protected Au25(SR)18 Nanoclusters, J. Phys. Chem. C, 2015, 119, 20179–20187 CrossRef CAS.
- M. J. Hostetler, A. C. Templeton and R. W. Murray, Dynamics of place-exchange reactions on monolayer-protected gold cluster molecules, Langmuir, 1999, 15, 3782–3789 CrossRef CAS.
- S. Knoppe, R. Azoulay, A. Dass and T. Bürgi, In Situ Reaction Monitoring Reveals a Diastereoselective Ligand Exchange Reaction between the Intrinsically Chiral Au38(SR)24 and Chiral Thiols, J. Am. Chem. Soc., 2012, 134, 20302–20305 CrossRef CAS.
- S. Knoppe, A. C. Dharmaratne, E. Schreiner, A. Dass and T. Bürgi, Ligand Exchange Reactions on Au38 and Au40 Clusters: A Combined Circular Dichroism and Mass Spectrometry Study, J. Am. Chem. Soc., 2010, 132, 16783–16789 CrossRef CAS.
- L. G. AbdulHalim, N. Kothalawala, L. Sinatra, A. Dass and O. M. Bakr, Neat and Complete: Thiolate-Ligand Exchange on a Silver Molecular Nanoparticle, J. Am. Chem. Soc., 2014, 136, 15865–15868 CrossRef CAS.
- W. Kurashige, R. Hayashi, K. Wakamatsu, Y. Kataoka, S. Hossain, A. Iwase, A. Kudo, S. Yamazoe and Y. Negishi, Atomic-Level Understanding of the Effect of Heteroatom Doping of the Cocatalyst on Water-Splitting Activity in AuPd or AuPt Alloy Cluster-Loaded BaLa4Ti4O15, ACS Appl. Energy Mater., 2019, 2, 4175–4187 CrossRef CAS.
- X. Kang, L. Xiong, S. Wang, Y. Pei and M. Zhu, Combining the Single-Atom Engineering and Ligand-Exchange Strategies: Obtaining the Single-Heteroatom-Doped Au16Ag1(S-Adm)13 Nanocluster with Atomically Precise Structure, Inorg. Chem., 2018, 57, 335–342 CrossRef CAS.
- B. Kumar, T. Kawawaki, N. Shimizu, Y. Imai, D. Suzuki, S. Hossain, L. V. Nair and Y. Negishi, Gold nanoclusters as electrocatalysts: size, ligands, heteroatom doping, and charge dependences, Nanoscale, 2020, 12, 9969–9979 RSC.
- M. Wells, D. L. Dermody, H. C. Yang, T. Kim, R. M. Crooks and A. J. Ricco, Interactions between Organized, Surface-Confined Monolayers and Vapor-Phase Probe Molecules. 9. Structure/Reactivity Relationship between Three Surface-Confined Isomers of Mercaptobenzoic Acid and Vapor-Phase Decylamine, Langmuir, 1996, 12, 1989–1996 CrossRef CAS.
- M. Azubel, A. L. Koh, K. Koyasu, T. Tsukuda and R. D. Kornberg, Structure Determination of a Water-Soluble 144-Gold Atom Particle at Atomic Resolution by Aberration-Corrected Electron Microscopy, ACS Nano, 2017, 11, 11866–11871 CrossRef CAS.
- N. Mammen, S. Malola, K. Honkala and H. Häkkinen, Dynamics of weak interactions in the ligand layer of meta -mercaptobenzoic acid protected gold nanoclusters Au 68 (m-MBA) 32 and Au 144 (m-MBA) 40, Nanoscale, 2020, 12, 23859–23868 RSC.
- T. R. Tero, S. Malola, B. Koncz, E. Pohjolainen, S. Lautala, S. Mustalahti, P. Permi, G. Groenhof, M. Pettersson and H. Häkkinen, Dynamic Stabilization of the Ligand-Metal Interface in Atomically Precise Gold Nanoclusters Au68 and Au144 Protected by meta-Mercaptobenzoic Acid, ACS Nano, 2017, 11, 11872–11879 CrossRef CAS.
- K. A. Parrish, M. King, M. R. Ligare, G. E. Johnson and H. Hernández, Role of sterics in phosphine-ligated gold clusters, Phys. Chem. Chem. Phys., 2019, 21, 1689–1699 RSC.
- Y. Chen, C. Zeng, D. R. Kauffman and R. Jin, Tuning the Magic Size of Atomically Precise Gold Nanoclusters via Isomeric Methylbenzenethiols, Nano Lett., 2015, 15, 3603–3609 CrossRef CAS.
- F. Bertorelle, I. Russier-Antoine, C. Comby-Zerbino, F. Chirot, P. Dugourd, P.-F. Brevet and R. Antoine, Isomeric Effect of Mercaptobenzoic Acids on the Synthesis, Stability, and Optical Properties of Au25(MBA)18 Nanoclusters, ACS Omega, 2018, 3, 15635–15642 CrossRef CAS.
- C. Comby-Zerbino, F. Bertorelle, P. Dugourd, R. Antoine and F. Chirot, Structure and Charge Heterogeneity in Isomeric Au25(MBA)18 Nanoclusters—Insights from Ion Mobility and Mass Spectrometry, J. Phys. Chem. A, 2020, 124, 5840–5848 CrossRef CAS.
- E. J. Campos and J. Yates, Single molecule characterisation of metal nanoparticles using nanopore-based stochastic detection methods, Sens. Actuators, B, 2018, 255, 2032–2049 CrossRef CAS.
- L. Mereuta, A. Asandei, I. S. Dragomir, I. C. Bucataru, J. Park, C. H. Seo, Y. Park and T. Luchian, Sequence-specific detection of single-stranded DNA with a gold nanoparticle-protein nanopore approach, Sci. Rep., 2020, 10, 11323 CrossRef CAS.
- Y. Astier, O. Uzun and F. Stellacci, Electrophysiological Study of Single Gold Nanoparticle/α-Hemolysin Complex Formation: A Nanotool to Slow Down ssDNA Through the α-Hemolysin Nanopore, Small, 2009, 5, 1273–1278 CrossRef CAS.
- E. Campos, A. Asandei, C. E. McVey, J. C. Dias, A. S. F. Oliveira, C. M. Soares, T. Luchian and Y. Astier, The role of lys147 in the interaction between MPSA-gold nanoparticles and the α-hemolysin nanopore, Langmuir, 2012, 28, 15643–15650 CrossRef CAS.
- J. Ettedgui, J. J. Kasianowicz and A. Balijepalli, Single Molecule Discrimination of Heteropolytungstates and Their Isomers in Solution with a Nanometer-Scale Pore, J. Am. Chem. Soc., 2016, 138, 7228–7231 CrossRef CAS.
- B. D. Cox, P. H. Woodworth, P. D. Wilkerson, M. F. Bertino and J. E. Reiner, Ligand-Induced Structural Changes of Thiolate-Capped Gold Nanoclusters Observed with Resistive-Pulse Nanopore Sensing, J. Am. Chem. Soc., 2019, 141, 3792–3796 CrossRef CAS.
- B. D. Cox, M. L. Ghimire, M. F. Bertino and J. E. Reiner, Resistive-Pulse Nanopore Sensing of Ligand Exchange at the Single Nanocluster Limit for Peptide Detection, ACS Appl. Nano Mater., 2020, 3, 7973–7981 CrossRef CAS.
- M. F. Bertino, Z.-M. Sun, R. Zhang and L.-S. Wang, Facile Syntheses of Monodisperse Ultrasmall Au Clusters, J. Phys. Chem. B, 2006, 110, 21416–21418 CrossRef CAS.
- C. E. Angevine, S. J. Seashols-Williams and J. E. Reiner, Infrared Laser Heating Applied to Nanopore Sensing for DNA Duplex Analysis, Anal. Chem., 2016, 88, 2645–2651 CrossRef CAS.
- S. Bhattacharya, J. Muzard, L. Payet, J. Mathé, U. Bockelmann, A. Aksimentiev and V. Viasnoff, Rectification of the Current in α-Hemolysin Pore Depends on the Cation Type: The Alkali Series Probed by Molecular Dynamics Simulations and Experiments, J. Phys. Chem. C, 2011, 115, 4255–4264 CrossRef CAS.
- L. Song, M. Hobaugh, C. Shustak, S. Cheley, H. Bayley and E. Gouaux, Structure of Staphylococcal α-Hemolysin, a Heptameric Transmembrane Pore, Science, 1996, 274, 1859–1865 CrossRef CAS.
- J. Koivisto, X. Chen, S. Donnini, T. Lahtinen, H. Häkkinen, G. Groenhof and M. Pettersson, Acid–Base Properties and Surface Charge Distribution of the Water-Soluble Au 102 (p-MBA) 44 Nanocluster, J. Phys. Chem. C, 2016, 120, 10041–10050 CrossRef CAS.
| This journal is © the Owner Societies 2021 |