
Coupling of mechanical deformation and reaction in mechanochemical transformations
Gabriele
Traversari
 a,
Andrea
Porcheddu
b,
Giorgio
Pia
a,
Francesco
Delogu
*a and
Alberto
Cincotti
a
a,
Andrea
Porcheddu
b,
Giorgio
Pia
a,
Francesco
Delogu
*a and
Alberto
Cincotti
a
aDepartment of Mechanical, Chemical and Materials Engineering, University of Cagliari, via Marengo 2, 09123 Cagliari, Italy. E-mail: francesco.delogu@unica.it
bDepartment of Chemical and Geological Sciences, University of Cagliari, Cittadella Universitaria, SS 554 bivio per Sestu, 09042 Monserrato, CA, Italy
First published on 8th December 2020
Abstract
Driven by the promise of alternative synthetic routes to fine chemicals and pharmaceuticals, mechanochemistry is going through a period of intense growth. Mechanical forces are successfully utilized to activate chemical reactions involving an ever-growing variety of inorganic and organic substances with the aim of developing solvent-less processes to be used in the greener chemical industry of tomorrow. Down this path, the proper understanding of the relationships between processing variables, macroscopic transformation kinetics and microscopic chemistry represents one of the fundamental challenges to face. In this work, we develop a kinetic model that, taking into account the intrinsic statistical nature of the mechanical processing of powders by ball milling, combines a phenomenological description of the rheological behaviour of molecular solids with the chemistry of interface reactions. Specifically, we use discrete deformation maps to account for the co-deformation of molecular solids and the consequent increase of the interface area between initially segregated reactants. We assume that the chemical reaction only occurs, with a certain probability, when reactants come into contact due to relocations induced by shearing. No diffusion is allowed. The systematic variation of the amount of powder involved in individual impacts, the composition of powder mixtures and the reaction probability at the interface provide us with a complete overview of the kinetic scenario. In particular, we present the different kinetic curves that can be originated from interface reaction, pointing out how statistical, mixing and chemical factors affect the mechanochemical kinetics. Eventually, we suggest how experimental findings can be used to gain information on the underlying mechanochemistry based on the outcomes of our kinetic modeling.
Introduction
Chemical reactions are processes in which one set of chemical substances is transformed into another set.1 The chemical change is mediated by the rearrangement of electrons around the nuclei of elemental species and is commonly described in terms of breakage and formation of chemical bonds between atoms.1For chemical bonds to break and form, the chemical species have to come closer and closer. As they approach each other, chemical bonds become increasingly distorted and the overall potential energy increases.1 At distances comparable with chemical bond lengths, reactants become partially bonded together by new chemical bonds that begin to form, possibly accompanied by the simultaneous weakening of other chemical bonds. The reactants gradually give rise to a collection of intermediate structures that persist while chemical bonds are forming and breaking near, or at, the saddle point of the potential energy surface.1 The resulting activated complex exists for extremely short time periods and evolves with equal likelihood towards the initial reactants or new products.1
These classical considerations make it clear that reactions involving two or more reactants can proceed only if the reactants are brought together on the molecular scale.2 However, typically reactants are mixed only on the macroscopic, or mesoscopic, scales initially.2 Therefore, the initial reactant mixture needs to be properly homogenized on the microscopic scale to overcome reactant segregation and enable, at least in principle, all the molecules to interact with each other.2
This result can be achieved by physical mixing, which reduces the characteristic lengths associated with reactant segregation and, then, the differences in local concentration.3 Whenever mixing is fast enough, the generation of new chemical species is governed by the intrinsic chemical kinetics.3 Otherwise, the chemical species remain separated by diffuse or sharp reaction fronts. These fronts can assume very complex morphologies in the presence of external forcing able to induce heterogeneous flow, and phase stretching in particular.3 Under these circumstances, the reaction rates can differ significantly from those observed under ideal mixing conditions.
If fluid phases are involved, diffusive mass transfer can take place at interfaces.4 In this case, the rate of chemical reaction specifically depends on the Peclet number, i.e. the ratio of the characteristic time of diffusion to the characteristic time of shearing, and on the Damköhler number, equal to the ratio of the characteristic time of diffusion to the characteristic time of chemical reaction.4 When diffusion can occur at relatively high rates, a diffuse interface forms and chemical species mix progressively.
The situation drastically changes when reactant molecules are in the solid state, which prevents any fast diffusion process.5 Segregation is complete and the formation of products at the interface makes the reaction come to a complete arrest in a short time.5 The only possible way to induce further chemical reaction is to generate new interface area to bring new reactant molecules into contact. Therefore, the reaction extent is entirely dependent on the scale of reactant segregation.
The forced mixing of reactants, and the consequent reaction progress through the constant generation of new interface area between reactants, is the characteristic feature of the mechanical processing of solids.6 The method relies precisely upon the severe mechanical deformation of solid phases by the application of mechanical forces to continuously generate new interface area.6
Deformation induces the repeated stretching and folding of the solid phases. Mass transport by bulk motion and relocation processes reshape solids and interfaces, resulting in two-phase patterns of increasing complexity and disorder.7 Under the effect of an advection-like dynamics involving increasingly shorter length scales,7 the interface area becomes larger and larger. While the absence of diffusion makes the occurrence of mixing processes as commonly understood questionable, local shearing finely disperses the solids, eventually determining contact on the molecular scale.8 It is in this meaning that we use the terms forced mixing.8
The mechanical processing of powders by ball milling is the most popular method to co-deform solids and increase the interface area.9 The movement of the reactor, or of parts of it, makes milling balls collide with each other and with the reactor walls.9 During each impact, a small fraction of the powder charge is trapped between the colliding surfaces and subjected to mechanical loading.9 Loose powders experience dynamic compaction at relatively high strain rates and undergo mechanical deformation. Interfaces between reactants form and the repeated occurrence of impacts makes the microstructure evolve and the interface area increase.
The extent of reaction is determined by the mixing of reactants in combination with thermodynamic and kinetic factors.9 This is especially true in mechanochemical reactions involving solid organic reactants,9 which are soft enough to severely deform under the effects of mechanical loading. Shear flow, in particular, can be expected to represent the primary phase deformation process. Organic solids can, thus, undergo repeated stretching and folding.
The importance of the rheological response of reactants in mechanochemical organic reactions has been already recognized and attention has been called on the related mixing effects.10 Nevertheless, there is still a substantial lack of information on this issue and, as a consequence, a poor understanding of the mechanochemical reactivity itself. In addition, literature does not yet offer any practical indication about what experimentalists can expect from the combination of mixing and chemical processes during the mechanical activation and how experimental findings can be used to gain deeper insight into the chemistry activated by mechanical forces.
In this work, we aim precisely at providing information about the kinetics of mechanochemical reactions involving organic reactants. While a direct experimental study of the way local mixing processes can affect the reaction rate is presently out of reach, we believe that useful clues can be obtained by modelling. To this aim, we have developed a simplified numerical model that relates the overall reaction kinetics to the evolution of mixing fronts. We couple shear flows and chemical reactivity for mechanochemical transformations with initially segregated reactants separated by flat fronts.
Mixing effects during individual impacts are described by a discrete deformation map that mimics the deformation of soft phases under shearing conditions. The intrinsic reaction kinetics is accounted for by introducing a reaction probability between reactant molecules that face each other at the interface. The model takes into account the statistical nature of the mechanical processing by ball milling.
Taking advantage of such model, we carried out a systematic investigation of the apparent reaction kinetics varying the amount of powder effectively processed during individual impacts, the chemical composition of the reactant mixture and the reaction probability at the interface. We discuss how the statistical features and the interface area affect the reaction rate in combination with the reaction probability, showing the shape of the resulting kinetic curves. Finally, we suggest how to use experimental data to extract information on the chemistry at work on the microscopic scale.
Nomenclature is summarized at the end of the work.
Mechanical processing by ball milling
Ball milling is a discontinuous method that enables the mechanical processing of powder based on the occurrence of impacts.9 As schematically shown in Fig. 1, each impact involves only part of the processed powder, subjecting it to mechanical loading.9 Mechanical forces apply to loose powders, thus inducing their dynamic compaction at relatively high strain rates.9 As powder particles are compressed, their mobility is progressively reduced by contact forces, which eventually form inhomogeneous force chains percolating across interparticle contact points.9 Under the effects of severe mechanical stresses, powder particles undergo plastic deformation and flow against each other or, in case of brittle materials, break into fragments.9 Possibly, physical and chemical changes take place consequently.9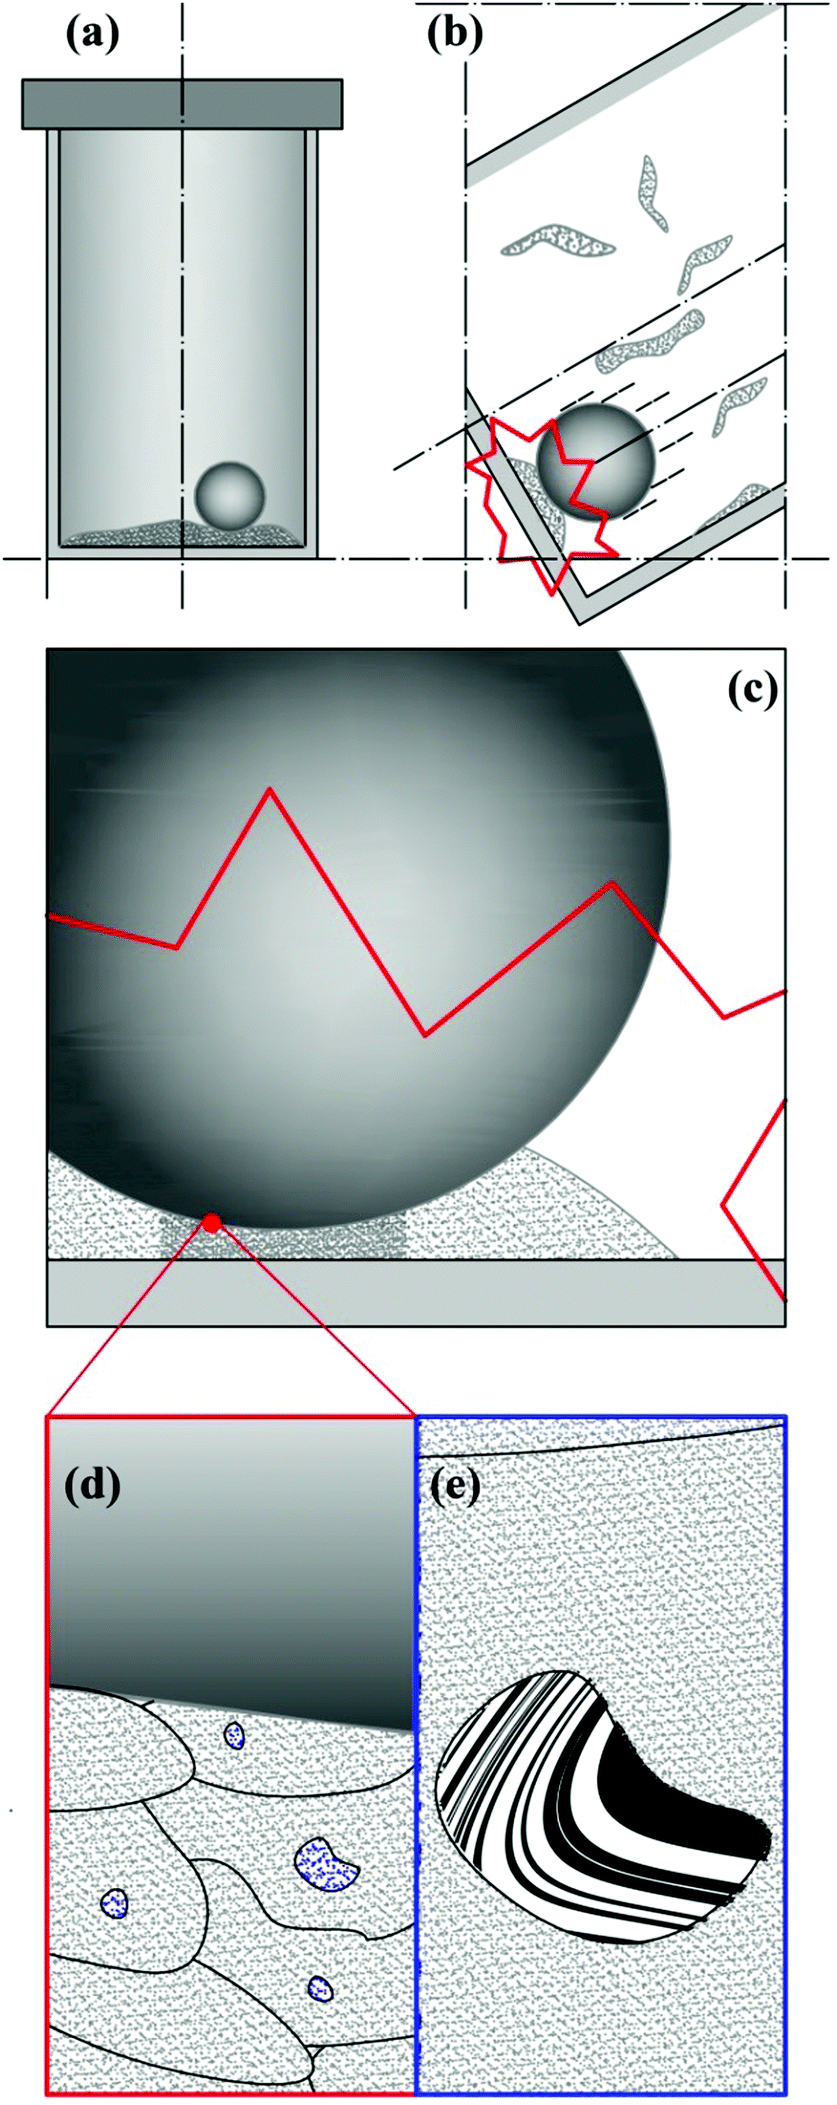 | ||
| Fig. 1 Schematic description of the mechanical processing of powder by ball milling. (a) The reactor contains ball and powder. (b) Due to the reactor motion, the ball impacts on the reactor wall, involving a small fraction of the powder charge. (c) Part of the powder involved in individual impacts undergoes effective dynamic compaction (darker region). (d) The powder particles affected by dynamic compaction undergo severe mechanical deformation and local mechanical stresses can become intense enough to impose CLCs in small volumes v* located inside the particles or at their contact points (regions of variable shape). (e) The occurrence of CLCs gives rise to physical and chemical changes inside the volumes v* (here represented as the mixing of a white A phase and a black B phase). | ||
Only a relatively small fraction of powder is involved in individual impacts and its involvement is inherently stochastic. Together with the continuous stirring of powders, this provides the mechanical processing by ball milling with an intrinsically discrete and statistical nature. These features affect any aspect of the powder processing and must be suitably taken into account in the kinetic description of mechanically induced reactions as well as in the analysis of experimental data.
To this aim, we have recently developed a kinetic model that can be utilized to relate the experimental evidence to the processes taking place on the microscopic scale during individual impacts.10 The model is based on the following, few assumptions:
(i) Consecutive impacts occur independent of each other;
(ii) Chemical changes can only take place when the intensity of local mechanical stresses overcomes a threshold value, which identifies critical loading conditions (CLCs);
(iii) Chemical changes take place in η small volumes v* that are randomly distributed inside the powder volume trapped in individual impacts;
(iv) The involvement of volumes v* in CLCs is stochastic;
(v) Chemical changes involving volumes v* take place on time scales shorter than impact duration, τ;
(vi) Stirring keeps the powder charge uniform and homogeneous.
The repeated mechanical loading of powder particles in individual impacts implies that η volumes v* can undergo CLCs 1, 2,…, i,… times depending on the total duration of the mechanical processing. The total volume of powder affected by CLCs during individual impacts, v, is equal to the product ηv* and the ratio v/V between v and the total volume of powder, V, defines the volume fraction of powder that is subjected to CLCs per impact, κ. These considerations are schematically represented in Fig. 1.
Simple statistical considerations suggest that the volume fraction of powder, χi(m), that has undergone CLCs i times after m impacts is10
| χi(m) = m!/[i!(m − i)!]κi(1 − κ)m−i. | (1) |
In other words, any single m-th impact imposes CLCs only on a small fraction of the volume of powder trapped between the colliding surfaces, which, in turn, is a small fraction of the whole volume of powder inside the reactor. The milling dynamics inside the reactor is chaotic and the constant stirring of powders keeps the powder charge homogeneous. Thus, the powder trapped and the fraction of trapped powder affected by CLCs are effectively mixed with the rest of powder after any given impact.
The effective stirring and the fact that the powder is involved in impacts stochastically ensure that the fraction of powder involved in the m-th impact is not the same involved in the m − 1-th impact and will not be the same involved in the m + 1-th impact.
Once a certain number m of impacts have occurred, the volume fractions of powder affected 0, 1, 2,…, i,… times by CLCs during individual impacts exhibit statistical distribution. When m is small, most of powder has never been affected by CLCs, and the statistical distribution is restricted to the lowest values of i. As ball milling proceeds, and the number m of impacts increases, distributions move towards larger values of i, since a larger volume fraction of powder has been involved in CLCs more times. In a single impact only the volume fraction of powder κ = ηv*/V is affected by CLCs. Therefore, eqn (1) represents the statistical distribution of the number of times, i, that CLCs are experienced after a total number of m impacts have occurred.
Since volume v is much smaller than the total volume of powder, V, κ is much smaller than 1. Therefore, eqn (1) can be re-written as the Poisson distribution
| χi(m) = [(κm)i/i!]exp(−κm). | (2) |
 | (3) |
Accordingly, at any given number m of impacts, the sum of the volumes of powders that have been affected by CLCs i ≤ m times corresponds to the total volume of powder inside the reactor. Invariably, i is equal to m or smaller. Therefore, the sum in eqn (3) can be restricted, in principle, to the first m terms. However, m is generally very large, and the limit to infinity is reasonable.
While eqn (1) and (2) account for the statistics underlying the involvement of volumes v* in 1, 2,…, i,… CLCs, they provide no information about the physical and chemical changes that CLCs induce in volumes v*. To this aim, the degree of physical and/or chemical transformation in individual volumes v* must be related to the number of CLCs undergone by volumes v*.8
The simplest way to do that is to hypothesize that the volume fractions that have undergone CLCs different times, χi(m), exhibit different values of chemical conversion, αi. Accordingly, the total degree of chemical conversion, α(m), can be expressed as
 | (4) |
Eqn (4) corresponds to the weighted average of the degrees of chemical conversion αi over the volume fractions χi(m). It is the most general kinetic equation for mechanically activated transformations. Therefore, any analysis of experimental kinetics, or any description of mechanochemical kinetics, requires the independent estimation of the quantities χi(m) and αi and the deconvolution of their contributions to eqn (4).
In this regard, it is worth noting that difficulties are formidable. The deconvolution of statistical and chemical factors involves the independent measurement of χi(m) and αi values. However, volumes v* can be expected to be on the nanometre range and dispersed in a much larger volume of powder, which makes them out of reach for any systematic investigation based on the experimental methods currently available. Thus, the only way to gain insight, although indirect, on local processes is to analyse the available experimental data with the help of a suitably developed conceptual framework for the transformation kinetics.
In the following, we develop such a framework for the case study of organic reactants that give rise to interfacial reactions once effectively mixed. Specifically, we show how the occurrence of mixing processes and interfacial reactions in volumes v* that have undergone i CLCs after m impacts can determine the spectrum of αi values and, then, the shape of kinetic curves.
Interface area changes during impacts
The response of powder particles to local mechanical stresses is governed primarily by their mechanical properties. In turn, these are related to the chemical nature. In this regard, it is worth noting that molecular materials are generally about two orders of magnitude softer than ionic, covalent and metallic ones.11 It is the weakness of intermolecular forces compared with chemical bonds to make the structure of molecular solids more prone to deformation than ionic, covalent and metallic solids, the applied mechanical forces being the same.11The application of directional mechanical stresses to molecular crystals with layered structure can easily induce shear deformation through the slippage of molecular planes.11 Deformation mechanisms including slip deformation and twin deformation have been observed in molecular crystals characterized by strong in-plane interactions and weaker interlayer forces.11 Molecular crystals characterized by anisotropic packing with strong and weak interaction patterns distributed along different crystalline directions can also exhibit significant bending.11 In contrast, isotropic interactions in the three dimensions typically result in molecular crystals showing a brittle behaviour.11 Hardness, strain-rate sensitivity and granularity contribute determining the ability of molecular crystals to undergo plastic deformation and flow under the effects of severe mechanical stresses.11
In this work, we focus on the chemical reaction between two initially segregated organic reactants. We assume that the organic solids have the same mechanical properties. Accordingly, they exhibit the same response to mechanical stresses and undergo the same deformation processes.
In this respect, we note that the intensity of mechanical forces typically experienced by trapped powders during individual impacts is remarkably higher than the yield stress of molecular materials.9,11 Therefore, it can be reasonably expected that the organic reactants eventually undergo flow deformation under the effect of shear stresses.
Since ball milling, and, then, our kinetic model, are inherently discrete, we need a discrete description of the physical and chemical changes affecting the volume fractions of powder that have undergone CLCs different times. The first step in this direction is to describe the flow deformation undergone by the molecular solids under shearing. To this aim, we take advantage of a deformation map that mimics the mechanical deformation of a material in the presence of shear stresses. Although various choices are possible,12 we selected the non-linear shear-transformation map that describes shear deformation based on the equations
| xi+1 = xi + 4(yi + 1/2); | (5a) |
| yi+1 = yi + (xi+1 − 1)2; | (5b) |
| zi+1 = zi, | (5c) |
Already used to describe the effects of shearing in binary alloys,13 the map applies to a three-dimensional cubic domain defined by Cartesian coordinates 0 ≤ x ≤ 1, 0 ≤ y ≤ 1 and 0 ≤ z ≤ 1. The map operation relocates the points of the domain as shown in Fig. 2. First, new x and y coordinates are generated. Then, the x and y coordinates of the points falling outside the initial cubic domain are suitably rescaled to fulfil the conditions 0 ≤ x ≤ 1, 0 ≤ y ≤ 1 and 0 ≤ z ≤ 1. The volume remains constant.
 | ||
| Fig. 2 Schematic description of the deformation map operation. (1) Selection of the point A of coordinates (xi;yi). (2) Identification of its chemical nature. (3) Evaluation of the new coordinate xi+1 from the initial one xi. (4) Rescaling of the coordinate xi+1 to keep the point A within the domain. (5) Evaluation of the new coordinate yi+1 from the initial one yi. (4) Rescaling of the coordinate yi+1 to keep the point A within the domain. | ||
When the cubic domain is divided in two, or more, sub-domains that correspond to different chemical substances A and B, the reiterated application of the map gives rise to co-deformation patterns. A few co-deformation patterns for the equimolar binary case can be seen in Fig. 3.
 | ||
| Fig. 3 Co-deformation patterns generated by application of the deformation map to an equimolar binary mixture of chemical species A (white) and B (black). The initial configuration (a) is shown together with configurations obtained after 1 (b), 3 (c) and 5 (d) map iterations. (e) A three-dimensional view of the cubic element in panel (b). | ||
As the number of iterations i increases, configurations become more and more intricate, reminding the co-deformation patterns obtained by advection during the flow deformation of fluids.12
We use the non-linear shear-transformation map to describe the co-deformation processes occurring in the volumes v* involved in CLCs 1, 2,…, i,… times. Specifically, the number of map iterations, i, is set equal to the number of CLCs undergone by volumes v*. In this way, we univocally correlate co-deformation and CLCs.
We carried out calculations making any volume v* correspond to a cubic domain including N = 4096 × 4096 × 4096 cubic units. We assume that these cubic units contain a single molecular unit each. For sake of illustration, let us consider chemical species A and B similar to glucose in size. Therefore, they have a molar volume of about 117 cm3 mol−1, which means that molecular volume is around 1942 nm3. It follows that the corresponding cubic units have side approximately equal to 12.5 nm. Thus, if we consider two sub-domains of A and B divided by a flat interface parallel to two faces of the cubic volume, the interface area separating the sub-domains is equal to about 2.6 × 10⁹ nm2. The whole domain has volume v* equal to about 1.3 × 10¹⁴ nm3, which corresponds to about 1.3 × 10⁻⁴ mm3.
It is worth noting that the mechanical processing of organic compounds is commonly carried out using small amounts of powder ranging from a few grams to milligrams. For molecules similar to glucose, 3 mg corresponds approximately to a total volume V of 2 mm3. We can expect that the volume fraction of powder subjected to CLCs during individual impacts, κ, is quite small. If we assume that it is equal to 1 × 10⁻³, the total volume of powder involved in CLCs per impact, v, is equal to about 2 × 10⁻³ mm3. Therefore, the number η of volumes v* undergoing CLCs per impact is equal to about 15.
Starting from the considerations mentioned above, we can readily calculate the increase of interface area, S, due to the mixing of chemical species A and B during individual impacts. It can be expressed by an equation similar to eqn (4), namely
 | (6) |
In eqn (6), S(m) represents the total interface area generated as a function of the number of impacts, m, and Si is the interface area associated with the volume fractions that have undergone CLCs i times, χi(m).
The different Si values can be easily generated by iterating the deformation map described by eqn (5a)–(5c). After each iteration, we simply evaluate the number of cubic units belonging to different chemical species A and B that are in contact with each other. Specifically, we consider two cubic units in contact when they have at least one face in common. Then, under the assumption that cubic units have sides 12.5 nm long, we calculate the pertinent Si values.
The Si values obtained for the equimolar mixture of chemical species A and B shown in Fig. 3 are plotted in Fig. 4a as a function of the number of CLCs, i. It can be seen that Si increases smoothly with the number of CLCs. Starting from the initial value of about 2.6 × 10⁹ nm2, the Si estimates arrange according to a sigmoidal curve, reaching a plateau value around 1.1 × 10¹³ nm2 after about 15 CLCs. Such plateau value is not far from the maximum interface area that can be obtained by a three-dimensional chessboard-like arrangement of alternating cubic units of chemical species A and B, which is equal to about 2.1 × 10¹³ nm2. Therefore, we can draw the conclusion that co-deformation eventually results in an effective forced mixing on the molecular scale.
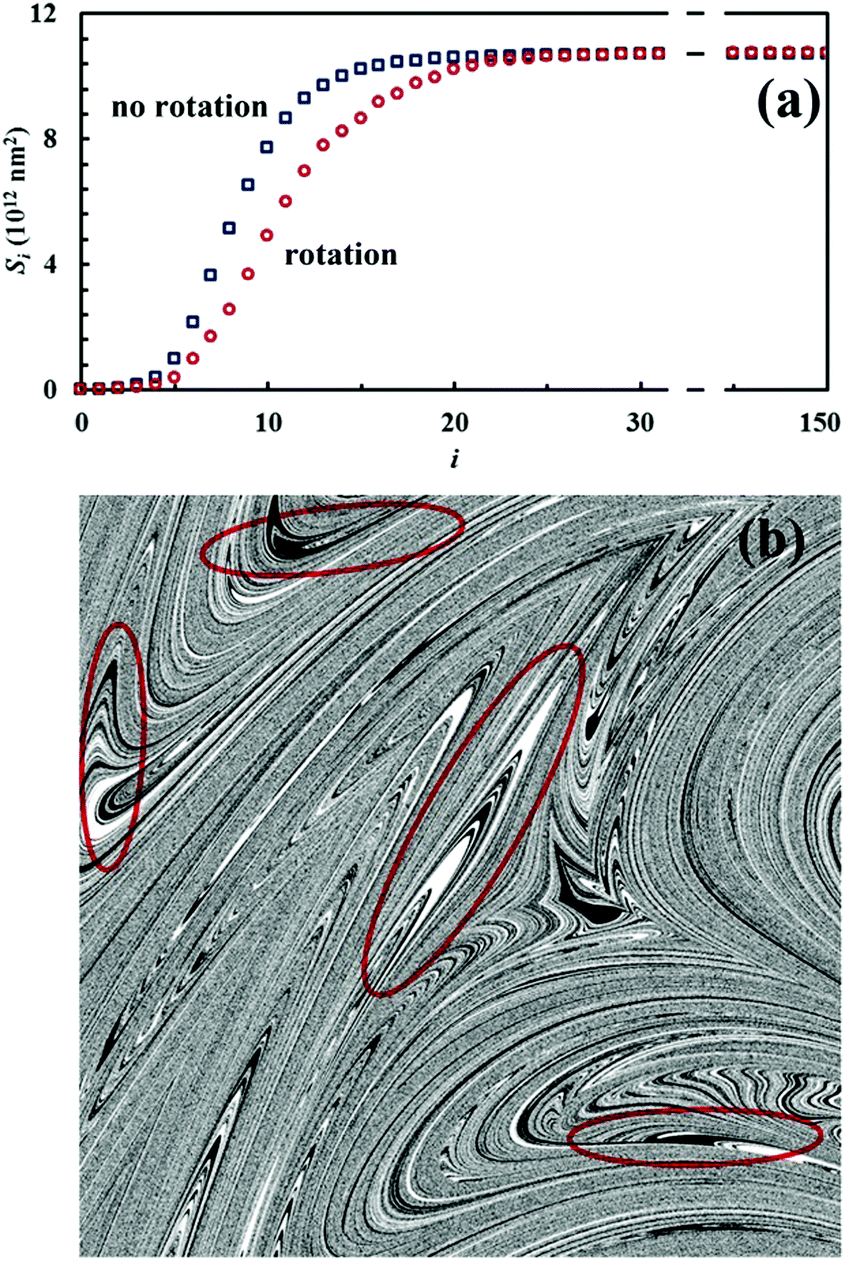 | ||
| Fig. 4 (a) The Si values obtained as a function of the number of CLCs, i. Data refer to the equimolar mixture of chemical species A (white) and B (black). Datasets have been evaluated with and without random rotation. (b) Mixing pattern generated by application of the deformation map to an equimolar binary mixture of chemical species A and B in the presence of random rotation. The configuration has been obtained after 15 map iterations. Red ellipses are used to highlight vorticities. | ||
Nevertheless, it is worth noting that the application of the non-linear shear-transformation map to a static domain does not exactly mirror the usual mechanical processing conditions met by powder during ball milling. These make the impacts occur stochastically and the powder can be expected to be trapped between colliding surfaces, and possibly undergo CLCs, with random orientation. For this reason, it is preferable to add a degree of freedom to our simulations, allowing the domain to randomly rotate by 90°, 180°, 270° or 360° around its central axis between any two consecutive iterations of the deformation map. The Si values obtained with the same initial configuration shown in Fig. 2, but with the addition of random rotation, are also shown in Fig. 4a.
Overall, differences between the Si values obtained with and without random rotation are small. However, it can be easily seen that mixing is more effective in the absence of random rotation and that the mixing rate is correspondingly enhanced. We explain this apparent inconsistency with the fact that random rotation introduces unpredictable dynamics that eventually leads to the formation of vorticities. An example is shown in Fig. 4b, where vortices are visible already after 15 map iterations. The regions involved in vorticity exhibit considerable persistence, with a reduction in the forced mixing rate of the cubic units that participate in the collective motion. The observed persistence, and the associated deceleration of the co-deformation process, have immediate effects on the interface area generation, which takes place at a lower rate.
The mixture composition, i.e. the relative size of the sub-domains of the different chemical species A and B, affects the Si plateau value, Sfin. Relevant data are plotted in Fig. 5 as a function of the initial volume fraction of chemical species A, α0,A. It can be seen that Sfin increases starting from zero, reaches a maximum Sfin,max for the equimolar mixture and, then, decreases to zero again.
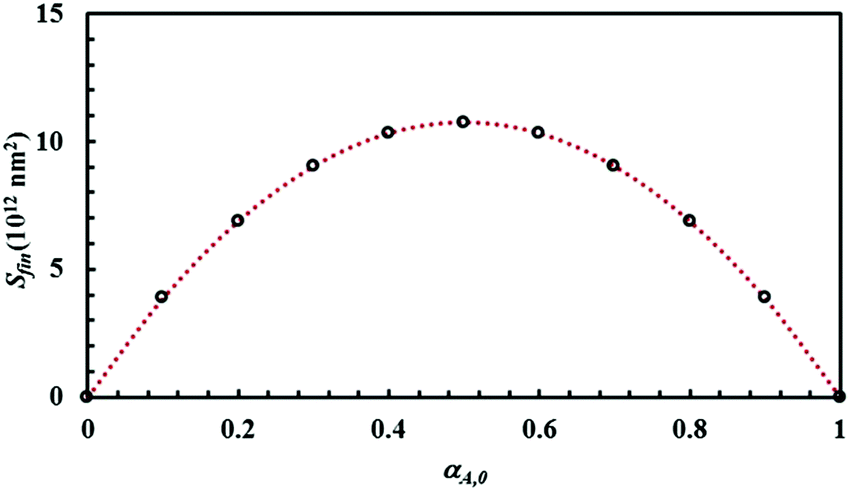 | ||
| Fig. 5 The Si plateau value, Sfin, as a function of the initial volume fraction of chemical species A, α0,A. Best-fitted curve is also shown. | ||
Data can be best fitted by the equation
| Sfin = 4Sfin,maxα0,Aα0,B, | (7) |
Chemical changes during impacts
The occurrence of a chemical reaction at the interface between chemical species A and B significantly modifies the scenario discussed heretofore. New chemical products form at the interface and progressively reduce the interface area available to chemical reaction. Accordingly, the reaction rate also depends on the interplay between the generation of new interface area, due to the co-deformation process, and the generation of new chemical species, due to the chemical reaction at the interface.We investigated this new scenario by assuming that any pair formed by cubic units of different chemical species A and B that have at least one face in common can react with a probability 0 ≤ Π ≤ 1. When the chemical reaction occurs, both reactants A and B transform into product C as schematically shown in Fig. 6.
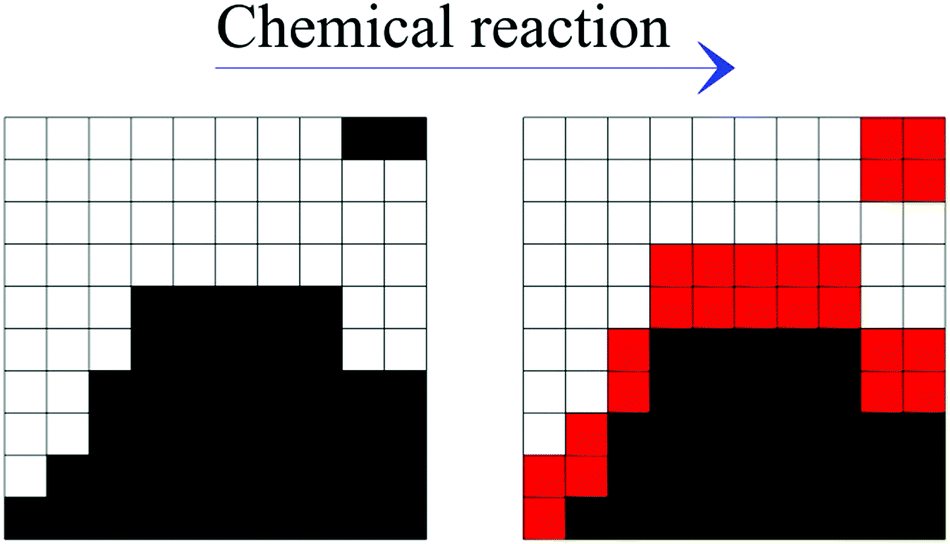 | ||
| Fig. 6 Schematic description of the transformation (from left to right) of reactants A (white) and B (black) that have come into contact at the interface into product C (red) as a consequence of map iterations. | ||
Therefore, the chemical equation can be written as
| A + B → 2C. | (8) |
In the initial stages, and as far as an interface is clearly distinguishable, the chemical reaction can be expected to remain confined to the interface separating the segregated chemical species. Then, once the contacts between the chemical species have been enhanced due to the repeated flow deformation induced by CLCs, the chemical reaction can be expected to involve the whole volume affected by CLCs.
More complicated scenarios can emerge in the presence of three chemical species. In this respect, we chose focusing on the case study in which three reactants A, B and C are mixed together since the beginning. The chemical species A and B react, with probability 0 ≤ Π1 ≤ 1, to form the intermediate D. In turn, the chemical species C reacts with D to form the final product E with a probability 0 ≤ Π2 ≤ 1. Thus, the overall reaction can be described as follows:
| A + B → 2D; | (9a) |
| C + D → 2E. | (9b) |
Eqn (9a) and (9b) describe a consecutive reaction kinetics that involves the chemical species D as an intermediate between reactants A and B and final product E. To our eyes, this reaction scheme is particularly interesting. First, the additional reactant C can reduce the interface area available to the reaction between A and B and, then, reduce the reaction rate of the first reaction step. Second, the reaction probabilities Π1 and Π2, which can be reasonably expected to differ from each other, determine the persistence of the intermediate D. Finally, co-deformation disperses the chemical species C and D in the reaction volume, thus indicating how effectively dispersoids mix up with other chemical species.
All of these points have practical relevance. Numerous organic reactions involve, indeed, consecutive steps or the addition of catalytic amounts of liquid phases that have to be effectively dispersed into the reacting mixture. On the one hand, we show how the concentration of intermediate species evolves in the presence of effective forced mixing. On the other, we provide useful insight into the details of the co-deformation and forced mixing processes and the way they affect the chemical behaviour.
Simulations are performed according to the iterative scheme below:
(1) Initial configuration is generated, the chemical composition being determined by the relative number of cubic units belonging to different chemical species;
(2) The configuration is rotated randomly based on a simple random number extraction;
(3) The deformation map is applied and the cubic units relocated according to eqn (5a)–(5c), thus generating a new configuration;
(4) Interface area is evaluated by counting the faces of cubic units belonging to different chemical species that are in contact with each other;
(5) A fraction of the cubic units of different chemical species that are in contact with each other, numerically equal to the reaction probability considered, is transformed into a new chemical species based on a simple random number extraction;
(6) Steps 2 to 6 are reiterated.
In the following, we describe and discuss the chemical reaction in binary and ternary systems carrying out a systematic variation of chemical composition and reaction probabilities.
Reaction kinetics in binary systems
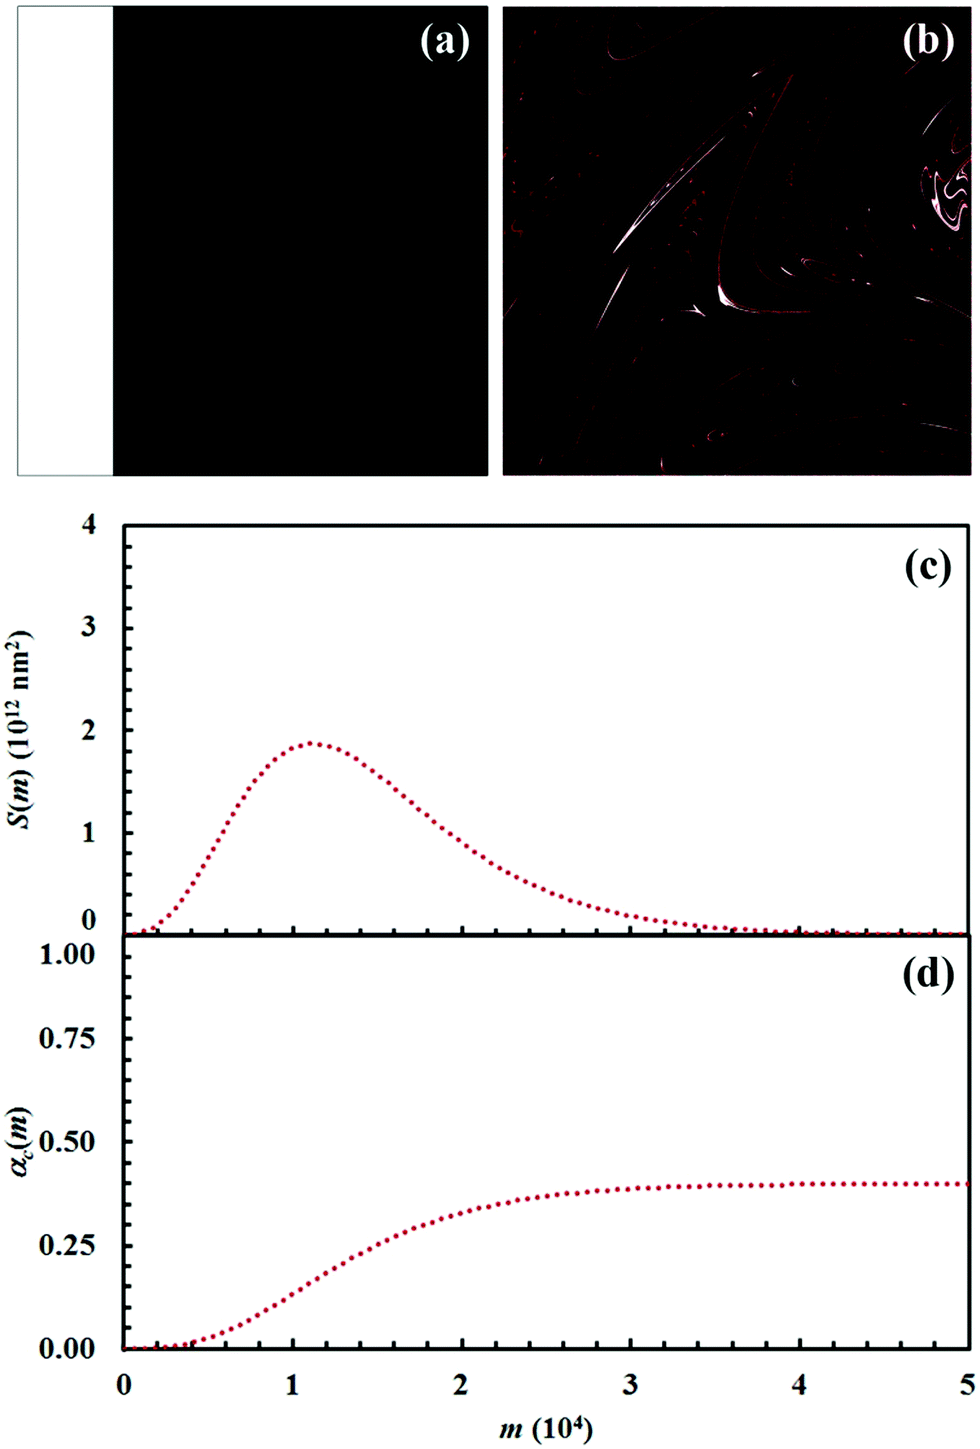
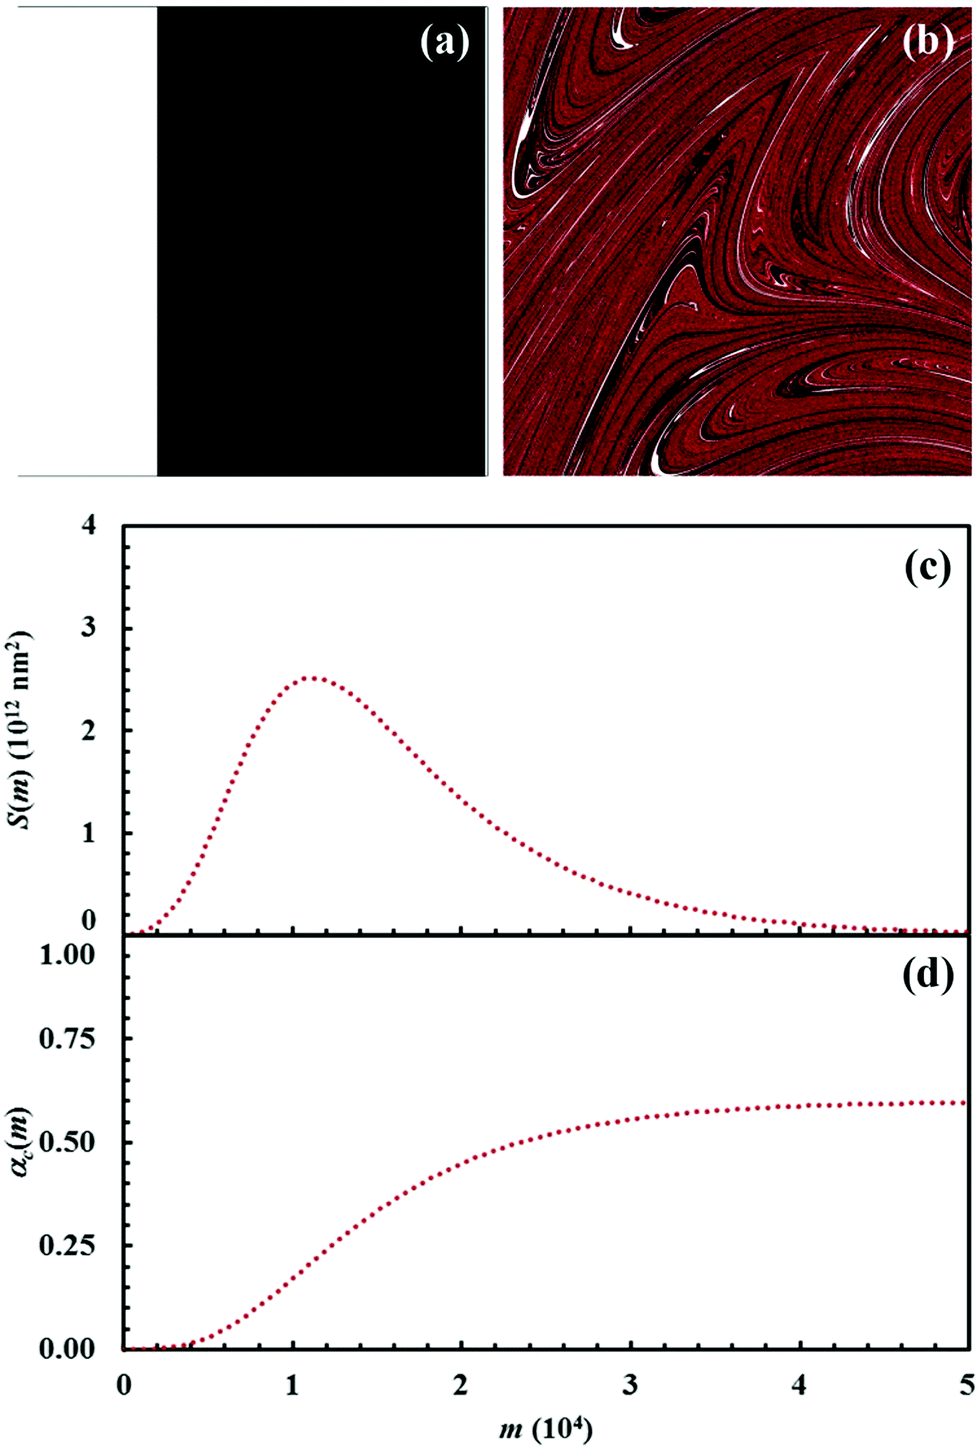
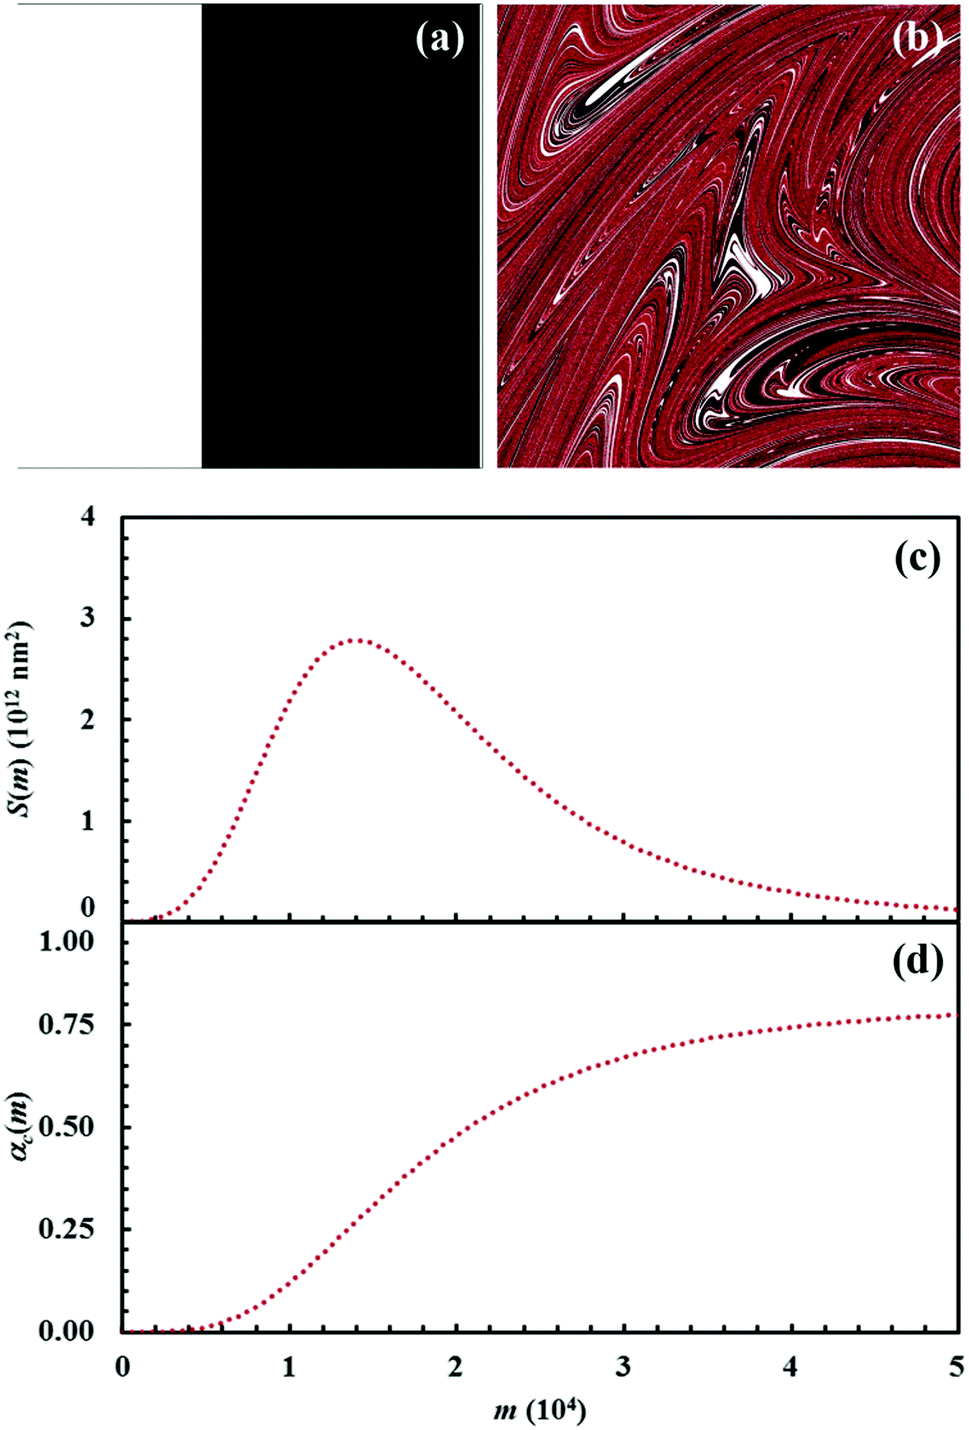
The initial configuration and the configuration after 15 impacts, the interface area between reactants A and B, S(m), and the kinetic curves are shown in Fig. 7 for the chemical composition identified by the α0,A value equal to 0.1. Analogous data are shown in Fig. 8–11 for the α0,A values equal to 0.2, 0.3, 0.4 and 0.5 respectively. Calculations have been carried out assuming that the reaction probability, Π, takes a value of 0.1.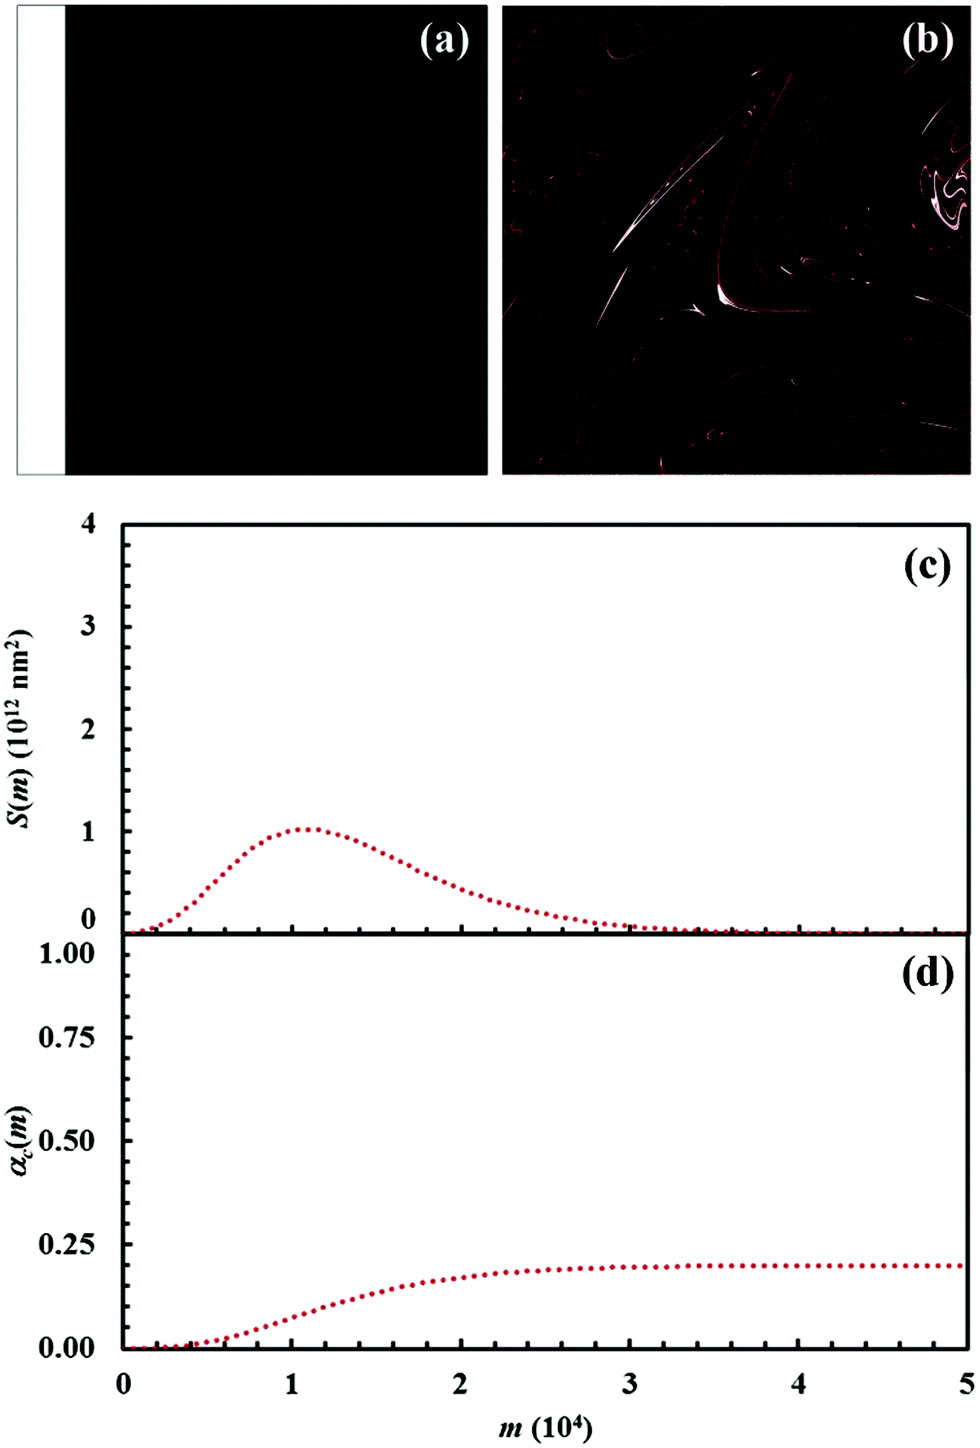 | ||
| Fig. 7 (a) Initial configuration (A, white; B, black) and (b) the configuration after 15 impacts (C, red). (c) Interface area between reactants A and B, S(m), and (d) conversion degree of the product C, αC(m), as a function of the number of impacts, m. Data refer to the chemical compositions identified by an α0,A value equal to 0.1. | ||
 | ||
| Fig. 8 (a) Initial configuration (A, white; B, black) and (b) the configuration after 15 impacts (C, red). (c) Interface area between reactants A and B, S(m), and (d) conversion degree of the product C, αC(m), as a function of the number of impacts, m. Data refer to the chemical compositions identified by an α0,A value equal to 0.2. | ||
 | ||
| Fig. 9 (a) Initial configuration (A, white; B, black) and (b) the configuration after 15 impacts (C, red). (c) Interface area between reactants A and B, S(m), and (d) conversion degree of the product C, αC(m), as a function of the number of impacts, m. Data refer to the chemical compositions identified by an α0,A value equal to 0.3. | ||
 | ||
| Fig. 10 (a) Initial configuration (A, white; B, black) and (b) the configuration after 15 impacts (C, red). (c) Interface area between reactants A and B, S(m), and (d) conversion degree of the product C, αC(m), as a function of the number of impacts, m. Data refer to the chemical compositions identified by an α0,A value equal to 0.4. | ||
 | ||
| Fig. 11 (a) Initial configuration (A, white; B, black) and (b) the configuration after 15 impacts (C, red). (c) Interface area between reactants A and B, S(m), and (d) conversion degree of the product C, αC(m), as a function of the number of impacts, m. Data refer to the chemical compositions identified by an α0,A value equal to 0.5. | ||
It can be seen that 15 CLCs are always sufficient to induce a significant forced mixing of reactants A and B and product C. The formation of product C deeply affects the generation of the interface area between reactants A and B. Similar to the case in which no reaction occurs between A and B, described in Fig. 4a, the interface area initially undergoes rapid growth. However, the gradual formation of C progressively reduces the interface area available to reaction, thus determining the attainment of a maximum and, subsequently, a significant decrease. This behaviour has immediate consequences on the rate of the chemical reaction between A and B. The kinetic curve is invariably sigmoidal and the final plateau value depends on the chemical composition.
The deep link between interface area and reaction rate can be seen from Fig. 12, where S(m) and the first derivatives of the kinetic curve describing the formation of product C, dαC(m)/dm, are plotted as a function of the number of impacts, m. For brevity, we only show the curves referring to the mixtures with chemical compositions identified by the α0,A values equal to 0.1, 0.3 and 0.5.
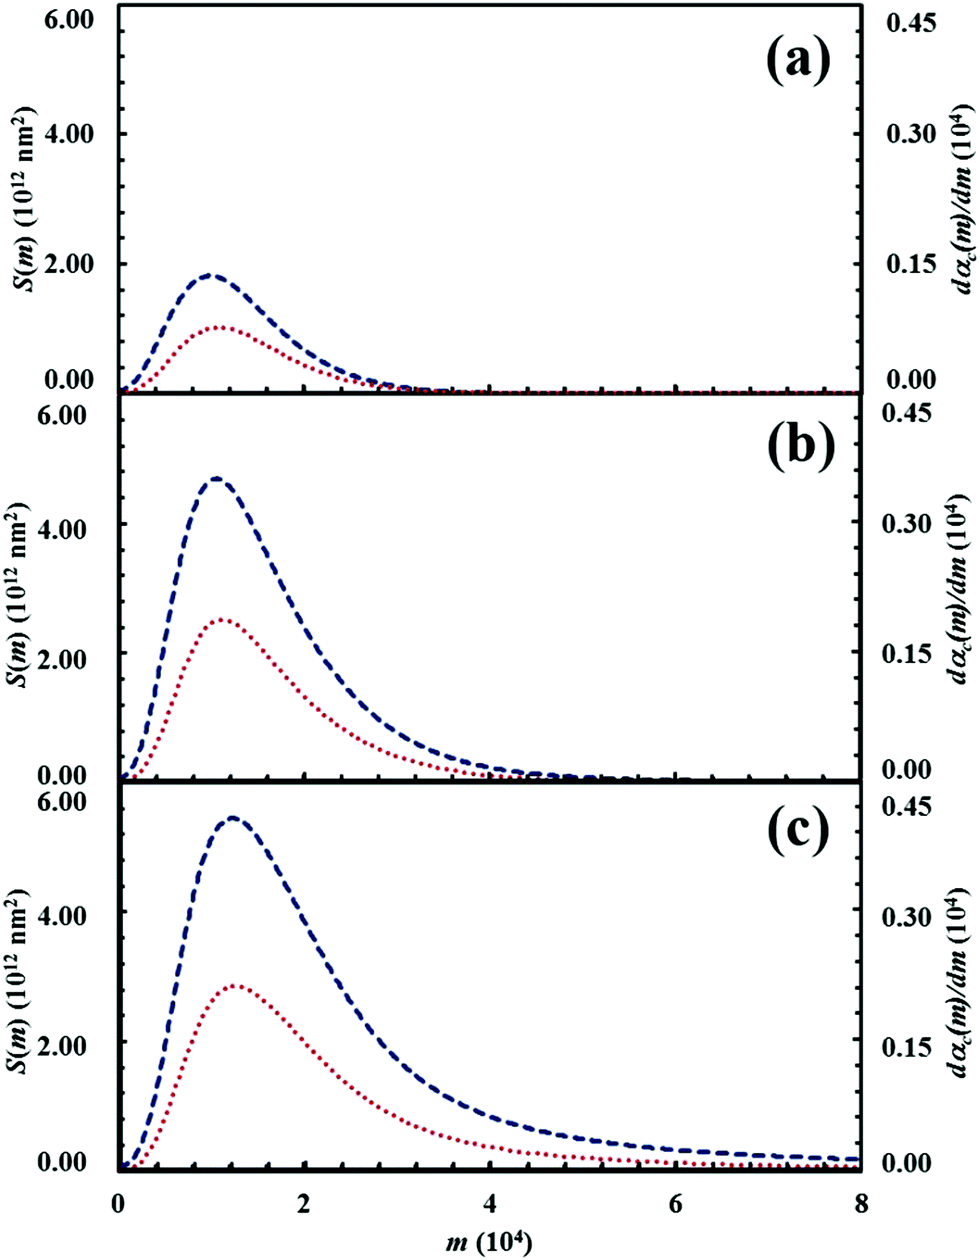 | ||
| Fig. 12 The interface area between reactants A and B, S(m) (lower, red curve), and the first derivative of the kinetic curve describing the formation of product C, dαC(m)/dm (upper, blue curve), as a function of the number of impacts, m. Data refer to the mixtures with chemical compositions identified by the α0,A. values equal to (a) 0.1, (b) 0.3 and (c) 0.5. | ||
The dαC(m)/dm. curves have exactly the same shape as the S(m) ones. As expected, both curves reach the maximum values after the same number of impacts have occurred. This means that the reaction rate is, somehow, proportional to the interface area available to reaction. This can be easily seen from Fig. 13, where the first derivative of the kinetic curves is shown as a function of the total interface area between reactants A and B. In all cases, data give rise to a curve resembling a closed loop.
 | ||
| Fig. 13 The first derivative of the kinetic curve describing the formation of product C, dαC(m)/dm, as a function of the interface area between reactants A and B, S(m). Data refer to the mixtures with chemical compositions identified by the α0,A values equal to (a) 0.1, (b) 0.3 and (c) 0.5. Arrows indicate the way the loop develops during the transformation. | ||
In the very initial stages, the reaction rate is proportional to the interface area. In this regard, let us refer to eqn (4). Taking into account eqn (1), it can be rewritten as
 | (10) |
After a single impact has taken place, m is equal to 1. The fraction of powder involved in CLCs once, χ1(1), is equal to κ. The interface area between reactants A and B in the volume v involved in CLCs changes from its initial value, S0, to the one determined by the first flow deformation process undergone by the powder and described by the first iteration of the deformation map, S1. The amount of product C formed after reactants have undergone CLCs once, α1, is proportional to the product between the reaction probability, Π, and the interface area available to reaction, S1. It follows that the degree of chemical conversion after the very first impact is
| αC(1) ∝ κS1Π. | (11) |
Eqn (11) clearly shows that the initial slope of the curves in Fig. 13 is proportional to the product κΠ.
Immediately after the first impact, statistical factors affect the shape of the kinetic curve. In addition, mixing rapidly determines the generation of new interface area available to the reaction between A and B. In later stages, the formation of the product C and the consequent decrease of interface area between A and B depress the reaction rate. Therefore, the proportionality between αC(m) and the κ, S1 and Π quantities is partially lost.
The effects of reaction probability, Π, on the chemical reaction can be inferred from the data shown in Fig. 14. Data refer to the equimolar composition and have been obtained giving Π the values of 0.001, 0.01, 0.1, 0.5 and 1. We remark here that this latter Π value refers to the case in which reactants A and B react as soon as they come into contact at the interface.
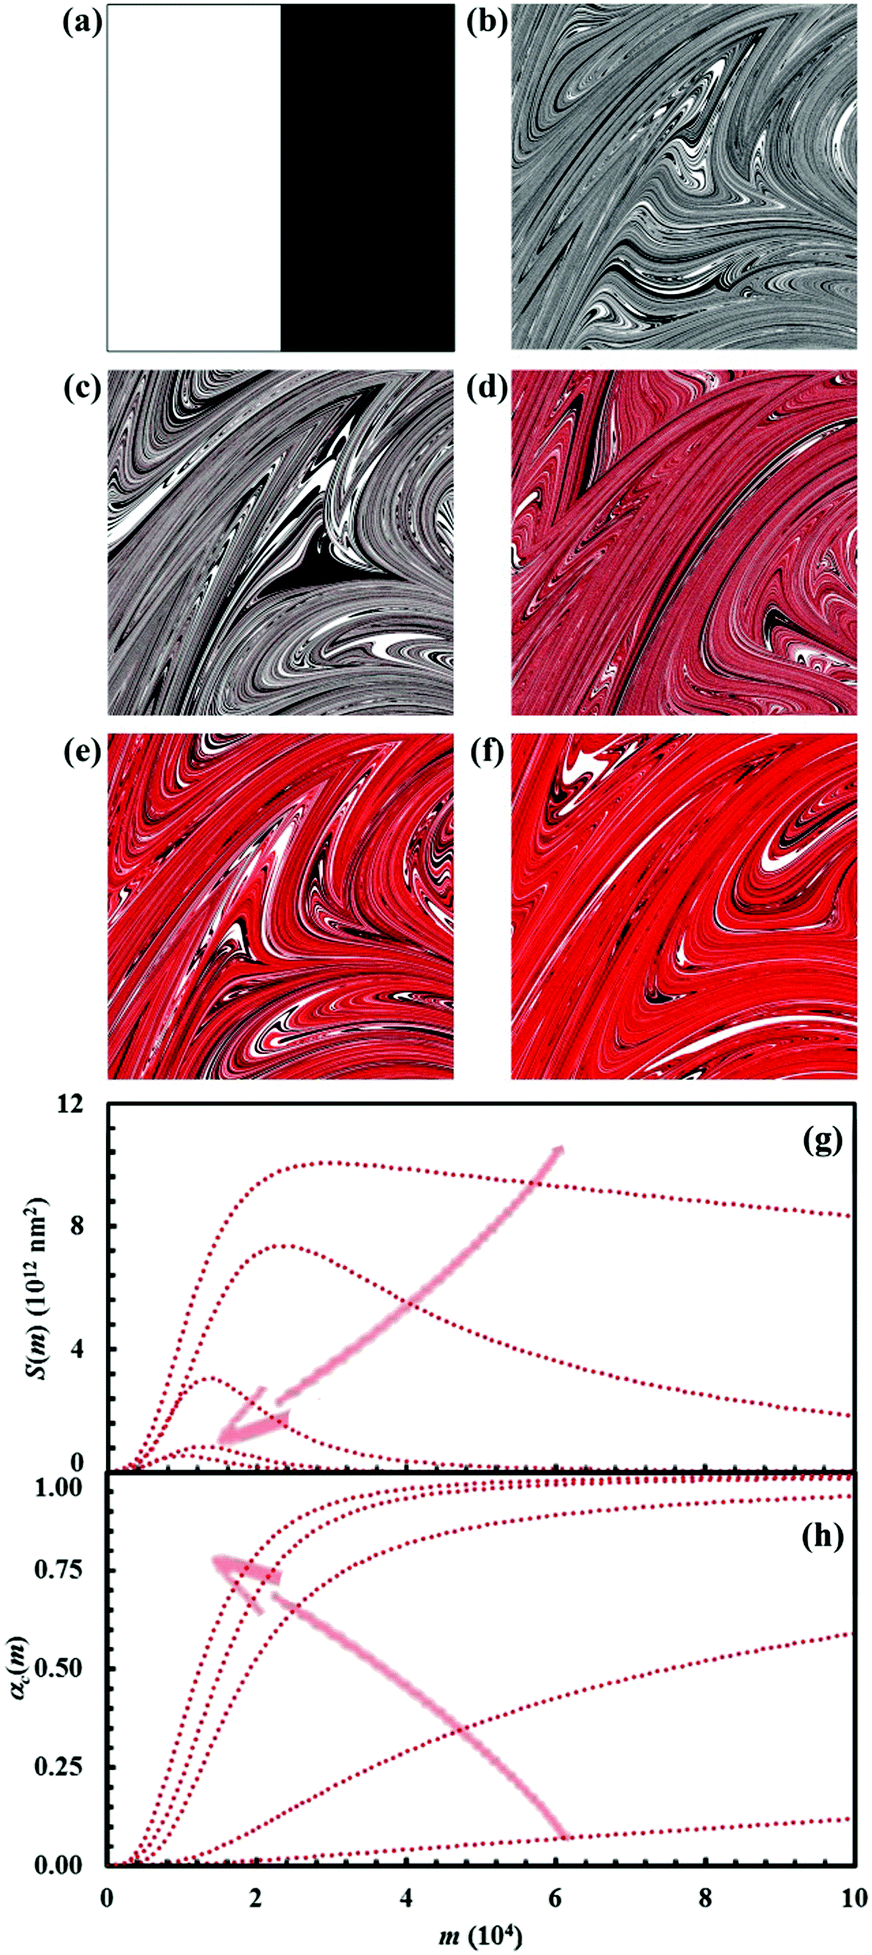 | ||
| Fig. 14 (a) Initial configuration (A, white; B, black). The configurations after 15 impacts (C, red) for the case studies in which the reaction probability, Π, was given a value equal to 0.001 (b), 0.01 (c), 0.1 (d), 0.5 and 1.0 (f). (g) Interface area between reactants A and B, S(m), and (h) conversion degree of the product C, αC(m), as a function of the number of impacts, m, for the different cases investigated. The reaction probability, Π, increases, as indicated by the arrows, from the upper to the lower curves in panel (g) and from the lower to the upper curves in panel (h). | ||
According to general expectations, the reaction rate increases as the reaction probability Π increases. For the smallest Π values, the formation of the product C proceeds at very low rate. As a consequence, mixing takes over and the interface area S(m) can reach values considerably larger than those observed in other cases. As Π increases, the maximum of the S(m) curve becomes smaller and smaller and shifts toward a smaller number of impacts m. Correspondingly, the kinetic curve αC(m) becomes steeper and steeper, thus indicating an increasingly faster chemical reaction.
Particularly noteworthy is the fact that the combination of co-deformation, forced mixing and chemical factors gives rise to marked differences in the kinetic curves. However, nothing has changed in terms of chemistry. The reaction takes place with the same mechanism. It is only the different conversion rate at the interface that makes the reaction kinetics apparently different.
Reaction kinetics in ternary systems
For brevity, calculations concerning the mixtures of three reactants have been restricted to three chemical compositions defined by the triplets of volume fractions α0,A, α0,B and α0,C of reactants A, B and C. The α0,A, α0,B and α0,C values have been suitably chosen to explore the chemical kinetics under sub-stoichiometric, stoichiometric and super-stoichiometric conditions. Accordingly, the first triplet of α0,A, α0,B and α0,C values is equal to 0.15, 0.15 and 0.70 respectively. The second and third triplets are, instead, equal to 0.25, 0.25 and 0.5, and to 0.35, 0.35 and 0.30 respectively. In all cases, the reaction probabilities between A and B, Π1, and between C and D, Π2, have been given the value of 0.1.The first triplet defines a chemical composition with reactant C in large excess, so that it cannot be completely consumed by the reaction with the intermediate D generated by the chemical reaction between reactants A and B. Therefore, the surplus of unreacted C and the final product E are destined to coexist once A, B and D are totally consumed. The stoichiometric case is accounted for by the second triplet, and it involves the total consumption of C by reaction with D and the corresponding formation of E. This is the only chemical species that can be observed at the end of the consecutive reactions in this case. Under super-stoichiometric conditions, reactants A and B are in large excess. This allows the total consumption of C, while the surplus of unreacted D coexists with the final product E once the consecutive reactions are complete.
The results obtained for the three chemical compositions are shown in Fig. 15. In the presence of reactant C in excess, the reaction between A and B at interface is significantly hindered.
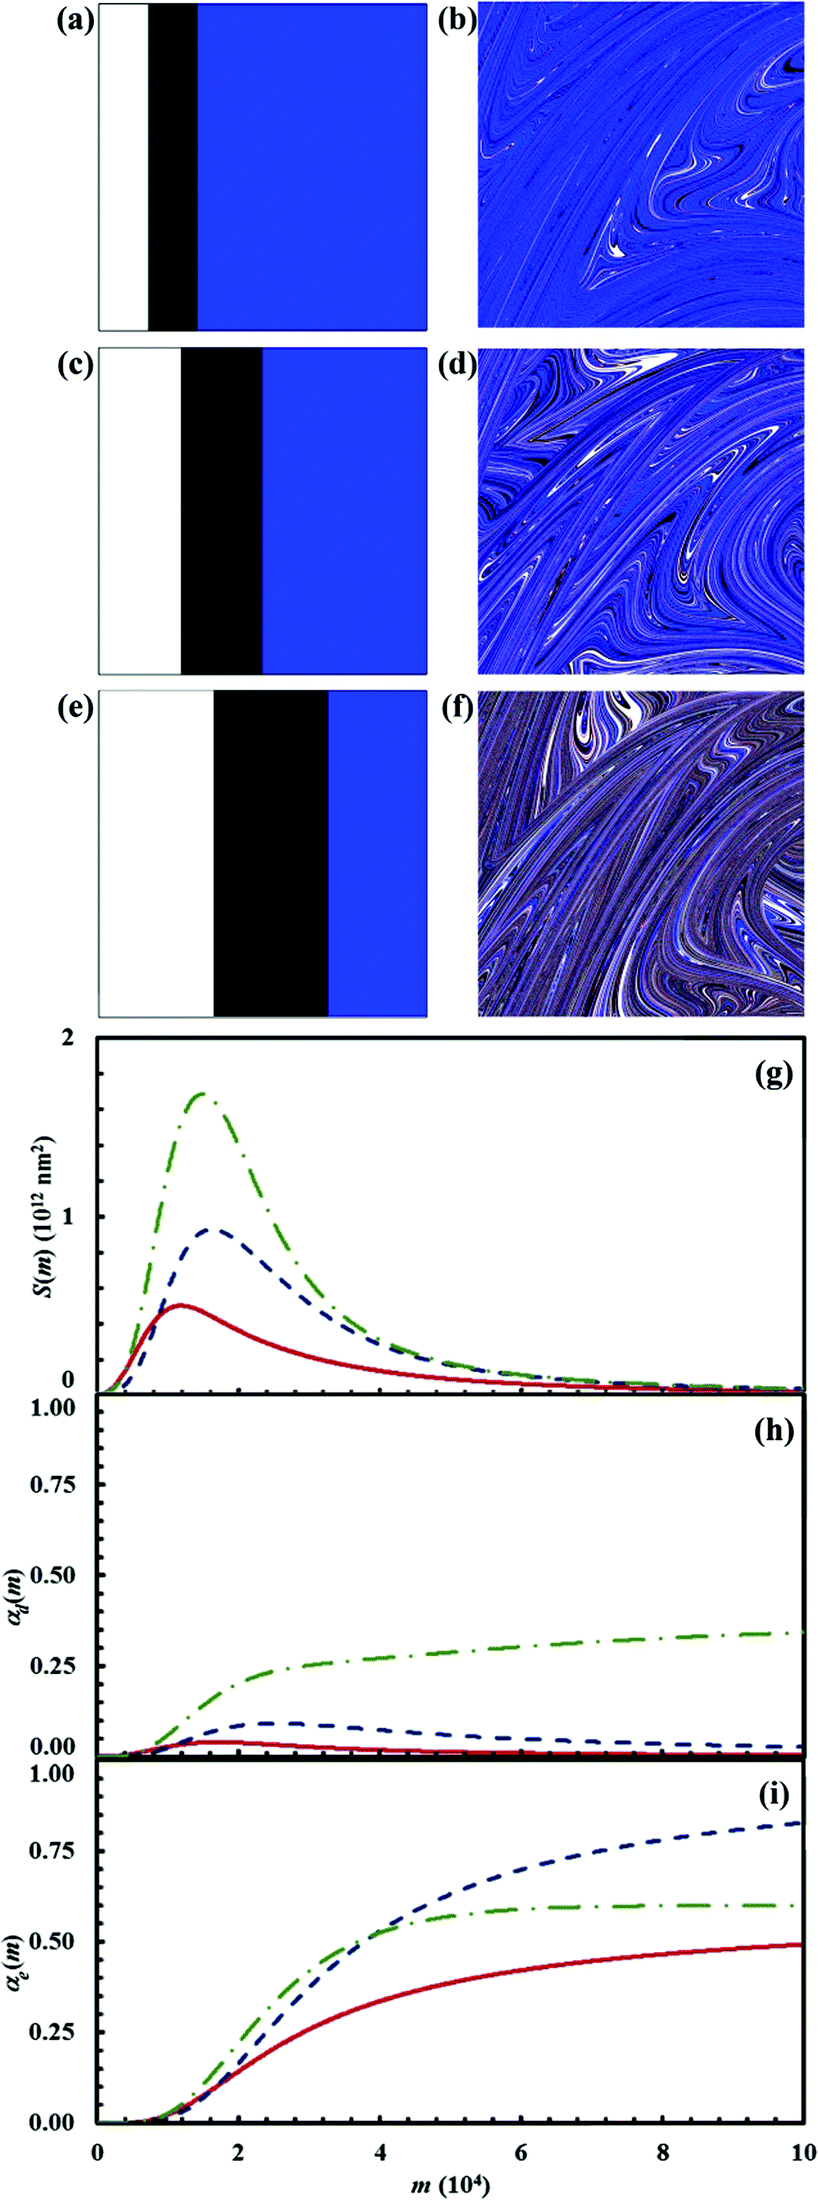 | ||
| Fig. 15 (a) Initial configuration (A, white; B, black; C, blue) and (b) the configuration after 15 impacts (D, red; E, green) for the chemical composition identified by α0,A, α0,B and α0,C values equal to 0.15, 0.15 and 0.70 respectively. (c) Initial configuration (A, white; B, black; C, blue) and (d) the configuration after 15 impacts (D, red; E, green) for the chemical composition identified by α0,A, α0,B and α0,C values equal to 0.25, 0.25 and 0.5 respectively. (e) Initial configuration (A, white; B, black; C, blue) and (b) the configuration after 15 impacts (D, red; E, green) for the chemical composition identified by α0,A., α0,B and α0,C values equal to 0.35, 0.35 and 0.30 respectively. (g) Interface area between reactants A and B, S(m), (h) conversion degree of the intermediate D, αD(m), and (i) conversion degree of the product E, αE(m), as a function of the number of impacts, m, for the different cases investigated. Solid (red), dashed (blue), and dash dotted (green) lines refer to the sub-stoichiometric, stoichiometric and super-stoichiometric cases respectively. | ||
The interface area S(m) between the two reactants remains quite small. The intermediate D is rapidly consumed by C with formation of the final product E. The interface area S(m) available to the chemical reaction between A and B becomes larger in the stoichiometric case. The amount of intermediate D formed is also larger. The reaction tends to completion, but the formation of the final product E is limited by mixing effects. Mixing effects are also evident in the super-stoichiometric case, where the amount of D generated by the chemical reaction between A and B exceeds the amount needed to consume C completely. In particular, it can be seen that the volume fraction of D keeps slowly increasing after most of E has been generated by reaction with C. This is simply due to the hindrance that residual reactants A and B experience at the interface, with the amount of D in excess and the final product E reducing the total interface area available to the reaction.
Reaction probabilities Π1 and Π2 deeply affect the lifetime of intermediate D. We investigated their effect for the stoichiometric composition defined by the triplet of α0,A, α0,B and α0,C values equal to 0.25, 0.25 and 0.5 respectively. In particular, we varied systematically Π2 between 0.001 and 1 while keeping Π1 equal to 0.1. Pertinent data are shown in Fig. 16. As expected, the lifetime of intermediate D decreases as Π2 increases. For very small Π2 values, the chemical reaction between A and B is almost complete before the intermediate D is sensibly consumed by the reaction with C. Under such circumstances, the two consecutive reactions proceed substantially independent of each other. Conversely, at relatively large Π2 values, the consumption of D by reaction with C is rapid enough to allow the final product E to reduce the interface area between A and B and affect their reaction rate.
 | ||
| Fig. 16 (a) Initial configuration (A, white; B, black; C, blue) and the configuration after 15 impacts (D, red; E, green) for the cases in which the reaction probability between C and D, Π2, was given the value equal to (b) 0.001, (c) 0.01, (d) 0.1, (e) 0.5 and (f) 1.0. (g) Interface area between reactants A and B, S(m), (h) conversion degree of the product D, αD(m), and (i) conversion degree of the product E, αE(m), as a function of the number of impacts, m. Data refer to the cases in which the reaction probability between C and D, Π2, was given the value equal to 0.001, 0.01, 0.1, 0.5 and 1.0. The reaction probability between C and D, Π2, increases, as indicated by the arrows, from the upper to the lower curves in panels (g) and (h), and from the lower to the upper curves in panel (i). | ||
Discussion
The results presented heretofore outline the kinetic scenarios that can originate, during ball milling, from the interplay of mixing and chemical processes in powder mixtures consisting of molecular solids prone to flow deformation.Being diffusion not allowed, interfaces remain sharp. Only shear deformation enables the constant increase and renewal of contacts between reactant species. This is what drives the chemical reaction to completion.
The overall reaction rate depends on three independent factors. On the one hand, the rate at which the reaction proceeds is related to the amount of powder subjected to CLCs during individual impacts and, then, to the statistical nature of the mechanical processing by ball milling. On the other hand, the conversion rate is unavoidably controlled by the rate at which reactant molecules react once they are in contact at the interface. Finally, the rate of the chemical transformation process is intrinsically dependent on the rate at which new interface area is generated by co-deformation. Concerning this latter factor, we remark that interface generation is intimately related to chemical composition.
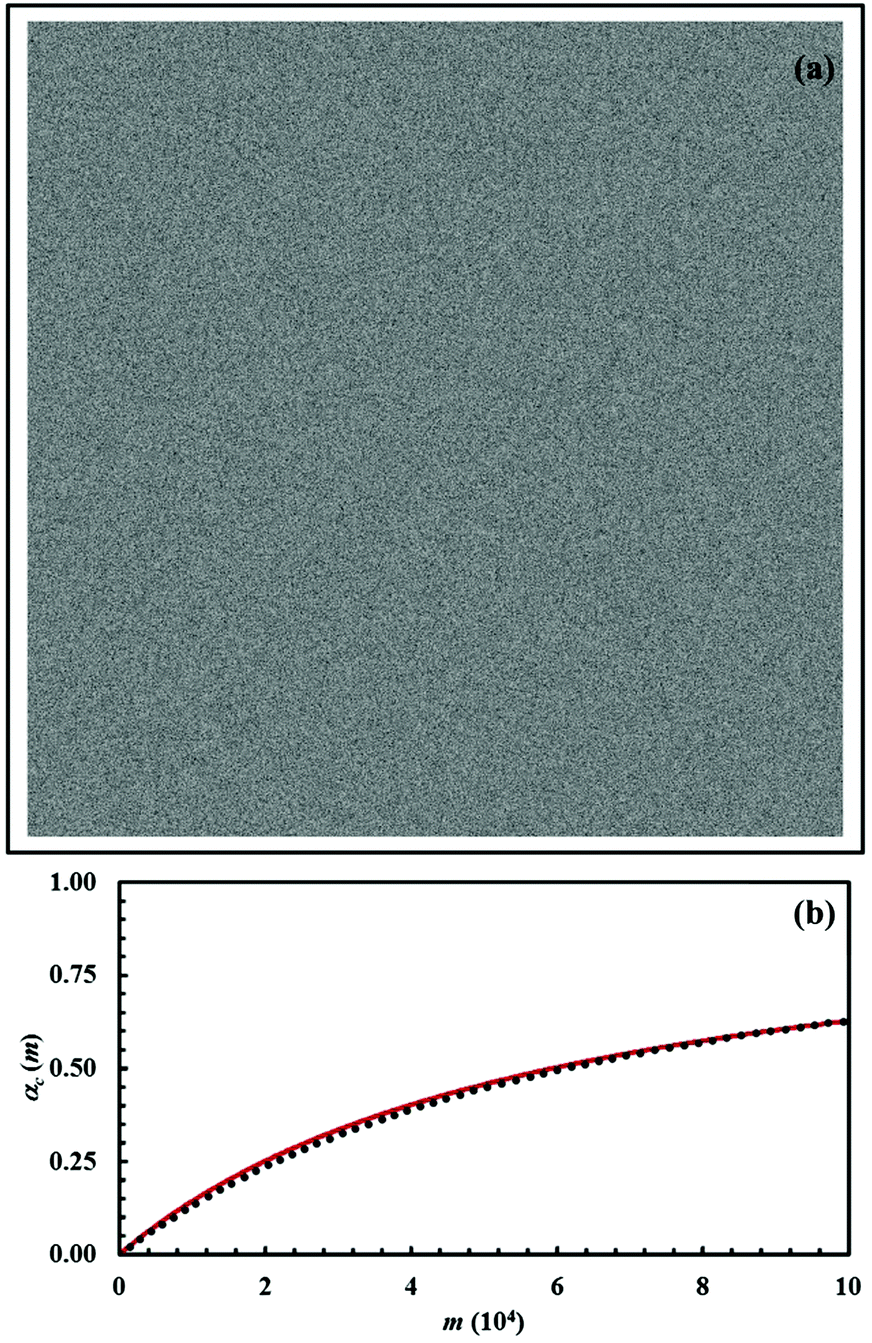
The amount of powder that undergoes CLCs during individual impacts, measured by the volume fraction κ, has a predictable effect on the overall transformation rate. The latter increases as κ increases. This can be clearly seen from Fig. 17, where a few representative kinetic curves are compared with each other.
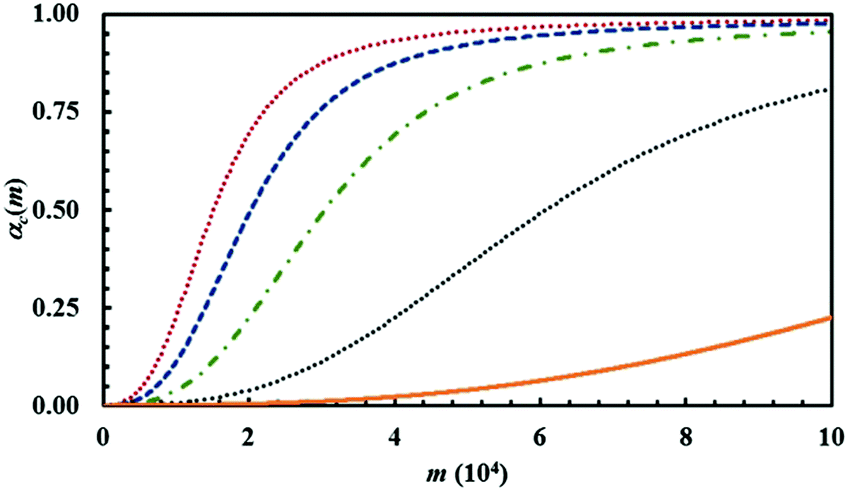 | ||
| Fig. 17 The conversion degree of the product C, αC(m), as a function of the number of impacts, m. Data refer to the binary case with chemical composition identified by an α0,A value equal to 0.5. The curves have been obtained using a reaction probability, Π, of 0.5 and the κ values of 1.0 × 10⁻⁴, 2.5 × 10⁻⁴, 5.0 × 10⁻⁴, 7.5 × 10⁻⁴ and 1.0 × 10⁻³. The volume fraction of powder that is subjected to CLCs per impact, κ, increases from the lower curve to the upper one. | ||
The curves have been obtained using the same set of Si values that refers to the equimolar mixture of chemical species A and B, while varying κ between 1 × 10⁻⁴ and 1 × 10⁻³. The reaction probability between A and B molecules facing with each other at the interface, Π, was kept constant at 0.5.
While the variation of κ has a marked effect on the overall transformation rate, it does not affect the shape of the kinetic curves. Rather, the curves can perfectly overlap if the abscissae are properly re-scaled, i.e. if the number of impacts referred to a specific curve is multiplied by a suitable numerical factor (not shown for brevity). It follows that the shape of the kinetic curve is mostly determined by co-deformation and forced mixing processes and interface chemistry. More specifically, it is determined by the relative rates at which co-deformation and forced mixing processes and the chemical reaction at the interface proceed.
In this respect, we note that we have always used the same deformation map, which implies that the co-deformation and forced mixing processes takes place always at the same rate. However, we have changed systematically the value of the reaction probability Π. Let us keep focused on the equimolar binary mixture. The numerical findings clearly suggest that forced mixing is the rate-limiting process when Π takes the highest values. In this case, the reaction at the interface is almost immediate and the chemical transformation needs new interface area to progress. Conversely, forced mixing predominates for very small Π values. Under these circumstances, the reactants A and B reach very high degrees of mixing well before any significant chemical conversion.
A Damköhler number can be defined taking into account the rates of interface area generation and chemical reaction in individual volumes v*. Concerning the former process, illustrated in Fig. 4a, its initial steps can be satisfactorily described with an exponential dependence of Si on the number of CLCs, i. Specifically,
| Si ≈ Sinexp(ri), | (12) |
| ΔSi ≈ rSinexp(ri). | (13) |
Along the same line, the initial reaction rate can be expressed as
| Δαi ≈ ΠSinexp(ri)/(sABN), | (14) |
It follows that we can express the Damköhler number, Da, as
| Da = Δαi/ΔSi = ΠSfin/(rsABN), | (15) |
The best fitting of the initial portion of the Si curve (with random rotation) in Fig. 4a with eqn (12) (not shown for brevity), indicates that the interface area generation rate, r, is approximately equal to 0.08. If we restrict to the equimolar mixture, data in Fig. 5 show that the final value of interface area, Sfin, is equal to about 1.1 × 10¹³ nm2. Since the side length of any cubic unit is equal to 12.5 nm, the interface area associated with any contact between A and B molecules, sAB, equals approximately 156 nm2. Thus, the Damköhler number substantially depends linearly on the reaction probability at the interface, Π, as shown below:
| Da ≈ 12.8Π. | (16) |
The case in which Π is small, i.e. co-deformation and forced mixing processes are much faster than chemical reaction, immediately recalls the classical second-order kinetics of a chemical reaction between reactants A and B taking place in solution. The kinetic law can be simply expressed as1
| αC(t) = Kt(1 + Kt)−1, | (17) |
We can expect that a similar kinetic law is valid for the mechanochemical reaction between A and B described by eqn (8) provided that mixing is much faster than the chemical reaction. To test this hypothesis, we have generated a configuration with the reactants A and B well mixed starting from the initial configuration with equimolar composition having the chemical species segregated. To this aim, we have carried out 150 iterations of the deformation map. During these iterations, the reactants A and B were not allowed to react with each other to form the product C. The resulting configuration is shown in Fig. 18a.
 | ||
| Fig. 18 (a) Initial mixed configuration (A, white; B, black). (b) The conversion degree of the product C, αC(m), as a function of the number of impacts, m. Data refer to the chemical composition identified by the α0,A value equal to 0.5. Best-fitted curve is shown (solid, red line). | ||
It can be seen that the chemical species A and B are dispersed over the whole volume of the cubic volume and well mixed with each other. We used this configuration as the starting configuration for the mechanochemical reaction between A and B. We evaluated the conversion degree of the product C, αC(m), assuming that the volume fraction of powder affected by CLCs, κ, is equal to 1 × 10⁻³ and that the reaction probability at the interface, Π, is equal to 0.01. The obtained αC(m) curve is shown in Fig. 18b as a function of the number of impacts, m. The curve exhibits a smooth, monotonic increasing trend quite different from the sigmoidal one shown in Fig. 11, which refers to the mechanochemical reaction between initially segregated reactants.
Data in Fig. 18b can be best-fitted using a second-order kinetic law. To this aim, we have re-written eqn (17) as
| αi = ki(1 + ki)−1, | (18) |
It is worth noting, however, that this is a highly idealized situation that can seldom occur in mechanochemical processes. Mixing in the solid state, and even more forced mixing, are always likely to occur on relatively long time scales, which implies, by default, that any chemical reaction at the interface starts well before mixing is complete.
The scenario changes drastically if the mechanical stresses, and the resulting shearing and mechanical energy deposition, induce the local melting of powder volumes. The formation of molten phases while shearing occurs, even for very short time intervals, can eventually give rise to much higher mixing degrees, typically not attainable by the simple co-deformation of solid phases. It follows that the chemical transformation processes can experience significant intensification. However, it is matter of debate whether or not the resulting chemistry has to be classified as a form of mechanochemistry.
Turning our attention to experimental evidence in the field, we can say that our results compare, in principle, remarkably well with the experimental findings reported in the literature. In particular, our simulations are seemingly able to reproduce most of the experimentally kinetic curves obtained for binary mixtures,14 thus providing a more fundamental interpretation.
Although a critical review and a detailed analysis of the experimental findings are out of the scope of the present work, it is worth focusing on their possible interpretation based on our kinetic model. Once more, for brevity and convenience we restrict our analysis to the binary case.
The first lesson to learn is that the experimental data stem from a combination of statistical and chemical factors as expressed by eqn (4). Therefore, the two contributions must be suitably disentangled, which means that we have to separate the volume fractions of powder that have undergone i CLCs after m impacts, χi(m), from the associated concentration, αi. Eqn (4) indicates that the concentration of product C after the very first impact is
| αC(1) ≅ κα1,C. | (19) |
The quantity α1,C can be expected to be very small. Therefore, the overall concentration of reactants, α1,A+B = α1,A + α1,B, can be expected to be approximately equal to 1. It follows that
| αA+B(1) ≅ (1 − κ)α1,A+B ≅ 1 − κ. | (20) |
Thus, a first guess concerning the volume fraction of powder subjected to CLCs during individual impacts, κ, can be obtained by the initial slope of the kinetic curve describing the gradual decrease of reactants.
Once we have the first, rough κ estimate, a non-linear regression analysis of the experimental kinetic curves describing the variation of reactant (A and B) and product (C) concentrations α(m) can be carried out using eqn (4). According to our model, once the deformation map describing co-deformation and the initial reactant configuration are chosen, the reaction kinetics depends only on the two quantities κ and Π. While the chemical kinetics expressed by the αi values varies with the reaction probability Π, the volume fractions of powder subjected to i CLCs after m impacts, χi(m), are determined by the volume fraction affected by CLCs in individual impacts, κ. The κ and Π values can be obtained, in principle, by best fitting eqn (4) to experimental data.
If the best fitting is not satisfactory, a new attempt can be made starting from the same rough κ estimate, but changing the initial reactant configuration, i.e. assuming a different volume distribution of sub-domains in volumes v*. Along the same line, a different deformation map can be selected to improve the best fitting.
In all cases, the best fitting allows providing deeper insight into the experimental findings, moving from the macroscopic length scale to the one really involved in mechanochemical processes during individual impacts. Although simplistic, such analysis establishes a new, more reliable ground to compare the kinetics of different mechanochemical transformations or to relate the kinetics of a given mechanochemical reaction to the processing variables.
In this regard, we cannot help emphasizing that only the direct experimental evaluation of the different quantities involved in the mechanochemical transformation can really make the knowledge in the field advance. The characteristic size of the volumes involved in CLCs, v*, the fraction of powder affected by CLCs during individual impacts, κ, the conversion degree associated with individual volumes v*, αi, and the related interface area, Si, have to be estimated experimentally independent of each other. This is a tremendous challenge on the way to a full understanding of mechanochemistry, but it is also an exciting circumstance that can push researchers to struggle towards real progress in the field.
Conclusions
In this work, we addressed the kinetics of mechanochemical transformations involving molecular solids, one of the fundamental issues in the burgeoning field of mechanochemistry. Our investigation focused on the chemical behaviour of molecular species that keep their structural integrity when subjected to mechanical stresses, but react with each other. We considered the case in which solid reactants are initially segregated and only the molecules that come into contact can form new chemical species. Thus, in addition to the propensity of molecules to react with each other, the chemical reaction rate depends on the interface area available to reactants. This, in turn, varies with the mixture composition and the degree of interdispersion of the solid phases, which increases as the molecular solids are repeatedly co-deformed.Although the kinetic scenario can appear relatively simple, its description requires sophisticated theoretical and numerical methods. To this aim, we have developed a discrete kinetic model that combines the statistical nature inherent to the mechanical processing of powders by ball milling with a phenomenological description of physical mixing under the effects of shear stresses. The numerical calculation of discrete deformation maps allowed us to evaluate the interface area and monitor its gradual increase consequent to mechanical deformation. The assumption that the chemical reaction only involves, with a certain probability, reactant molecules in contact with each other finally enabled us to evaluate a chemical conversion degree.
We have carried out a systematic exploration of the transformation kinetics. Specifically, we have varied the amount of powder subjected to effective processing during individual impacts, the chemical composition of the powder mixtures and the reaction probability at the interface while using the same deformation map. In this way, we have evaluated the relative importance of the different factors involved in the mechanochemical reaction.
Unsurprisingly, we show that co-deformation and forced mixing plays a crucial role. Except for special cases, forced mixing represents the rate-limiting step of the mechanically activated chemical process. It is forced mixing that, to a large extent, determines the shape of the kinetic curve. Unless co-deformation and forced mixing are very effective and rapid, their combination with chemistry invariably results in a kinetic curve with sigmoidal shape. When forced mixing is much faster than the chemical reaction, however, the kinetics can approach the scenarios typical of classical solution chemistry.
Provided that accurate kinetic evidence is available, statistical and chemical factors can be disentangled, at least in principle. Under suitable assumptions, the kinetic analysis of experimental data can lead to the approximate, yet useful, evaluation of quantities on the mesoscopic and microscopic scales such as the interface area and the thickness of reacted layer. Displaying all of its potential in the presence of kinetic information systematically collected, our model can help filling the gap between macroscopic kinetic evidence and local processes taking place on the microscopic scale during individual impacts.
Nomenclature
| A | Reactant |
| B | Reactant |
| C | Product in binary systems – reactant in ternary systems |
| D | Intermediate |
| Da | Damköhler number |
| E | Product |
| h | Thickness of the interface layer involved in the chemical reaction [m] |
| i | Number of CLCs undergone by the powder |
| k | Apparent rate constant for a mechanochemical second-order kinetics |
| K | Apparent rate constant for a classical second-order kinetics [s−1] |
| m | Number of impacts |
| N | Total number of molecules in volumes v* |
| r | Rate of interface area generation |
| s AB | Interface area associated with individual contacts between A and B molecules [m2] |
| S | Interface area between different chemical species [m2] |
| S i (m) | Interface area for powder that has undergone CLCs i times after m impacts [m2] |
| S in | Initial interface area [m2] |
| S fin | Plateau value of the interface area [m2] |
| S fin,max | Maximum plateau value of the interface area [m2] |
| t | Time [s] |
| v | Total volume of powder affected by CLCs per impact [m3] |
| v* | Volume of powder affected by CLCs per impact [m3] |
| V | Total volume of processed powder [m3] |
| x | Cartesian coordinate utilized in deformation map iterations |
| y | Cartesian coordinate utilized in deformation map iterations |
| z | Cartesian coordinate utilized in deformation map iterations |
| α | Degree of chemical conversion |
| α 0 | Initial volume fraction of chemical species in the powder mixture |
| α i | Degree of chemical conversion of powder that has undergone CLCs i times after m impacts |
| η | Number of volumes v* affected by CLCs per impact |
| κ | Volume fraction of powder that is subjected to CLCs per impact |
| Π | Probability of reaction between two chemical species in contact |
| τ | Impact duration [s] |
| χ | Volume fraction of powder |
| χ i (m) | Volume fraction of powder that has undergone CLCs i times after m impacts |
Author contributions
Conceptualization: A. C., F. D., A. P.; Data curation: G. P., G. T.; Methodology: A. C., F. D.; Investigation: A. C., F. D., G. T.; Funding acquisition: A. P.; Visualization: G. P.; Writing – original draft: A. C., F. D.; Writing – review and editing: A. C., F. D., A. P.Conflicts of interest
There are no conflicts to declare.Acknowledgements
This article is dedicated to the memory of Prof. Laszlo Takacs. The authors are indebted to him for enlightening discussions and ceaseless support. G. T. performed his activity within the framework of the International PhD in Innovation Sciences and Technologies at the Università degli Studi di Cagliari, Italy. The authors are grateful to MIUR, Italy, for the PRIN project MultIFunctional poLymer cOmposites based on groWn matERials, n. 2017B7MMJ5_001. A. P. acknowledges financial support from Progetto Fondazione di Sardegna, Grant CUP F72F20000230007.References
- K. A. Connors, Chemical Kinetics: The Study of Reaction Rates in Solution, John Wiley and Sons, New York, 1990 Search PubMed; R. D. Levine, Molecular reaction dynamics, Cambridge University Press, Cambridge, 2009 Search PubMed; P. L. Houston, Chemical Kinetics and Reaction Dynamics, 3rd edn, McGraw-Hill, New York, 2012 Search PubMed.
- J. I. Steinfeld, J. S. Francisco and W. L. Hase, Chemical Kinetics and Dynamics, Prentice-Hall PTR, Upper Saddle River, 1999 Search PubMed; O. Levenspiel, Chemical Reaction Engineering, 3rd edn, John Wiley and Sons, New York, 1999 Search PubMed; H. S. Fogler, Elements of Chemical Reaction Engineering, 4th edn, Prentice-Hall PTR, Upper Saddle River, 2006 Search PubMed.
- J. Baldyga, J. R. Bourne and S. J. Hearn, Chem. Eng. Sci., 1997, 52, 457 CrossRef CAS; M. J. Clifford, E. P. L. Roberts and S. M. Cox, Chem. Eng. Sci., 1791, 1998, 53 Search PubMed; J. Baldyga and J. R. Bourne, Turbulent mixing and chemical reactions, John Wiley and Sons, London, 1999 Search PubMed; R. Sturman, J. M. Ottino and S. Wiggins, The mathematical foundations of mixing, Cambridge University Press, Cambridge, 2006 Search PubMed.
- H. Taitelbaum, S. Havlin, J. E. kiefer, B. Trus and G. H. Weiss, J. Stat. Phys., 1991, 65, 873 CrossRef CAS; H. Larralde, M. Araujo, S. Havlin and H. E. Stanley, Phys. Rev. A: At., Mol., Opt. Phys., 1992, 46, 855 CrossRef PubMed; T. Le Borgne, T. R. Ginn and M. Dentz, Geophys. Res. Lett., 2014, 41, 7898 CrossRef; M. Dentz and F. P. J. de Barros, J. Fluid Mech., 2015, 777, 178 CrossRef; A. Bandopadhyay, T. Le Borgne, Y. Meheust and M. Dentz, Adv. Water Res., 2017, 100, 78 CrossRef.
- H. Schmalzried, Solid state reactions, Verlag Chemie, Berlin, 1974 Search PubMed; R. C. Ropp, Solid state chemistry, Elsevier Science, London, 2003 Search PubMed; Organic solid state reactions, ed. F. Toda, Springer Verlag, Berlin, 2005 Search PubMed.
- P. Yu. Butyagin, Usp. Khim., 1971, 40, 1935 Search PubMed; G. Heinicke, Tribochemistry, Akademie-Verlag, Berlin, 1986 CrossRef CAS; C. C. Suryanarayana, Prog. Mater. Sci., 2001, 46, 1 CrossRef CAS; P. Balaz, Mechanochemistry in Nanoscience and Minerals Engineering, Springer-Verlag Berlin Heidelberg, Berlin, 2008 Search PubMed.
- J. M. Ottino, The kinematics of mixing: stretching, chaos and transport, Cambridge University Press, Cambridge, 1989 CrossRef; T. Bennett, Transport by Advection and Diffusion, Wiley, New York, 2012 CrossRef; H. Aref, J. R. Blake, M. Budišić, S. S. S. Cardoso, J. H. E. Cartwright, H. J. H. Clercx, K. El Omari, U. Feudel, R. Golestanian, E. Gouillart, G. F. van Heijst, T. S. Krasnopolskaya, Y. Le Guer, R. S. MacKay, V. V. Meleshko, G. Metcalfe, I. Mezić, A. P. S. de Moura, O. Piro, M. F. M. Speetjens, R. Sturman, J.-L. Thiffeault and I. Tuval, Rev. Mod. Phys., 2017, 89, 025007 CrossRef.
- A. C. Lund and C. A. Schuh, Appl. Phys. Lett., 2003, 82, 2017 CrossRef CAS; S. Odunuga, Y. Li, P. Krasnochtchekov, P. Bellon and R. S. Averback, Phys. Rev. Lett., 2005, 95, 045901 CrossRef PubMed; F. Delogu, J. Appl. Phys., 2008, 104, 073533 CrossRef; F. Delogu, Phys. Rev. B: Condens. Matter Mater. Phys., 2010, 82, 205415 CrossRef; F. Delogu, Chem. Phys. Lett., 2012, 521, 125 CrossRef; Y. Ashkenazy, N. Q. Vo, D. Schwen, R. S. Averback and P. Bellon, Acta Mater., 2012, 60, 984 CrossRef.
- S. L. James, C. J. Adams, C. Bolm, D. Braga, P. Collier, T. Friscic, F. Grepioni, K. D. M. Harris, G. Hyett, W. Jones, A. Krebs, J. Mack, L. Maini, A. G. Orpen, I. P. Parkin, W. C. Shearouse, J. W. Steed and D. C. Waddell, Chem. Soc. Rev., 2012, 41, 413 RSC; T. Friscic, Chem. Soc. Rev., 2012, 41, 3493 RSC; V. Sepelak, A. Düvel, M. Wilkening, K.-D. Becker and P. Heitjans, Chem. Soc. Rev., 2013, 42, 7507 RSC; P. Balaz, M. Achimovicova, M. Balaz, P. Billik, Z. Cherkezova-Zheleva, J. Manuel Criado, F. Delogu, E. Dutkova, E. Gaffet, F. J. Gotor, R. Kumar, I. Mitov, T. Rojac, M. Senna, A. Streletskii and K. Wieczorek-Ciurowa, Chem. Soc. Rev., 2013, 42, 7571 RSC; L. Takacs, Chem. Soc. Rev., 2013, 42, 7649 RSC; G.-W. Wang, Chem. Soc. Rev., 2013, 42, 7668 RSC; D. Tan and F. García, Chem. Soc. Rev., 2019, 48, 2274 RSC.
- M. Carta, E. Colacino, F. Delogu and A. Porcheddu, Phys. Chem. Chem. Phys., 2020, 22, 14489 RSC.
- C. M. Reddy, G. R. Krishna and S. Ghosh, CrystEngComm, 2010, 12, 2296 RSC; S. Mannepalli and K. S. R. N. Mangalampalli, Crystals, 2017, 7, 324 CrossRef CAS; S. Saha, M. K. Mishra, C. M. Reddy and G. R. Desiraju, Acc. Chem. Res., 2018, 51, 2957 CrossRef PubMed; C. Wang and C. C. Sun, CrystEngComm, 2020, 22, 1149 RSC.
- J. M. Ottino, The kinematics of mixing: stretching, chaos and transport, Cambridge University Press, Cambridge, 1989 CrossRef PubMed; S. Wiggins and J. M. Ottino, Philos. Trans. R. Soc., A, 2004, 362, 937 CrossRef PubMed; R. Sturman, J. M. Ottino and S. Wiggins, The Mathematical Foundations of Mixing. The Linked Twist Map as a Paradigm in Applications: Micro to Macro, Fluids to Solids, Cambridge University Press, Cambridge, 2010 Search PubMed.
- P. H. Shingu, K. N. Ishihara and A. Otsuki, Mater. Sci. Forum, 1995, 179–181, 5 Search PubMed; G. Pia, G. Traversari, A. Cincotti and F. Delogu, Philos. Mag. Lett., 2019, 99, 192 CrossRef CAS.
- T. Friscic, I. Halasz, P. J. Beldon, A. M. Belenguer, F. Adams, S. A. J. Kimber, V. Honkimaki and R. E. Dinnebier, Nat. Chem., 2013, 5, 66 CrossRef CAS PubMed; S. Lukin, T. Stolar, M. Tireli, M. V. Blanco, D. Babic, T. Friscic, K. Uzarevic and I. Halasz, Chem. – Eur. J., 2017, 23, 13941 CrossRef PubMed; P. A. Julien, I. Malvestiti and T. Friscic, Beilstein J. Org. Chem., 2017, 13, 2160–2168 CrossRef PubMed; H. Kulla, S. Haferkamp, I. Akhmetova, M. Rollig, C. Maierhofer, K. Rademann and F. Emmerling, Angew. Chem., Int. Ed., 2018, 57, 1 CrossRef PubMed; A. M. Belenguer, A. A. L. Michalchuk, G. I. Lampronti and J. K. M. Sanders, Beilstein J. Org. Chem., 2019, 15, 1226 CrossRef PubMed; D. Hasa, M. Pastore, M. Arhangelskis, B. Gabriele, A. J. Cruz-Cabeza, G. Schneider Rauber, A. D. Bond and W. Jones, CrystEngComm, 2019, 21, 2097 RSC; P. A. Julien, L. S. Germann, H. M. Titi, M. Etter, R. E. Dinnebier, L. Sharma, J. Baltrusaitis and T. Friscic, Chem. Sci., 2020, 11, 2350 RSC.
| This journal is © the Owner Societies 2021 |