 Open Access Article
Creative Commons Attribution 3.0 Unported Licence
Atomic layer deposition of LiF using LiN(SiMe3)2 and SF6 plasma†
N.
Hornsveld
 *a,
W. M. M.
Kessels
 a,
R. A.
Synowicki
b and
M.
Creatore
 a
a
aDepartment of Applied Physics, Eindhoven University of Technology, 5600 MB Eindhoven, The Netherlands. E-mail: n.hornsveld@tue.nl
bJ.A. Woollam Co., Inc., 645 M Street, Suite 102, Lincoln, Nebraska 68508, USA
First published on 29th March 2021
Abstract
Lithium fluoride films were prepared by atomic layer deposition (ALD) using a new route in which LiN(SiMe3)2 is used as a precursor and SF6 plasma as a coreactant. Conformal LiF films were deposited at 150 °C at a growth rate of ∼0.4 Å per cycle. All deposited films were polycrystalline and slightly lithium-rich with a composition of LiF0.8, independently of the plasma conditions (e.g. exposure time, pressure and power). The levels of H, C, N, O, Si, and S were all <1 at%. Spectroscopic ellipsometry measurements were carried out over the wavelength range of 140–2480 nm and showed a refractive index of 1.37 at 633 nm for films deposited using 1 s plasma exposure time. We conclude that short plasma exposures are preferred, since a prolonged exposure time leads to an increase in optical absorption and lower growth per cycle values. Furthermore, mass spectrometry measurements revealed the formation of SiMe3F species during both half-cycles, originating from the reaction between the precursor ligands and fluorine species present either at the surface or in the plasma. Moreover, the SF6 plasma step led to the formation of fluorocarbon species, suggesting that dissociation and recombination in the plasma takes place. Overall, this work demonstrates that SF6 plasma offers a promising alternative to other coreactants for ALD of high purity lithium fluoride.
1. Introduction
Lithium fluoride (LiF) is of large scientific and technological interest because of several emerging applications. LiF films have a large electrochemical stability window of 0–6.4 V vs. Li+/Li,8 a good chemical stability,3,9 and a high mechanical strength.4,10,11 LiF has therefore gained attention for its role as an electrode protective/passivating film or as an additive to improve electrode performance in lithium ion batteries.4,11,12 Moreover, LiF has one of the largest optical band gaps,13 and has a low refractive index of 1.39 at 633 nm.14 Due to these properties, LiF is useful as a protective transparent optical coating to preserve performance in the ultraviolet region of e.g. aluminum mirrors for space applications.7,15 LiF has also been employed as the electron injection layer of organic light-emitting diodes.16,17 Moreover, LiF has been explored as a promising electron contact layer in solar cells.18,19So far, lithium fluoride based thin films have been deposited with various physical vapor deposition methods, including thermal and electron beam evaporation and pulsed laser deposition.9,20–22 In the recent years, atomic layer deposition (ALD) of LiF was demonstrated.1–7 ALD is a thin film growth technique based on sequential and self-limiting half reactions. Its benefits of precise thickness control at sub-nanometer level and ability to deposit uniform and conformal films on high-aspect ratio and large-area substrates, are widely recognized.23 These merits will enable applications of LiF such as 3D-nanostructured batteries or solar cells with a demanding surface topology. Moreover, LiF ALD cycles can be combined with ALD cycles of other materials to tune the film properties. This is the case of LiF combined with AlF3 to deliver lithium aluminum fluoride, serving as e.g. solid-state Li-ion electrolyte. A literature overview of LiF ALD is presented in Table 1. LiF has for example been deposited using LiTMHD or LiOtBu as lithium precursor and TiF4 as coreactant (the latter also in combination with Mg(TMHD)2). Otherwise, anhydrous HF and HF–pyridine have also been adopted as the fluorine source. The combination of LiTMHD with TiF4 lead to high growth per cycle (GPC) values and nearly stoichiometric films with impurity levels <1 at%.1 However, the deposition has proven challenging, as the growth was highly dependent on the temperature gradient inside the reactor and required a relatively large LiTMHD dose to deliver uniform films. Furthermore, the films were often characterized by poor adhesion to the substrate. Although these drawbacks can be partially overcome by introducing an additional Mg(TMHD)2 dose step,2 the process becomes complicated. The combination of LiOtBu and TiF4 delivered much better film uniformity,3 yet no ALD saturation behavior was reported. More recently, LiF has been deposited using anhydrous HF,7 or a HF–pyridine solution,4,6 leading to lower deposition temperatures and films with good uniformity. However, the HF precursor is potentially dangerous and corrosive, and although HF–pyridine solutions provide a safer alternative to anhydrous HF and the use of compressed gas cylinders is avoided, strict safety precautions are still required. Very recently, ALD LiF based on a less harmful chemistry, i.e. LiOtBu and NH4F, has been reported.5
| Precursor | Coreactant(s) | T sub (°C) | GPC (Å) | Ref. |
|---|---|---|---|---|
| a TMHD = 2,2,6,6-tetramethyl-3,5-heptanedionate. | ||||
| LiTMHDa | TiF4 | 250–350 | 1.5–1.0 | 1 |
| LiTMHDa | TiF4 + Mg(TMHD)2a | 300–350 | 1.6–1.4 | 2 |
| LiOtBu | TiF4 | 200–300 | 0.35–0.48 | 3 |
| LiOtBu | HF–pyridine | 150 | 0.8 | 4 |
| LiOtBu | NH4F | 150–300 | 0.35–0.65 | 5 |
| LiN(SiMe3)2 | HF–pyridine | 125–250 | 0.2–0.6 | 6 |
| LiN(SiMe3)2 | Anhydrous HF | 150 | 0.15 | 7 |
| LiN(SiMe3)2 | SF6 plasma | 150 | 0.37 | This work |
In our present work, an SF6-fed plasma is exploited as fluorine source for ALD of LiF films. SF6 plasmas, as well as other F-containing plasmas such as CF4 and NF3, are extensively used for etching of Si-based materials (Si, SiO2, Si3N4, etc.) and chamber cleaning. For the latter purpose, fluorine plasmas are readily available in many plasma operated ALD reactors. The use of a SF6 plasma as coreactant has so far only been investigated for the deposition of AlF3.24 It was demonstrated that this approach is a promising alternative to the more commonly used anhydrous HF and HF–pyridine as the F-source for ALD of AlF3. SF6 is a stable, non-toxic gas which is easy to handle. Here, we combine SF6 plasma with LiN(SiMe3)2 as the lithium precursor. LiN(SiMe3)2 has a relatively low melting point of 70 °C and it can be used in vapor draw mode. Therefore, the temperature of the precursor delivery line as well as of the walls of the vacuum chamber can be kept relatively low and line clogging is less probable. We examined the growth, film properties as well as surface reactions involved in the LiF plasma-ALD process. ALD behavior was confirmed at 150 °C and the growth rate of the films was approximately 0.4 Å per cycle. All investigated films were found slightly lithium-rich (LiF0.8) with negligible levels of impurities. From spectroscopic ellipsometry measurements it followed that films were characterized by optical absorption in the shorter wavelength range. The latter increased with the plasma exposure time. To gain more insight into the ALD growth of LiF, quadrupole mass spectrometry (QMS) studies were carried out to identify the reaction mechanisms during the two half-cycles and the similarities and differences with the thermal ALD process of LiF are highlighted.
2. Experimental
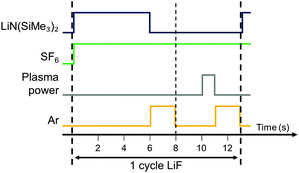
The LiF films were fabricated using the Oxford Instruments FlexAL™ thermal and remote plasma ALD reactor. The reactor consists of a rotary and turbo molecular pump such that it can reach a base pressure of <10−6 torr by overnight pumping. The pump unit as well as the inductively coupled plasma (ICP) source are connected to the deposition chamber through gate valves.In Fig. 1 the ALD process developed in this work is shown. The LiF ALD cycle consists of the exposure of the substrate to LiN(SiMe3)2 (97%, Pegasus Chemicals) as precursor and a SF6 (99.995%) fed plasma as coreactant. Note that in the gas phase, LiN(SiMe3)2 is mainly present as a dimer but also a small percentage of monomers are observed.25 Because of their lower coordination, monomers are expected to be more reactive than dimers and can dominate the ALD reaction mechanism. In line with previous ALD studies, only monomers are considered in this work.6,26 The LiN(SiMe3)2 dose and SF6 plasma step are alternated by Ar purges to remove all the unreacted species and reaction products from the chamber. The LiN(SiMe3)2 precursor was kept in a stainless steel container and inserted into the chamber by vapor draw for the standard process. Also, the option to bubble the precursor with Ar carrier gas was investigated and is discussed in next section. The LiN(SiMe3) precursor pod was kept at 85 °C and the supply line was heated to 120 °C to prevent precursor condensation. The power for the SF6 plasma was set to 300 W. The pressure during processing was kept constant at 50 mTorr and a 100 sccm SF6 gas flow was continuously injected from the top via the inductively coupled plasma (ICP) valve. It was confirmed that no film growth occurs without ignition of the plasma, indicating that LiN(SiMe3)2 does not react with SF6 gas. The wall temperature was set to the maximum temperature of 120 °C.
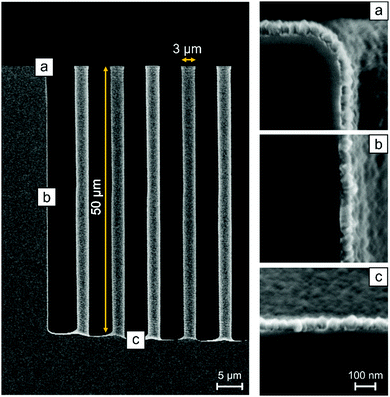
Depositions were performed on a Si(100) wafer with native oxide (Siegert Wafer, 10–20 Ohm cm) and on a Si wafer with micropillars which are 50 μm high and have a diameter of 3 μm and 5 μm spacing. Since SF6 plasmas can be used for etching of Si-based materials, 10 Al2O3 ALD cycles (∼1.5 nm) were used as a protective layer prior to LiF processing. Substrates were placed on a 200 mm carrier wafer and the table temperature was set to 150 °C.
In order to obtain the optical properties of the LiF films over the wavelength range of 140–2480 nm, ex situ spectroscopic ellipsometry (SE) measurements were performed using vacuum ultraviolet variable angle SE (VUV-VASE) at J.A. Woollam Co., Inc. Ex situ measurements were performed at angles of incidence from 55–75° with steps of 5°, and photon energy steps of 0.05 eV. The SE model consisted of a combination of one Sellmeier function and Gaussian oscillator functions. The number of Gaussian oscillators needed to describe the dielectric function increased for longer plasma exposure times. The surface roughness layer was fitted using a Bruggeman Effective Medium Approximation (EMA). Herein, the roughness layer refractive index is described as a mixture of 50% film and 50% voids. Ex situ SE was also used to probe thickness uniformity over 200 mm Si wafers. The film thickness was monitored by in situ SE with a J.A. Woollam, Inc. M-2000F (250–1000 nm) system. The results from the ex situ SE data were used to fit the data obtained in situ but without taking the surface roughness layer into account as it lead to correlation between fitting parameters. This simplification hardly affected the variation in thickness which was the only parameter extracted.
Thickness values were confirmed by high resolution SEM (Zeiss Sigma) operated at 2 kV acceleration voltage. An average of at least 5 measurements was taken to determine the uncertainty. SEM was also used to investigate the morphology of the deposited layers. The samples were sputter coated with a 5 nm conductive Au/Pd film prior to the SEM measurements to prevent accumulation of electrons on the sample surface.
The LiF films were also investigated by X-ray photoelectron spectroscopy (XPS).27 XPS spectra were recorded by a Thermo Scientific K-Alpha+ system using monochromatic Al Kα X-rays. The spot size of the beam was 400 μm and the base pressure of the system was 10−6 mTorr. Sensitivity values of 0.06 and 4.43 were used for composition analysis of the Li 1s and F 1s regions, respectively. These are the standard values from the database associated with the instrumentation of the Avantage XPS software. The background used to analyze the peaks is a Smart background. The Smart background is an iterative Shirley background to which a constraint has been added such that at no point a background will have a greater intensity than the actual data.28
Elastic backscattering (EBS), elastic recoil detection (ERD) and Rutherford backscattering spectroscopy (RBS) were carried out by Detect99 to determine the composition and mass density of the films. A 2000 keV He+ beam was applied for both ERD and RBS. ERD was performed to determine the hydrogen content using 75° sample tilt and the detector at a recoil angle of 25°. For determination of the other elements, RBS was performed with perpendicular incidence and in channeling mode to reduce the background under the Li, C and O features and with two detectors, at scattering angles of 170° and 107°. EBS was necessary for a more accurate determination of the Li content in the films. Here, a 2800 keV proton beam was used in combination with glancing angle geometry to enhance the Li peak area to (Si) background height; also here the sample was tilted by 75°. The scattering angle was 170° in Cornell geometry. For all ion beam techniques, the product of the number of incident particles with the opening angle of the detector has been determined using a beam chopper. The product was calibrated using a reference sample of known composition and thickness. In the case of EBS and RBS, the reference sample was a 100 nm Ni layer on c-Si. For ERD it was a 180 nm Si3N4 layer containing 3.4 at% H. For each sample, the two RBS spectra were simulated simultaneously with the EBS spectrum by NDF (Nuno's DataFurnace), a computer code for ion beam analysis (IBA) data fitting.29 For the EBS simulations, 7Li and 19F cross sections of Paneta et al. have been used.30 In the rest of the paper we refer to the combination of RBS, EBS and ERD as IBA. The crystal structure of the layers was determined using a Philips X’Pert MPD diffractometer equipped with a CuKα source (1.54 Å radiation).
A Pfeiffer Vacuum mass spectrometer with a mass-to-charge (m/z) range of 100 atomic mass units (amu) was connected to the deposition chamber through a pipeline and a 150 μm diameter pinhole. The system is equipped with a Channeltron detector and the energy of the electrons in the ionizer was set to 70 eV. The pressure in the QMS was maintained below 10−6 torr using differential pumping with a turbomolecular pump. Prior to every measurement the background signal and pressure of the reactor were measured as a reference. The measuring time per atomic mass unit (amu) was set to 200 ms. For the time-resolved measurements, the selected m/z values were tracked per channel using a dwell time of 50 ms. The QMS data of at least 10 cycles were monitored to verify that steady-state values were achieved. The measurement procedure was explained more extensively in our previous work.31
3. Results and discussion
3.1 ALD process
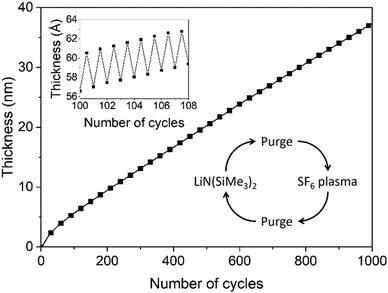
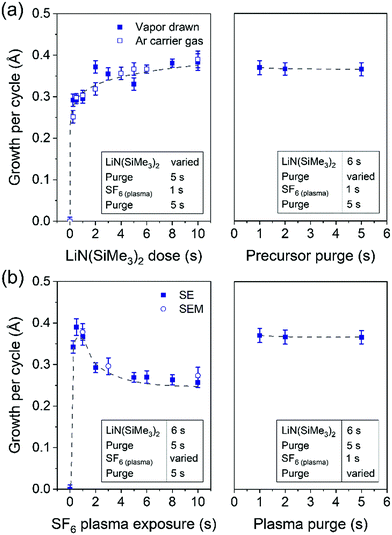
Film growth of ALD LiF was examined by in situ SE using a deposition temperature of 150 °C. In Fig. 2 the film thickness is shown as a function of the number of cycles. The first 50 cycles show a slightly enhanced growth compared to the steady growth regime. This can be due to an initial growth effect, but it can also originate from the fitting procedure to extract the thickness from the ellipsometry data. In the fit, the optical properties of the film have been assumed constant throughout the whole thickness but this assumption is not necessarily accurate. The growth per cycle is ∼0.4 Å, which is in the range of reported literature values for processes which use LiN(SiMe3)2 as the lithium precursor.6,7 The growth was also monitored after each half-cycle, as shown in the inset of Fig. 2. The magnitude of the changes in this “apparent” thickness after the precursor and SF6 plasma steps do not necessarily reflect the real change in physical thickness because the top surface is not included in the model. The inset shows that, after the LiN(SiMe3)2 dosing, the apparent thickness increases by several angstroms, because of the chemisorption of the precursor on the surface. After the SF6 plasma step, the apparent thickness decreases because of the removal of the organic ligands. It can be expected that the precursor ligands are abstracted and the surface is then terminated with fluorine. The reaction mechanism is further discussed in Section 3.3.In Fig. 3, the saturation curves for the ALD process of LiF are shown. The growth per cycle was determined as a function of the LiN(SiMe3)2 dosing time, SF6 plasma exposure time and purge times. The saturation of the pressure during the LiN(SiMe3)2 dose and plasma power are reported in Fig. S1 (ESI†). To extract the growth per cycle, the film thickness was monitored every 10 cycles while changing the dose time of the reagents, pressure or argon purge. The self-limiting behavior of the LiN(SiMe3)2 dosing time was tested with and without the use of an Ar carrier gas (Fig. 3a). In some cases, the use of an Ar carrier gas could lead to the decrease of the precursor saturation time. However, no difference was observed for our process, meaning that the vapor pressure of the precursor is high enough to dose a sufficient amount of precursor in the reactor and avoid the use of a carrier gas. The growth per cycle versus LiN(SiMe3)2 dosing time shows a so-called soft saturation behavior. A LiN(SiMe3)2 dosing time of 6 s was selected for the recipe. A purge step of 2 s was enough to remove the reaction products and unreacted precursor molecules from the chamber. Extending the purge time did not change the growth per cycle value. Fig. 3b reports the growth per cycle as a function of the plasma exposure time. After an initial increase, the growth per cycle decreases again for extended plasma exposure times. Such a particular trend, which was confirmed by SEM analysis (the corresponding SE measurements and SEM images can be found in Fig. S2 and S3, respectively, ESI†) has been observed more often for plasma-ALD processes.32 It can be attributed to several potential causes such as an etching effect playing a role for long plasma exposure times or inhibition of precursor adsorption after exposing the surface for a longer time to F radicals. Another likely cause is that the film properties are affected by the length of the plasma exposure time which has subsequently an effect on the growth itself. As will be addressed in the next section, the optical absorption of the films changes quite significantly for long exposure times showing that the film properties are affected. For the standard recipe, 1 s plasma exposure was selected. Also for the plasma half-cycle a purge step of 2 s was sufficient to remove the reaction products and unreacted molecules from the chamber. Relatively short cycle times of 13 s were defined for the standard process of LiF ALD films (Fig. 1). It is worth reporting that the effect of pressure during the precursor and plasma exposure steps and the effect of plasma power were also investigated. A pressure increase above 50 mTorr during precursor exposure did not lead to any increase in growth per cycle (Fig. S1, ESI†). Moreover, the SF6 plasma was only stable when the pressure was 50 mTorr or higher. Therefore, a pressure of 50 mTorr was selected for the process. Adjusting the plasma power did not affect the growth per cycle (Fig. S1, ESI†).
To further demonstrate the ALD behavior of the LiF process, the uniformity and conformality were investigated. For both studies the standard recipe was used. Film thickness and refractive index uniformity were determined for a ∼90 nm thick film using ex situ SE on various points of films deposited on a 200 mm wafer. The measured thicknesses and refractive indices are presented in Table S1 (ESI†). The non-uniformity (standard deviation, 1 sigma) of the thickness and refractive indices were determined to be 4.4% and 0.2%, respectively. This points to rather good uniformity of film thickness and excellent uniformity of the refractive index. However, the process parameters were optimized for the growth per cycle value and not for film uniformity. Therefore, the thickness uniformity can probably still be improved. The conformality of the deposition was studied using SEM at different positions on high aspect ratio Si pillars. The Si pillars were covered with a LiF layer of approximately 60 nm. Fig. 4 shows 3 SEM pictures taken at different heights along the pillar. Image (a) is taken at the top of the pillars and shows a LiF layer of 62 ± 2 nm. Image (b) is taken at half-length of the pillar and depicts a 60 ± 2 nm LiF layer (96% of thickness at top). At the bottom (c), the LiF film is 57 ± 2 nm thick (93%). From these measurements we can conclude that a conformal coating on high aspect ratio pillars was achieved.
3.2 Film properties
A combination of ion beam techniques, which are nondestructive and give accurate quantitative information, was used to complement the aforementioned XPS data.35 In addition, these techniques allow to probe also the hydrogen content in the film. LiF films deposited using different SF6 plasma exposure times were studied and the results are shown in Table 2. The original experimental and simulated data are reported in the ESI† (Fig. S6). The films are lithium rich and of high purity, in agreement with previous XPS studies. The IBA data also show that the total number of deposited atoms in a nm2 per cycle decreases for longer plasma exposure times. Previously, in Fig. 3b, it was shown that the growth per cycle in terms of thickness also decreases for longer plasma exposure times. This means that the thickness decrease observed for longer plasma exposure times is caused by an actual decrease in deposited LiF per cycle. According to the trend in the SE and SEM data, we would expect a further decrease in growth per cycle when prolonging the plasma exposure to 3 and 10 s. From the IBA data this decrease is not confirmed.
| Sample | Li at per nm2 per cycle | F at per nm2 per cycle | F/Li | [H] (at%) | [O] (at%) | [C] (at%) | Density (g cm−3) |
|---|---|---|---|---|---|---|---|
| 1 s plasma | 2.0 ± 0.1 | 1.6 ± 0.1 | 0.78 | 1.0 ± 0.1 | 0.8 ± 0.1 | 0.1 ± 0.1 | 2.3 ± 0.1 |
| 3 s plasma | 1.6 | 1.3 | 0.83 | 0.8 | 1.1 | 0.9 | 2.3 |
| 10 s plasma | 1.6 | 1.2 | 0.75 | 1.1 | 0.9 | 1.3 | 2.3 |
A combination of the IBA and SE data was used to calculate the mass density of the samples. From IBA measurements the areal number density of a specific atom (atoms per nm2) was extracted. The areal densities were multiplied with the mass of the atoms under consideration, and after summation the mass density was obtained by dividing by the film thickness. The mass density for all LiF films was found to be ∼2.3 g cm−3. The bulk value of the mass density of stoichiometric LiF reported in the literature is 2.6 g cm−3.36 Typically, thin films prepared by ALD or other techniques are reported to have a somewhat lower mass density compared to the bulk material. Differences in mass density probably also exist due to the sub-stoichiometric nature measured for our LiF films.
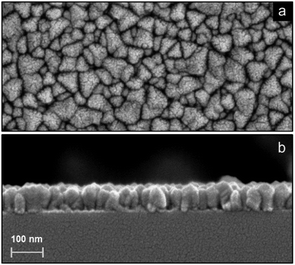
Fig. 7 shows high resolution SEM images of a 70 nm LiF film deposited using a 1 s plasma dose on top of a Si substrate. The crystallites exhibit a size comparable to the sample thickness and seem to have a triangular shape. Longer plasma exposure times lead to similar results. From the height difference observed in the cross sectional image in Fig. 7b, it can be concluded that there is significant surface roughness. The presence of surface roughness was confirmed by ex situ SE measurements. The surface roughness was relatively high, being ∼10 nm for each of the films.
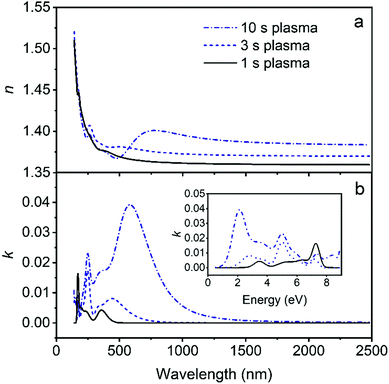
As observed from Fig. 8b, absorption occurs in a rather broad range of wavelength. However, LiF films are well known for their large optical band gap and high transparency. The LiF films deposited in this work are slightly sub-stoichiometric (LiF0.8). Anionic vacancies can lead to the formation of lattice defects. DFT studies in the literature show that when F vacancies occur, new energy levels develop which may affect the band-gap.38 However, valence band XPS spectrum analysis (Fig. S7, ESI†) shows features at 29–30 eV and 8–10 eV, independent of the plasma exposure time, and in agreement with literature of stoichiometric LiF.39 It should be noted that the band gap itself cannot be determined from the VUV-SE data since it lies outside the measured energy range of 8.8 eV. Finally, we consider the possibility that the plasma environment can play a role in the formation of this absorption features. Specifically, it has been shown that when LiF is irradiated with ions,40,41 electrons,42 or even (V)UV radiation emitted from discharges,43 color centers can be produced. The most dominant defects which can be created in LiF are F centers (an electron localized at a fluorine vacancy).41 As observed from the absorption spectra Fig. 8b, the absorption features become dominant and extend to longer wavelengths upon increasing the SF6 plasma exposure time from 1 to 10 s. Since the film stoichiometry is the same, independently of the plasma exposure time, we consider it plausible to attribute the presence of the absorption features to changes caused by plasma radiation. This conclusion is also supported by the fact that no absorption features are reported for thermal ALD of LiF.1–3,6 Instead, literature studies of AlF3 films prepared by ALD using an SF6 plasma also show absorption features in the lower wavelength range.24
3.3 Surface reactions
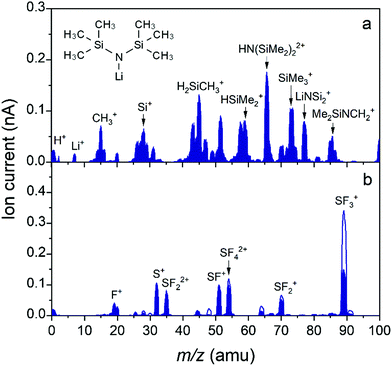
The gas phase reaction products were analyzed by mass spectrometry to gain insight into the surface reactions occurring during the ALD process. Specifically, we would like to highlight the similarities and differences between the thermal ALD process when using HF, and our SF6 plasma based LiF ALD process. A study on the surface reactions of thermal ALD of LiF with LiN(SiMe3)2 as precursor and HF–pyridine as coreactant was already presented in the literature.6 Herein, it was reported that LiN(SiMe3)2 molecules can either physisorb or chemisorb during the first half-cycle. Physisorbtion of LiN(SiMe3)2 on LiF was attributed to strong interactions of Si and N in LiN(SiMe3)2 with F and Li in LiF, respectively. During the second half-cycle, the surface is exposed to HF to promote ligand abstraction from the physisorbed Li–N(SiMe3)2 molecules and form LiF. Specifically, the precursor ligands on the surface were abstracted in the form of SiMe3F and NH3. However, it was reported that if physisorbed HF is present, the precursor ligand could instead chemisorb and already lose its ligands, i.e. LiF would be formed already during the precursor dosing step.6,44 Compared to other metal fluorides, which are shown to adsorb a significant amount of HF after HF exposure, the amount of adsorbed HF on LiF is expected to be limited because of the Lewis base nature of LiF.44 LiF would rather act as a F− ion donor. Despite the presence of peaks at m/z = 77 (SiMe2F+ from SiMe3F) and m/z = 17 (NH3+ from NH3) in the mass spectrometer at the end of the precursor step, the authors concluded with a complementary quartz crystal microbalance (QCM) study that the precursor ligands are indeed primarily abstracted during the HF exposure. Moreover, they concluded that at higher deposition temperatures (>200 °C) the ligand abstraction during the precursor step is suppressed because of the limited physisorbed HF on the LiF surface.To gain insight into the species present in the reactor during our plasma-ALD process, the spectra during precursor dosing and SF6 plasma ignition were measured in the range of m/z = 1–100 as shown in Fig. 9. In Fig. 9a the cracking pattern of the LiN(SiMe3)2 precursor is shown. Note that the peak from the parent molecule itself and the peaks with the highest expected intensity (146, 130, and 147 amu, respectively) could not be measured since they lie outside the range of the mass spectrometer.45,46 The peak with the highest intensity within the explored mass range is located at 65.5 amu, and its width would suggest there are multiple contributions to it.26,45 We expect the m/z of 65 amu corresponds with the double ionized species from m/z = 130 (N(SiMe2)2+), and the m/z of 65.5 corresponds with the double ionized species from m/z = 131 (HN(SiMe2)2+).26,47Fig. 9b shows the spectra of SF6 plasma and SF6 gas, which are essentially identical in terms of detected species. As expected, the peaks during SF6 plasma exposure are lower than the SF6 gas spectrum due to dissociation in the plasma. All measured species are ion fragments of SF6. Note that again the parent molecule itself (SF6) could not be measured since it lies at m/z = 146. Instead, SF3+ at m/z = 89 was tracked to measure SF6.
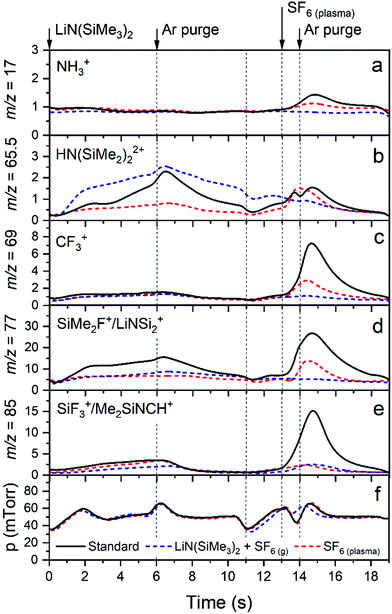
A complete overview of the measured species is presented in Table S3 in the ESI.†Fig. 10 presents a selection of these species, which are followed during one cycle of LiF. In Fig. 10a–e, the following masses are considered: m/z = 17 (NH3+ from NH3), 65.5 (from LiN(SiMe3)2 or HN(SiMe3)2), 69 (CF3+ from CF4 or CHF3), 77 (SiMe2F+ from SiMe3F or SiMe2F2 and LiNSi2+ from LiN(SiMe3)2) and 85 (SiF3+ from SiF4 or SiMeF3 and Me2SiNCH+ from LiN(SiMe3)2). Note that m/z = 77 is the largest peak in the mass spectrum of SiMe3F, whereas the peak at m/z = 92 (SiMe3F+) has negligible intensity.46 Additional mass-to-charge ratios 15 (CH3+), 31 (CF+), 33 (CH2F+ or SH+), 34 (CH3F+ or H2S+), 50 (CF2+), 51 (CHF2+), and 81 (SiMeF2+ from SiMeF3 or SiMe2F2) amu can be found in the ESI† in Fig. S8. Also, the pressure in the system was monitored and reported in Fig. 10f. The graph is divided into several sections representing the different ALD process steps, i.e., LiN(SiMe3)2 dose and SF6 plasma exposure, which are alternated by Ar purging. Compared to the ALD recipe for LiF described earlier, all purge steps are now extended to 5 s to clearly separate the process steps and facilitate data interpretation. (As shown in Fig. 3, extended purge times did not influence the process.) In addition to the standard ALD recipe, in Fig. 10 the data are also reported for recipes where one of the reagents is omitted from the recipe. For these recipes no ALD growth occurred and the data is reported after 10 cycles so that steady-state values were achieved. Therefore, it is possible to distinguish the reaction products from other species present in the reactor and fragmentation and ionization occurring in the mass spectrometer. In every plot three different curves are shown, corresponding with the following recipes: the standard recipe, the recipe with only LiN(SiMe3)2 and SF6 gas (no plasma), and the recipe with only SF6 plasma.
In the first half-cycle the lithium precursor was introduced in the chamber which led to an increase in signal at m/z = 65.5 for the standard recipe as well as for the LiN(SiMe3)2 + SF6(g) recipe, as expected. The peak at m/z = 65.5 is smaller in the case of the ALD process compared to the LiN(SiMe3)2 + SF6(g) recipe. We attribute this observation to precursor adsorption and reaction with the surface in the case of the ALD process, whereas for the LiN(SiMe3)2 + SF6(g) recipe the surface was already saturated with Li-precursor. Also a signal at m/z = 77 was observed during the LiN(SiMe3)2 dose. The standard ALD recipe has a higher signal compared to the other recipes, pointing out that this is a reaction product of the Li-precursor with the surface, promoted by the presence of F− species on the LiF surface. As mentioned before, this reaction product was also found in the mass spectrometer for the thermal ALD LiF process at 150 °C, although in combination with NH3.6
In the second half-cycle the surface is exposed to SF6 plasma. Note that from the QMS measurements no clear evidence of sulfur-containing reaction products was observed. The signal at m/z = 34 (Fig. S8, ESI†) could however also originate from H2S species formed in the plasma. Furthermore, no S is detected in the film. The dominant neutral species in an inductively coupled SF6 plasma are known to be SF6, F, F2, and SF4, while the dominant ions are SF5+ and F+.48–50 The concentration of S and S+ is typically a factor 103 lower than the concentration of F and F+.50 Moreover, it is known that F is very reactive due to its very high electronegativity and electron affinity.51 Therefore, it is reasonable to assume that only F takes part in the surface reactions. During this half-cycle again peaks at m/z = 65.5 and 77 were observed, as well as a peak at m/z = 17 (NH3+). Also other fluoromethylsilane species and fluorocarbons were found. Specifically, reaction products at m/z = 85 (SiF3+ from SiF4 or SiMeF3) and m/z = 69 (CF3+ from CF4 or CHF3) were observed. As shown in the Fig. S8 (ESI†), reaction products at m/z = 81 (SiMeF2+ from SiMeF3 or SiMe2F2), m/z = 50 (CF2+) and m/z = 31 (CF+) were observed. Moreover, relatively small peaks at m/z = 33 and 34 assigned to CH2F+ and CH3F+ were found. It can be observed that all masses reported in Fig. 10 (except 65.5 amu, which corresponds with the precursor molecule) show a higher intensity during the second half-cycle with respect to the first half-cycle. This indicates that ALD surface reaction products are primarily generated during the plasma exposure.
To summarize the findings from the QMS studies in the first and second half-cycles: a fraction of the precursor molecules that adsorb at the surface already loses one of its ligands during the LiN(SiMe3)2 dose step. The remaining Li-precursor ligands are abstracted during the plasma step. Moreover, the reaction products can be further dissociated in the plasma leading to e.g. fluorocarbon species. Reaction eqn (1) is proposed for the precursor dose, where the adsorbed precursor can undergo partial loss of ligands.
| (2 − x)F(s) + LiN(SiMe3)2(g) → LiN(SiMe3)x(ads) + (2 − x)SiMe3F(g) [0 ≤ x ≤ 2] | (1) |
| LiN(SiMe3)x(ads) + (3 + y + z)F(g) → LiF(s) + SiMe3−yF1+y + CH3−zF1+z + NH3(g) | (2) |
4. Conclusions
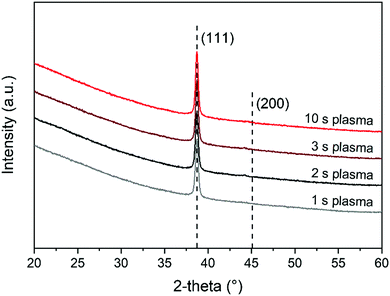
A new ALD chemistry has been demonstrated to prepare LiF films using LiN(SiMe3)2 and SF6 plasma. Self-limiting growth was obtained at ∼0.4 Å per cycle and conformal coverage of high aspect ratio pillars was achieved for deposition at 150 °C. Moreover, high purity films were obtained with contamination levels <1 at%. The obtained stoichiometry of the films was LiF0.8 as determined by IBA and XPS measurements. Furthermore, the ALD process yields polycrystalline films with preferential growth in the 〈111〉 direction. The film density was 2.3 g cm−3. Within the measurement error, no deviation in film stoichiometry, crystallinity or density was found for the plasma conditions studied. When a plasma exposure of 1 s was used, the refractive index at 633 nm was 1.37. Despite the fact that LiF is well-known to be transparent, some optical absorption was found in the films. Prolongation of the plasma exposure time leads to an increase in optical absorption while the stoichiometry is unchanged. We therefore consider it plausible to attribute the presence of the absorption features to the interaction of the SF6 plasma with the film. Also lower growth per cycle values were obtained for longer plasma exposure times, and therefore short plasma exposure times are preferred. It is expected that the optical properties can be further optimized by modifying the plasma conditions. To gain more insight into the deposition process, also QMS measurements were performed. From the detected species it could be concluded the LiN(SiMe3)2 ligand already partly dissociates during the precursor dosing step. In contrast to thermal ALD, additional formation of different fluoromethylsilane and fluorocarbon species was observed during the SF6 plasma exposure step. Most likely the SF6 plasma species promote the abstraction of the remaining ligands and their subsequent dissociation in the plasma. Overall, this work demonstrates that the easy-to-handle and readily-available SF6 plasma is a promising alternative to coreactants such as TiF4, or HF–pyridine for ALD of lithium fluorides.Conflicts of interest
There are no conflicts to declare.Acknowledgements
This project is financially supported by ADEM, A green Deal in Energy Materials of the Ministry of Economic Affairs of The Netherlands. We gratefully acknowledge C.A.A. van Helvoirt for technical assistance. In addition, the authors would like to thank Pegasus Chemicals for providing the lithium precursor. Moreover, M. Creatore acknowledges the NWO Aspasia program.References
- M. Mantymaki, J. Hamalainen, E. Puukilainen, F. Munnik, M. Ritala and M. Leskelä, Atomic Layer Deposition of LiF Thin Films from Lithd and TiF4 Precursors, Chem. Vap. Depos., 2013, 19, 111–116 CrossRef CAS.
- M. Mantymaki, J. Hamalainen, E. Puukilainen, T. Sajavaara, M. Ritala and M. Leskelä, Atomic Layer Deposition of LiF Thin Films from Lithd, Mg(thd)2, and TiF4 Precursors, Chem. Mater., 2013, 25, 1656–1663 CrossRef CAS.
- J. Xie, A. D. Sendek, E. D. Cubuk, X. Zhang, Z. Lu, Y. Gong, T. Wu, F. Shi, W. Liu, E. J. Reed and Y. Cui, Atomic Layer Deposition of Stable LiAlF4 Lithium Ion Conductive Interfacial Layer for Stable Cathode Cycling, ACS Nano, 2017, 11, 7019–7027 CrossRef CAS PubMed.
- L. Chen, K. S. Chen, X. Chen, G. Ramirez, Z. Huang, N. R. Geise, H. G. Steinrück, B. L. Fisher, R. Shahbazian-Yassar, M. F. Toney, M. C. Hersam and J. W. Elam, Novel ALD Chemistry Enabled Low-Temperature Synthesis of Lithium Fluoride Coatings for Durable Lithium Anodes, ACS Appl. Mater. Interfaces, 2018, 10, 26972–26981 CrossRef CAS.
- J. N. Kvalvik, K. B. Kvamme, K. Almaas, A. Ruud, H. H. Sønsteby and O. Nilsen, LiF by atomic layer deposition—Made easy, J. Vac. Sci. Technol., A, 2020, 38, 050401 CrossRef CAS.
- Y. Lee, D. M. Piper, A. S. Cavanagh, M. J. Young, S. Lee and S. M. George, Atomic Layer Deposition of LiF and Lithium Ion Conducting (AlF3)(LiF)x Alloys Using Trimethylaluminum, Lithium Hexamethyldisilazide and Hydrogen Fluoride, ChemRxiv, 2017, 1–37 Search PubMed.
- J. Hennessy and S. Nikzad, Atomic Layer Deposition of Lithium Fluoride Optical Coatings for the Ultraviolet, Inorganics, 2018, 6, 46 CrossRef.
- W. D. Richards, L. J. Miara, Y. Wang, J. C. Kim and G. Ceder, Interface Stability in Solid-State Batteries, Chem. Mater., 2016, 28, 266–273 CrossRef CAS.
- M. Kumar, S. A. Khan, P. Rajput, F. Singh, A. Tripathi, D. K. Avasthi and A. C. Pandey, Size effect on electronic sputtering of LiF thin films, J. Appl. Phys., 2007, 102, 083510 CrossRef.
- L. S. Combes, S. S. Ballard and K. A. McCarthy, Mechanical and Thermal Properties of Certain Optical Crystalline Materials, J. Opt. Soc. Am., 1951, 41, 215–222 CrossRef CAS.
- J. Xie, L. Liao, Y. Gong, Y. Li, F. Shi, A. Pei, J. Sun, R. Zhang, B. Kong, R. Subbaraman, J. Christensen and Y. Cui, Stitching h-BN by atomic layer deposition of LiF as a stable interface for lithium metal anode, Sci. Adv., 2017, 3, eaao3170 CrossRef PubMed.
- S. Choudhury and L. A. Archer, Lithium Fluoride Additives for Stable Cycling of Lithium Batteries at High Current Densities, Adv. Electron. Mater., 2016, 2, 1500246 CrossRef.
- D. M. Roessler and W. C. Walker, Electronic spectrum of crystalline lithium fluoride, J. Phys. Chem. Solids, 1967, 28, 1507–1515 CrossRef CAS.
- H. H. Li, Refractive index of alkali halides and its wavelength and temperature derivatives, J. Phys. Chem. Ref. Data, 1976, 5, 329–528 CrossRef CAS.
- B. Fleming, M. Quijada, J. Hennessy, A. Egan, J. Del Hoyo, B. A. Hicks, J. Wiley, N. Kruczek, N. Erickson and K. France, Advanced environmentally resistant lithium fluoride mirror coatings for the next generation of broadband space observatories, Appl. Opt., 2017, 56, 9941–9950 CrossRef CAS.
- Y. Kim, Power-law-type electron injection through lithium fluoride nanolayers in phosphorescence organic light-emitting devices, Nanotechnology, 2008, 19, 355207 CrossRef.
- L. S. Hung, C. W. Tang and M. G. Mason, Enhanced electron injection in organic electroluminescence devices using an Al/LiF electrode, Appl. Phys. Lett., 1997, 70, 152–154 CrossRef CAS.
- S. E. Shaheen, C. J. Brabec, N. S. Sariciftci, F. Padinger, T. Fromherz and J. C. Hummelen, 2.5% Efficient Organic Plastic Solar Cells, Appl. Phys. Lett., 2001, 78, 841–843 CrossRef CAS.
- J. Bullock, P. Zheng, Q. Jeangros, M. Tosun, M. Hettick, C. M. Sutter-Fella, Y. Wan, T. Allen, D. Yan, D. Macdonald, S. De Wolf, A. Hessler-Wyser, A. Cuevas and A. Javey, Lithium Fluoride Based Electron Contacts for High Efficiency n-Type Crystalline Silicon Solar Cells, Adv. Energy Mater., 2016, 6, 1600241 CrossRef.
- T. Oi and K. Miyauchi, Amorphous thin film ionic conductors of mLiF.nAlF3, Mater. Res. Bull., 1981, 16, 1281–1289 CrossRef CAS.
- L. G. Schulz, The structure and growth of evaporation LiF and NaCl films on amorphous substrates, J. Chem. Phys., 1949, 17, 1153–1162 CrossRef CAS.
- S. J. Henley, M. N. R. Ashfold and S. R. J. Pearce, The structure and composition of lithium fluoride films grown by off-axis pulsed laser ablation, Appl. Surf. Sci., 2003, 217, 68–77 CrossRef CAS.
- S. M. George, Atomic layer deposition: An overview, Chem. Rev., 2010, 110, 111–131 CrossRef CAS PubMed.
- M. F. J. Vos, H. C. M. Knoops, R. A. Synowicki, W. M. M. Kessels and A. J. M. Mackus, Atomic layer deposition of aluminum fluoride using Al(CH3)3 and SF6 plasma, Appl. Phys. Lett., 2017, 111, 113105 CrossRef.
- T. Fjeldberg, M. F. Lappert and A. J. Thorne, The molecular structure of dimeric bis(trimethylsilyl)amidolithium, [LiN(Si(CH3)3)2]2, as determined by gas-phase electron diffraction, J. Mol. Struct., 1984, 125, 265–275 CrossRef CAS.
- Y. Tomczak, K. Knapas, M. Sundberg, M. Leskelä and M. Ritala, In situ reaction mechanism studies on lithium hexadimethyldisilazide and ozone atomic layer deposition process for lithium silicate, J. Phys. Chem. C, 2013, 117, 14241–14246 CrossRef CAS.
- C. R. Brundle, B. V. Crist and P. S. Bagus, Accuracy limitations for composition analysis by XPS using relative peak intensities: LiF as an example, J. Vac. Sci. Technol., A, 2021, 39, 013202 CrossRef CAS.
- M. H. Engelhard, D. R. Baer, A. Herrera-Gomez and P. M. A. Sherwood, Introductory guide to backgrounds in XPS spectra and their impact on determining peak intensities, J. Vac. Sci. Technol., A, 2020, 38, 063203 CrossRef CAS.
- N. P. Barradas and C. Jeynes, Advanced physics and algorithms in the IBA DataFurnace, Nucl. Instrum. Methods Phys. Res., Sect. B, 2008, 266, 1875–1879 CrossRef CAS.
- V. Paneta, A. Kafkarkou, M. Kokkoris and A. Lagoyannis, Differential cross-section measurements for the 7Li(p,p 0) 7Li, 7Li(p,p 1) 7Li, 7Li(p,α 0) 4He, 19F(p,p 0) 19F, 19F(p,α 0) 16O and 19F(p,α 1,2) 16O reactions, Nucl. Instrum. Methods Phys. Res., Sect. B, 2012, 288, 53–59 CrossRef CAS.
- N. Hornsveld, W. M. M. Kessels and M. Creatore, Mass Spectrometry Study of Li2CO3 Film Growth by Thermal and Plasma-Assisted Atomic Layer Deposition, J. Phys. Chem. C, 2019, 123, 4109–4115 CrossRef CAS.
- H. C. M. Knoops, E. M. J. Braeken, K. de Peuter, S. E. Potts, S. Haukka, V. Pore and W. M. M. Kessels, Atomic Layer Deposition of Silicon Nitride from Bis(tert-butylamino)silane and N2 Plasma, ACS Appl. Mater. Interfaces, 2015, 7, 19857–19862 CrossRef CAS PubMed.
- W. E. Morgan, J. R. Van Wazer and W. J. Stec, Inner-Orbital Photoelectron Spectroscopy of the Alkali Metal Halides, Perchlorates, Phosphates, and Pyrophosphates, J. Am. Chem. Soc., 1973, 95, 751–755 CrossRef CAS.
- N. Hornsveld, B. Put, W. M. M. Kessels, P. M. Vereecken and M. Creatore, Plasma-assisted and thermal atomic layer deposition of electrochemically active Li2CO3, RSC Adv., 2017, 7, 41359–41368 RSC.
- C. Jeynes, N. P. Barradas and E. Szilágyi, Accurate determination of quantity of material in thin films by Rutherford backscattering spectrometry, Anal. Chem., 2012, 84, 6061–6069 CrossRef CAS PubMed.
- D. R. Lide, CRC Handbook of Chemistry and Physics, CRC Press, Boca Raton, 2005 Search PubMed.
- M. E. Straumanis, The precision determination of lattice constants by the powder and rotating crystal methods and applications, J. Appl. Phys., 1949, 20, 726–734 CrossRef CAS.
- H. Sadeghi, M. R. Jalali, S. Mohammadi and M. K. Tehrani, The Electronic Structure Properties of Defect Centers In LiF and LiF: Mg Quantum Dot and Thermo-Luminescent Process, J. Basic Appl. Sci. Res., 2013, 3, 806–814 Search PubMed.
- S. Leroy, H. Martinez, R. Dedryvère, D. Lemordant and D. Gonbeau, Influence of the lithium salt nature over the surface film formation on a graphite electrode in Li-ion batteries: An XPS study, Appl. Surf. Sci., 2007, 253, 4895–4905 CrossRef CAS.
- L. H. Abu-Hassan and P. D. Townsend, Ion implantation in LiF to form F and F2 centres, J. Phys. C: Solid State Phys., 1986, 19, 99–110 CrossRef CAS.
- K. Schwartz, C. Trautmann, A. S. El-Said, R. Neumann, M. Toulemonde and W. Knolle, Color-center creation in LiF under irradiation with swift heavy ions: Dependence on energy loss and fluence, Phys. Rev. B: Condens. Matter Mater. Phys., 2004, 70, 184104 CrossRef.
- G. Baldacchini, G. d’Auria, R. M. Montereali and A. Scacco, Colour centres induced in LiF by low-energy electrons, J. Phys.: Condens. Matter, 1998, 10, 857–867 CrossRef CAS.
- P. Warneck and LiF Color-Center, Formation and uv Transmission Losses from Argon and Hydrogen Discharges, J. Opt. Soc. Am., 1965, 55, 921–925 CrossRef CAS.
- Y. Lee, H. Sun, M. J. Young and S. M. George, Atomic Layer Deposition of Metal Fluorides Using HF-Pyridine as the Fluorine Precursor, Chem. Mater., 2016, 28, 2022–2032 CrossRef CAS.
- A. G. Sharkey, R. A. Friedel and S. H. Langer, Mass Spectra of Trimethylsilyl Derivatives, Anal. Chem., 1957, 29, 770–776 CrossRef CAS.
- NIST Chemistry WebBook, https://webbook.nist.gov, (accessed 8 Oktober 2019) Search PubMed.
- J. Tamás and P. Miklós, Mass spectrometric study of hexamethyldisilazane and some of its N-substituted derivatives, Org. Mass Spectrom., 1975, 10, 859–866 CrossRef.
- S.-J. Oh, H.-C. Lee and C.-W. Chung, A study on plasma parameters in Ar/SF6 inductively coupled plasma, Phys. Plasmas, 2017, 24, 013512 CrossRef.
- G. Kokkoris, A. Panagiotopoulos, A. Goodyear, M. Cooke and E. Gogolides, A global model for SF6 plasmas coupling reaction kinetics in the gas phase and on the surface of the reactor walls, J. Phys. D: Appl. Phys., 2009, 42, 055209 CrossRef.
- M. Mao, Y. N. Wang and A. Bogaerts, Numerical study of the plasma chemistry in inductively coupled SF6 and SF6/Ar plasmas used for deep silicon etching applications, J. Phys. D: Appl. Phys., 2011, 44, 435202 CrossRef.
- Y.-R. Luo, Comprehensive Handbook of Chemical Bond Energies, CRC Press, Boca Raton, 1st edn, 2007 Search PubMed.
Footnote |
| † Electronic supplementary information (ESI) available. See DOI: 10.1039/d0cp05428c |
| This journal is © the Owner Societies 2021 |

