
 Open Access Article
 This Open Access Article is licensed under a Creative Commons Attribution-Non Commercial 3.0 Unported Licence
Structural and dynamic properties of some aqueous salt solutions†
Olivera
Drecun
a,
Alberto
Striolo
 *a and
Cecilia
Bernardini
b
*a and
Cecilia
Bernardini
b
aDepartment of Chemical Engineering, University College London, UK. E-mail: a.striolo@ucl.ac.uk
bJohnson Matthey Technology Centre, Blount's Ct, Sonning Common, Reading, UK
First published on 1st July 2021
Abstract
Aqueous salt solutions are utilized and encountered in wide-ranging technological applications and natural settings. Towards improved understanding of the effect of salts on the dynamic properties of such systems, dilute aqueous salt solutions (up to 1 molar concentration) are investigated here, via experiments and molecular simulations. Four salts are considered: sodium chloride, for which published results are readily available for comparison, ammonium acetate, barium acetate and barium nitrate, for which published data are scarce. In the present work, molecular dynamics (MD) simulations are conducted to quantify viscosity and water self-diffusion coefficients, together with rheometry and Pulsed Field Gradient Spin Echo (PFGSE)-NMR experiments for validation. Simulation predictions are consistent with experimental observations in terms of trend and magnitude of salt-specific effects. Combining insights from the approaches considered, an interpretation of the results is proposed whereby the capacity of salts to influence bulk dynamics arises from their molecular interfacial area and strength of interaction with first hydration-shell water molecules. For the concentration range investigated, the interpretation could be useful in formulating aqueous systems for applications including the manufacturing of advanced catalysts.
Introduction
The structural and transport properties of aqueous salt solutions manifest from molecular structure and interactions, i.e. the substance itself, externally applied force (e.g. shear rate), and ambient conditions, namely temperature and pressure. Molecular structure and interaction mechanisms can be probed via theoretical, experimental and computational approaches. Among computational approaches, molecular dynamics (MD) simulations at atomistic resolution have been widely implemented to elucidate the mechanisms responsible for macroscale experimental observables.1–5Of interest here are transport and structural properties of dilute aqueous salt solutions, and the influence of salt-specific effects. Salt-specific effects were first addressed by Hofmeister, whose series was conceived as a qualitative ranking of ions regarding their ability to solubilize or precipitate proteins in aqueous solution.6 The concept has since been applied far beyond its original context. The resulting extent of series permutations and terminology7 suggests the only unifying conclusion is that of no universal series capable of explaining all observed salt-specific effects.
In aqueous solutions, observed salt-specific effects have long been associated with the capacity of ions to ‘make’ (‘kosmotropic’) or ‘break’ (‘chaotropic’) water hydrogen-bonding structure, mainly within the first ion–water coordination shell. This relates to ion solvation entropy – entropy change of water molecules due to presence of an ion8,9 – and the activation energy of disengaging a water molecule from the first coordination shell of an ion, compared to that of another water molecule.10,11 Parsing contributions to solvation entropy due to the ion and due to water, ‘kosmotropic’ ions are mostly found to decrease the entropy of water molecules, with the opposite effect for ‘chaotropic’ ions. Experimental studies have since honed this interpretation,12–16 suggesting that Hofmeister effects in aqueous solution are the result of direct ion–solvent interactions that give rise to extended hydration shells.17,18
Considering Hofmeister-type mechanisms in electrolyte solutions, colloids and protein systems, the comprehensive review of Salis and Ninham19 suggests that any theory behind accurate modelling of Hofmeister effects requires the inclusion of dispersion forces, while also accounting for the chemical nature of interacting species. The latter has, at qualitative level, been implemented successfully by the law of matching water affinities (LMWA) to describe ion–ion and ion-charged surface site interactions.20,21 The importance of dispersion forces has been emphasized in explaining the properties of biological and colloidal systems;22 correlations between pH, the isoelectric point (pI) and the experimentally-observed reversed and direct Hofmeister sequences emerge from theory that incorporates the non-linear coupling of ionic dispersion and electrostatic forces.23
Aqueous solutions of ammonium acetate, barium acetate, barium nitrate and sodium chloride, ≤1 molar concentration, at ambient conditions, are the focus of this study (Fig. 1). Of these, the structural and dynamic properties of sodium chloride solutions are the most-documented by both MD simulations27–34 and experiments.35–37 Amongst its widespread occurrences, in geological settings, sodium chloride is the most common solute in aqueous fluids; its thermodynamic properties are therefore essential for modelling and interpreting many geological processes.34 Ammonium acetate is commonly used as a solution buffer (at ∼pH 4.75 or 9.25)38 and acidity regulator, among numerous other industrial applications.39 Barium, incorporated as barium oxide within the washcoat layer of three-way catalytic converters, is an important trap and storage component for NO2 in the Lean NOx Trap mechanism.40 For this application, a precursor aqueous solution incorporating barium, nitrate and acetate ionic species is combined with a suspension of inorganic mixed oxides to impregnate the substrate; thermal decomposition to barium oxide occurs during subsequent calcination.
 | ||
| Fig. 1 Salt (ion-pair) schematics. Left to right: ammonium acetate, barium acetate, barium nitrate, sodium chloride. Top panel: ball and stick representation, with implemented atom notations. Lower panel: schematics indicate relative atomic sizes. Radii are taken from an empirical system of unified atomic-ionic radii, suitable for describing anion–cation contacts in ionic structures.24–26 | ||
Despite diverse important applications, published data on the structural and dynamic properties of these aqueous salt solutions (apart from sodium chloride) are limited. In the present work, viscosity and self-diffusion coefficients are quantified using atomistic MD simulations to probe the ion-induced hydration structure and dynamics at molecular scale, together with rheometry and NMR experiments.
In what follows, new experimental and computational data are presented, testing simulation predictions for the properties of interest using existing force-field parameters. Results are correlated with physicochemical and thermodynamic properties of the corresponding ions, compiled from literature data, to identify the mechanisms through which the salts considered could modulate bulk transport properties of their aqueous solutions.
Simulation details
Methods
All simulations were performed using the freely available software LAMMPS,41 (version 16 Mar 2018). The velocity Verlet algorithm42 was implemented to integrate the equations of motion, with a 1 fs time step. Simulations were conducted with periodic boundary conditions in the canonical ensemble: constant number of particles (N), volume (V) and temperature (T), maintained by the Nosé–Hoover thermostat43,44 (100 fs damping parameter). A cubic simulation box containing 11![[thin space (1/6-em)]](https://www.rsc.org/images/entities/char_2009.gif) 089 water molecules was used, with side-length varied between 69.3–69.7 Å to attain experimental densities. Long-range interactions were treated with the particle–particle–particle–mesh (pppm) solver.45
089 water molecules was used, with side-length varied between 69.3–69.7 Å to attain experimental densities. Long-range interactions were treated with the particle–particle–particle–mesh (pppm) solver.45
Force-fields
After initial screening of three water models (Fig. S1 of ESI†), the SPC/E model46 was utilized, based on yielding satisfactory agreement with experimental properties of interest, modest computational cost and broader compatibility compared to the TIP4P/200547 water model. In our simulations, O–H bond lengths and the H–O–H angle in each water molecule were maintained rigid using the SHAKE algorithm,48 as implemented in LAMMPS.Force fields parameters developed for use in conjunction with the SPC/E water model were applied to simulate ion pairs where possible. The widely used Joung–Cheatham model49 for sodium and chloride ions, parameterized for SPC/E water, was therefore implemented, without polarizability. For barium nitrate, parameters for the nitrate ion50 have previously been utilized to reproduce ion transport properties in aqueous (SPC/E) solutions of sodium and potassium, but not barium, nitrate. The parameters were implemented here with those of Mamatkulov et al.51 for the barium ion, developed to reproduce the solvation free energy of divalent ions with SPC/E water. For ammonium acetate, a recently developed parameter set52 incorporating the acetate ion, optimized to reproduce interactions with (TIP3P) water, and physiologically relevant cations, including ammonium, was utilized. The new parameterization improves upon limitations of the original GAFF53–56 parameters, namely, the overestimation of anion–cation interactions, leading to an excessive number of contact ion pairs in solutions of carboxylate ions (such as acetate). Within the parameterisations implemented, ion pairs are free to associate or dissociate in response to system conditions. To quantify the dissociation behaviour, ion–ion radial distribution functions were computed (Fig. S2, ESI†). The results suggest that NaCl is readily dissociated at the conditions considered, while the other ion pairs show different dissociation tendencies, qualitatively consistent with physicochemical properties of these systems.
Force field parameters as implemented in this work are presented in Table S1 of the ESI.† Interaction energies are modelled using the Lennard-Jones and Coulomb potentials. Non-bonded interactions are truncated at 10 Å, with the exception of aqueous sodium chloride simulations, for which non-bonded interactions are truncated at 9 Å. Mixed atom-type interaction potentials are calculated from self-interaction parameters using Lorentz–Berthelot combining rules.
Algorithms
Viscosity values are obtained from three independent 12 ns simulations per concentration, for each salt type. The first 6 ns are dropped from analysis, with the remaining 6 ns used for production. Viscosity values, computed every 500 fs, are averaged over the latter 6 ns to yield a mean value for each simulation production run. Simulation viscosity values quoted in the manuscript are the mean average of three production runs. Viscosity results for pure water, inclusive of block averages and error analysis, are reported in Table S2, ESI,† as a function of simulation time. This analysis was used to establish the simulation time required to achieve reliable data (Tables S3 and S4, ESI†). The reported uncertainty in our viscosity calculations is defined as standard deviation from the mean average value of the three production runs, and lies within 2%, for all salt types and concentrations considered.
Self-diffusion coefficients (D) were obtained from the slope of MSD-over-time plots using the Einstein relation60,61 with n (dimensionality of the diffusion process) = 3:
 | (1) |
Experimental methods
Shear (dynamic) viscosity
Aqueous salt solutions were prepared by volume, using 50 ml volumetric flasks (accuracy ±0.5 ml). Salts were weighed out using a Kern ABT analytical balance; resolution ±0.1 mg. Accuracy of concentration values for the prepared solutions is ≤1.32% (percentage difference) from the target concentrations (see ESI† excel file). For barium nitrate, the maximum concentration prepared was 0.3 M due to its low water solubility at ambient conditions.62–64 It should be noted that ammonium and acetate ions in aqueous solution can undergo hydrolysis to ammonia and acetic acid, respectively; the extent of conversion depending on water pH [H+]. Barium, sodium, nitrate and chloride ions are insensitive to pH. However, these effects are not considered in the discussion of the results reported, nor the simulations conducted and presented herein.Viscosity measurements were conducted at 26 °C, using an Anton Paar modular compact rheometer (MCR 302) with Peltier plate temperature control and cone–plate geometry. Prior to measurements, samples were given 2 minutes to thermally equilibrate with the sample plate. Measurements were taken over a 60 second duration, with sampling interval of 1 s per data point, at a fixed shear rate of 300 s−1. The results reported are the average of three measurements per solution, with a new sample loaded for each measurement. Further experimental details are provided in Table 1.
| Experimental component: | Details | |
|---|---|---|
| Rheometer set-up: | RheoCompass™ pre-defined moving profile: | ‘Low viscosity’ |
| Cone-and -plate geometry: | Measuring cone CP50-1 | |
| Diameter: | 50 mm | |
| Angle: | 1° | |
| Gap: | 0.099 mm | |
| Salts | ||
| • Ammonium acetate | Certified AR for Analysis; Fisher Chemical | |
| • Barium acetate | 99+%, Fisher Chemical | |
| • Barium nitrate | 99+%, Fisher Chemical | |
| • Sodium chloride | 99.9% BP, ACS, PH EUR, FCC; APC Pure | |
| Water | PURELAB Chorus 2+ Reference Water Purification System, inorganics resistivity (25 °C): >15 MΩ cm. Particle filtration: 0.2 μm | |
Translational self-diffusion
Self-diffusion measurements were conducted using a Magritek Spinsolve 60 Benchtop NMR spectrometer (60 MHz field strength). The Pulsed Field Gradient Spin Echo (PFGSE) technique, utilising 1H (proton) nucleus spin diffusion, was implemented. With this technique, the dephasing of nuclear spins and attenuation of the magnetic resonance signal, a combined result of translational diffusion and the insertion of spatially defined gradient pulses, is used to measure molecular motion.Spin echo65 is generated by two successive radiofrequency (RF) pulses, typically a 90° (excitation)−180° (refocusing) pair of the same signal intensity and duration. The second pulse refocuses (‘echoes’) the magnetization of spins that have de-phased. However, molecular diffusion in the interval between gradient pulses means the refocusing will not restore the original spins entirely, causing attenuation of the NMR signal. The signal loss is directly dependent on the gradient pulse amplitude and duration. Signal decay due to diffusion, for constant gradient wave forms and in the case of Gaussian diffusion, is given by the Stejskal–Tanner66 equation:
| ln(IG/I0) = −γ2G2δ2(Δ − δ/3)D | (2) |
Results
To facilitate comparison between simulations and experiments, the results are expressed as the ratios η/η0 and D/D0, for viscosity and self-diffusion, respectively; reference values η0 and D0 are for pure water at 26 °C, atmospheric pressure. Regarding simulations, system size dependence of water self-diffusion values, for N = 128 to 2048 water molecules, was noted by Yeh and Hummer,68 whereby larger systems produce higher D values. The ratio D/D0, however, is independent of system size.69 In what follows, results are presented both tabulated and graphed, to aid interpretation.Normalized simulation and experimental viscosity data are shown in Table 2 and Fig. 2. For simulation results, standard deviations are ≤0.68% (as a percentage of the mean viscosity value, from three simulations per salt solution). For the experimental data, standard deviations are within 2.13% of the mean viscosity value as obtained from three measurements per salt solution. Error bars for all normalized data points are plotted in Fig. 2, but are not clearly visible because they are of the magnitude of the data-markers on the graphs. Results for aqueous sodium chloride solutions are within 1.98% of corresponding literature values35 available at 25 °C from the comprehensive compilation of Ozbek et al.35 These are consistent with values found across more recent publications70,71 (a table conveniently summarizing experimental studies of the dynamic viscosity of aqueous sodium chloride solutions can be found in Aleksandrov et al.72), and data referenced by NIST.73 The data of Ozbek et al.35 is normalized and presented alongside the results of Fig. 2.
| Molar concentration | Ammonium acetate | Barium acetate | Barium nitrate | Sodium chloride | ||||
|---|---|---|---|---|---|---|---|---|
| Sim. | Exp. | Sim. | Exp. | Sim. | Exp. | Sim. | Exp. | |
| 0.1 | 1.0245 | 1.0807 | 1.0829 | 1.1269 | 1.0491 | 1.0703 | 1.0203 | 1.0600 |
| 0.5 (*0.2) | 1.1431 | 1.1717 | 1.5213 | 1.4883 | 1.1034 | 1.0936 | 1.1226 | 1.0947 |
| 1.0 (*0.3) | 1.3252 | 1.2961 | 2.1977 | 2.1103 | 1.1979 | 1.1183 | 1.2577 | 1.1617 |
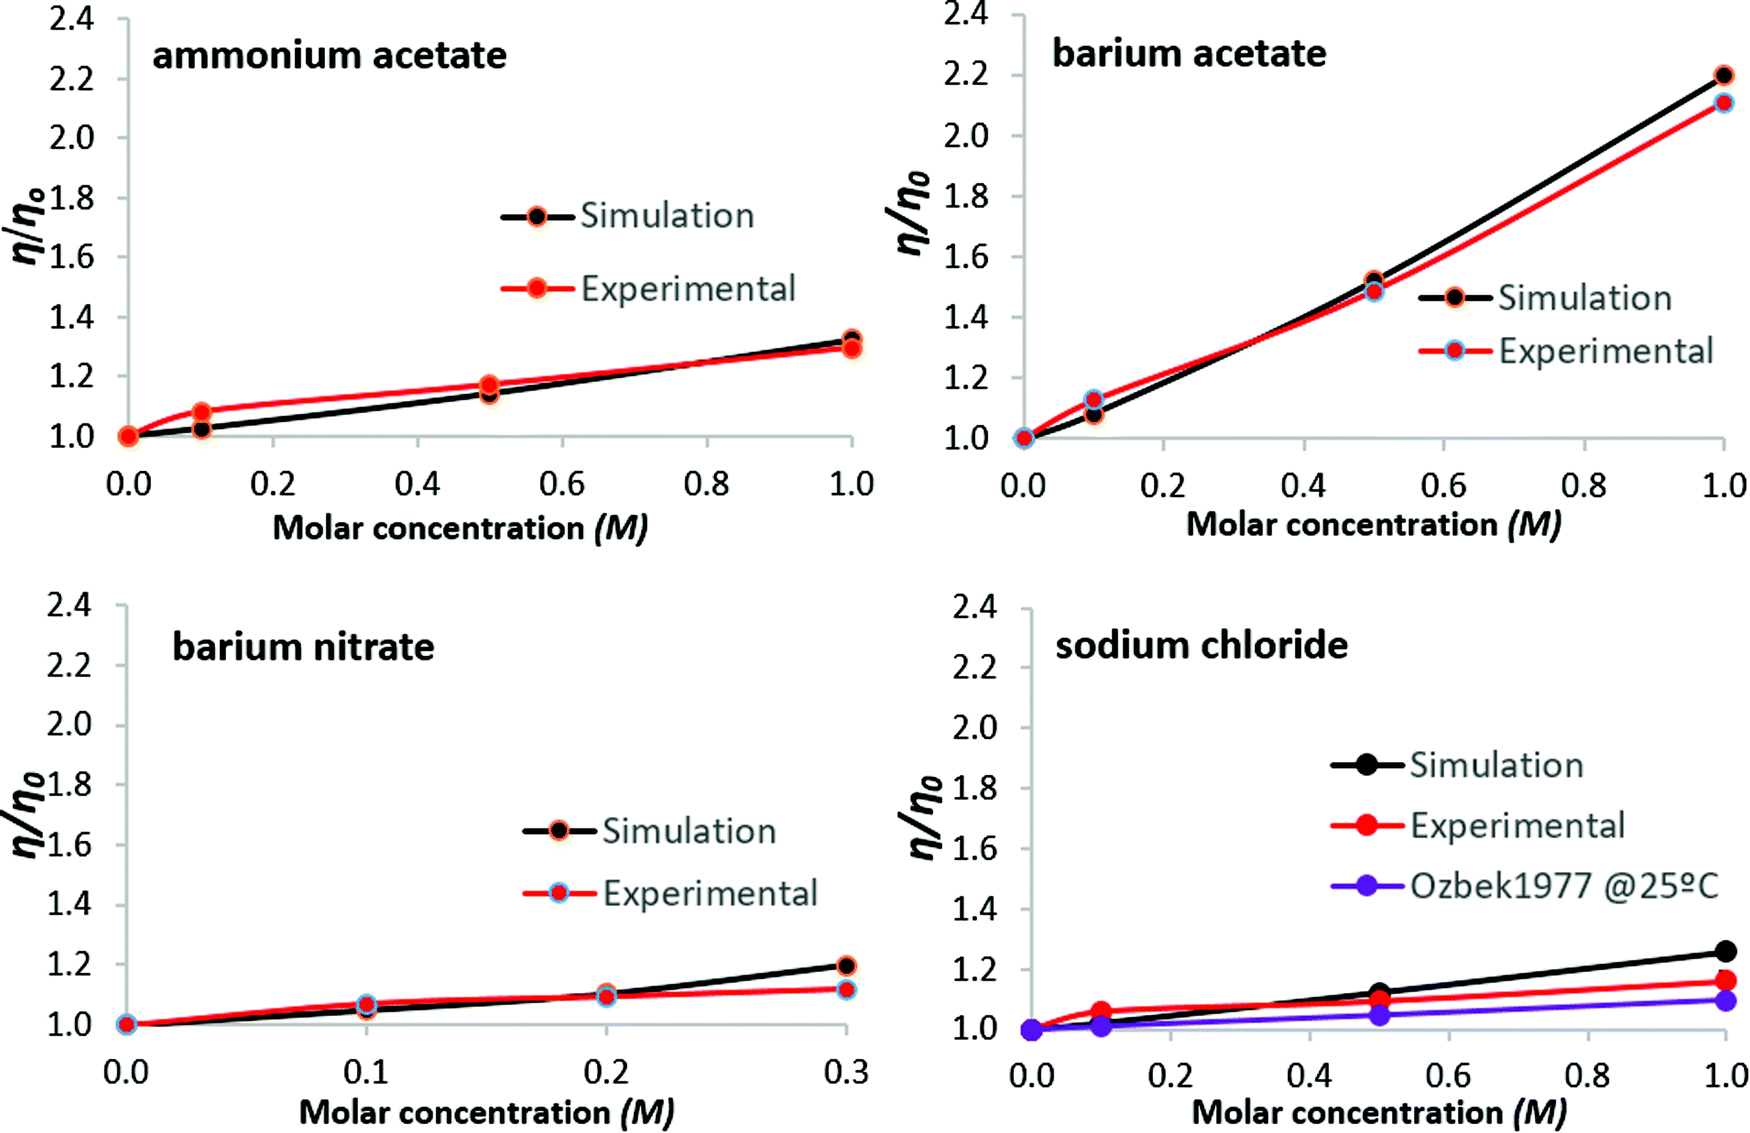 | ||
| Fig. 2 Viscosity of aqueous salt solutions at 26 °C: salt concentration dependence. Experimental data from Ozbek et al.,35 for aqueous sodium chloride at 25 °C, are normalized and included for comparison. Lines are guides to the eye. | ||
Normalized results for water self-diffusion coefficients at 26 °C are shown in Table 3 and Fig. 3. The statistical range of triplicate simulation results is of magnitude comparable to that of the plot data-markers. Standard deviation for simulation results is within 2% of the mean value, and ≤1.07% for mean values of experimental self-diffusion measurements, taken over three measurements per sample. Simulation results for NaCl solutions in Fig. 3 are shown together with (normalized) values from Fuentes-Azcatl et al.,74 at 24.85 °C, utilising the same water model and ion parameters. Experimental data are sourced from McCall & Douglass,75 who conducted experiments at 23 °C using the proton magnetic resonance spin-echo method.
| Molar concentration | Ammonium acetate | Barium acetate | Barium nitrate | Sodium chloride | ||||
|---|---|---|---|---|---|---|---|---|
| Sim. | Exp. | Sim. | Exp. | Sim. | Exp. | Sim. | Exp. | |
| 0.1 | 1.0072 | 0.9728 | 0.9386 | 0.9058 | 0.9856 | 0.9883 | 0.9964 | 1.0000 |
| 0.5 (*0.3) | 0.9170 | 0.9105 | 0.7473 | 0.7354 | 0.8664 | 0.9221 | 0.8917 | 0.9650 |
| 1.0 | 0.8087 | 0.8366 | 0.5560 | 0.5689 | 0.8375 | 0.9377 | ||
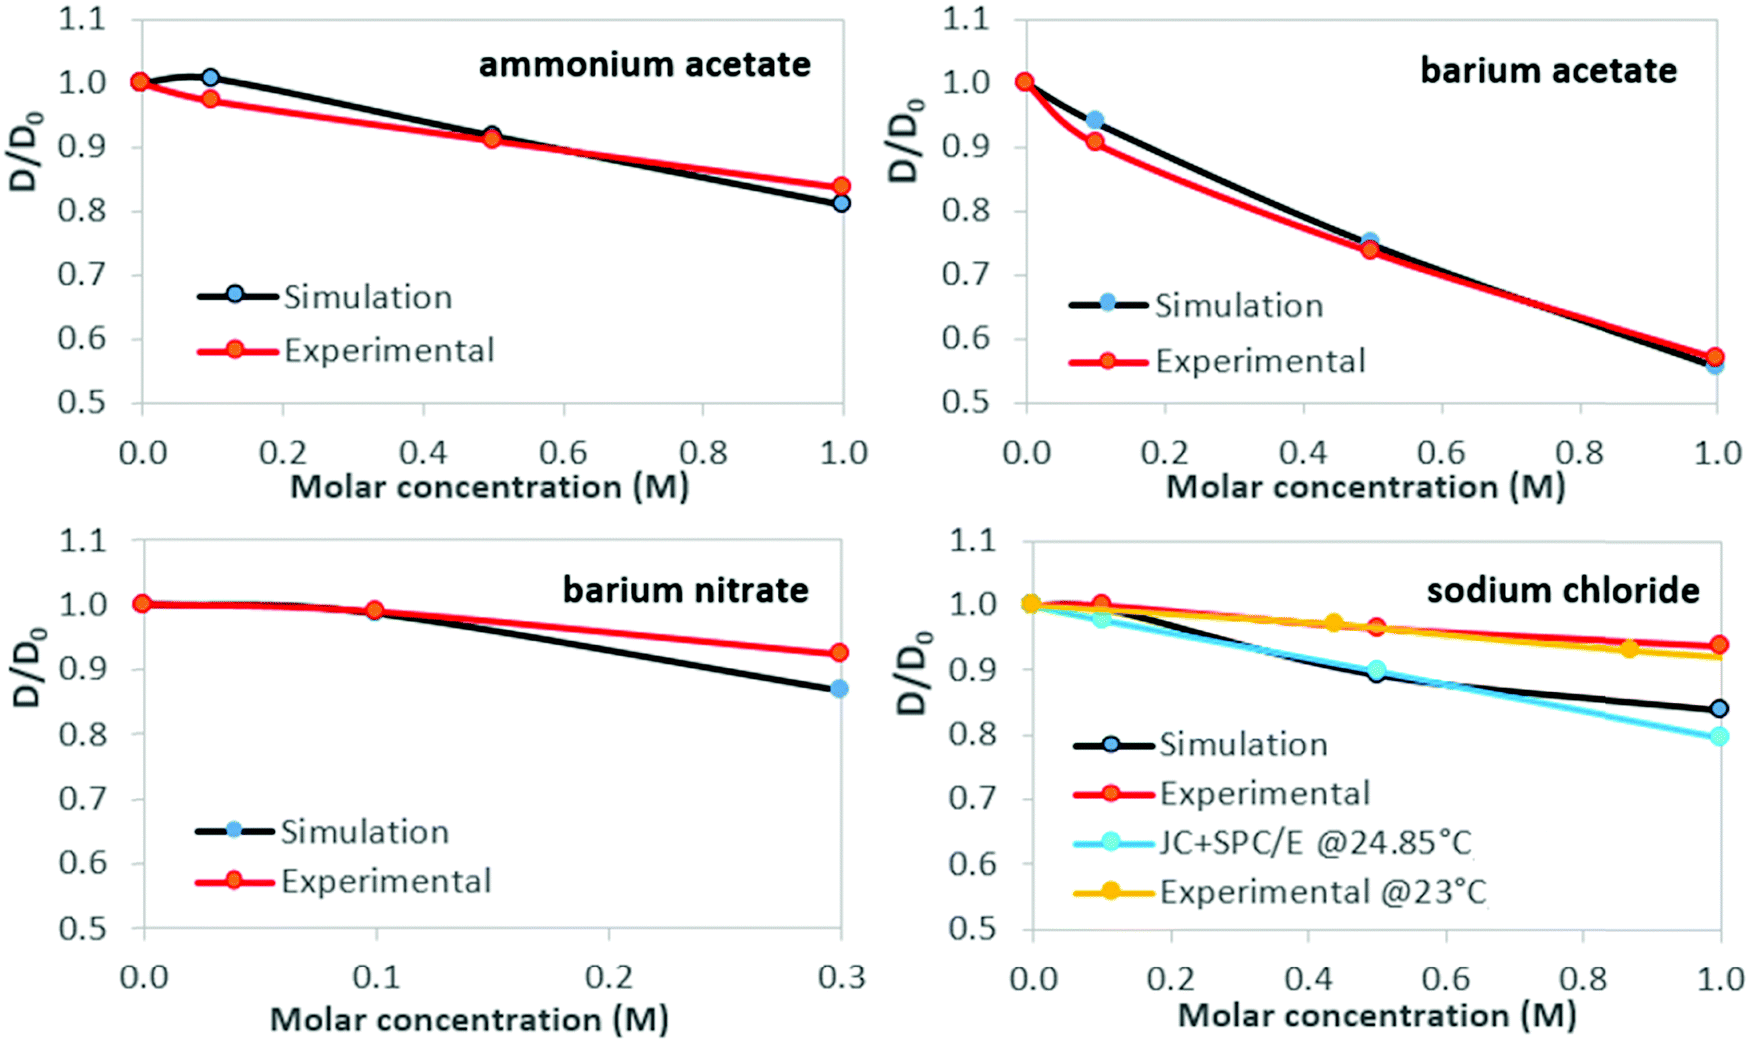 | ||
| Fig. 3 Water self-diffusion in aqueous salt solutions at 26 °C: concentration dependence. Clockwise, from top left: ammonium acetate, barium acetate, sodium chloride, barium nitrate. Water self-diffusion reference data for aqueous sodium chloride solutions (MD simulation74 and experimental75) are shown for comparison. Lines are guides to the eye. | ||
Fig. 4 presents ion–water RDFs obtained for the salt solutions at 1 M concentration, grouped to aid comparison. Results for all salt concentrations, with comparison of fit to nearest available literature data, are provided in ESI,† Fig. S3–S6 for ammonium acetate, barium acetate, sodium chloride and barium nitrate, respectively.
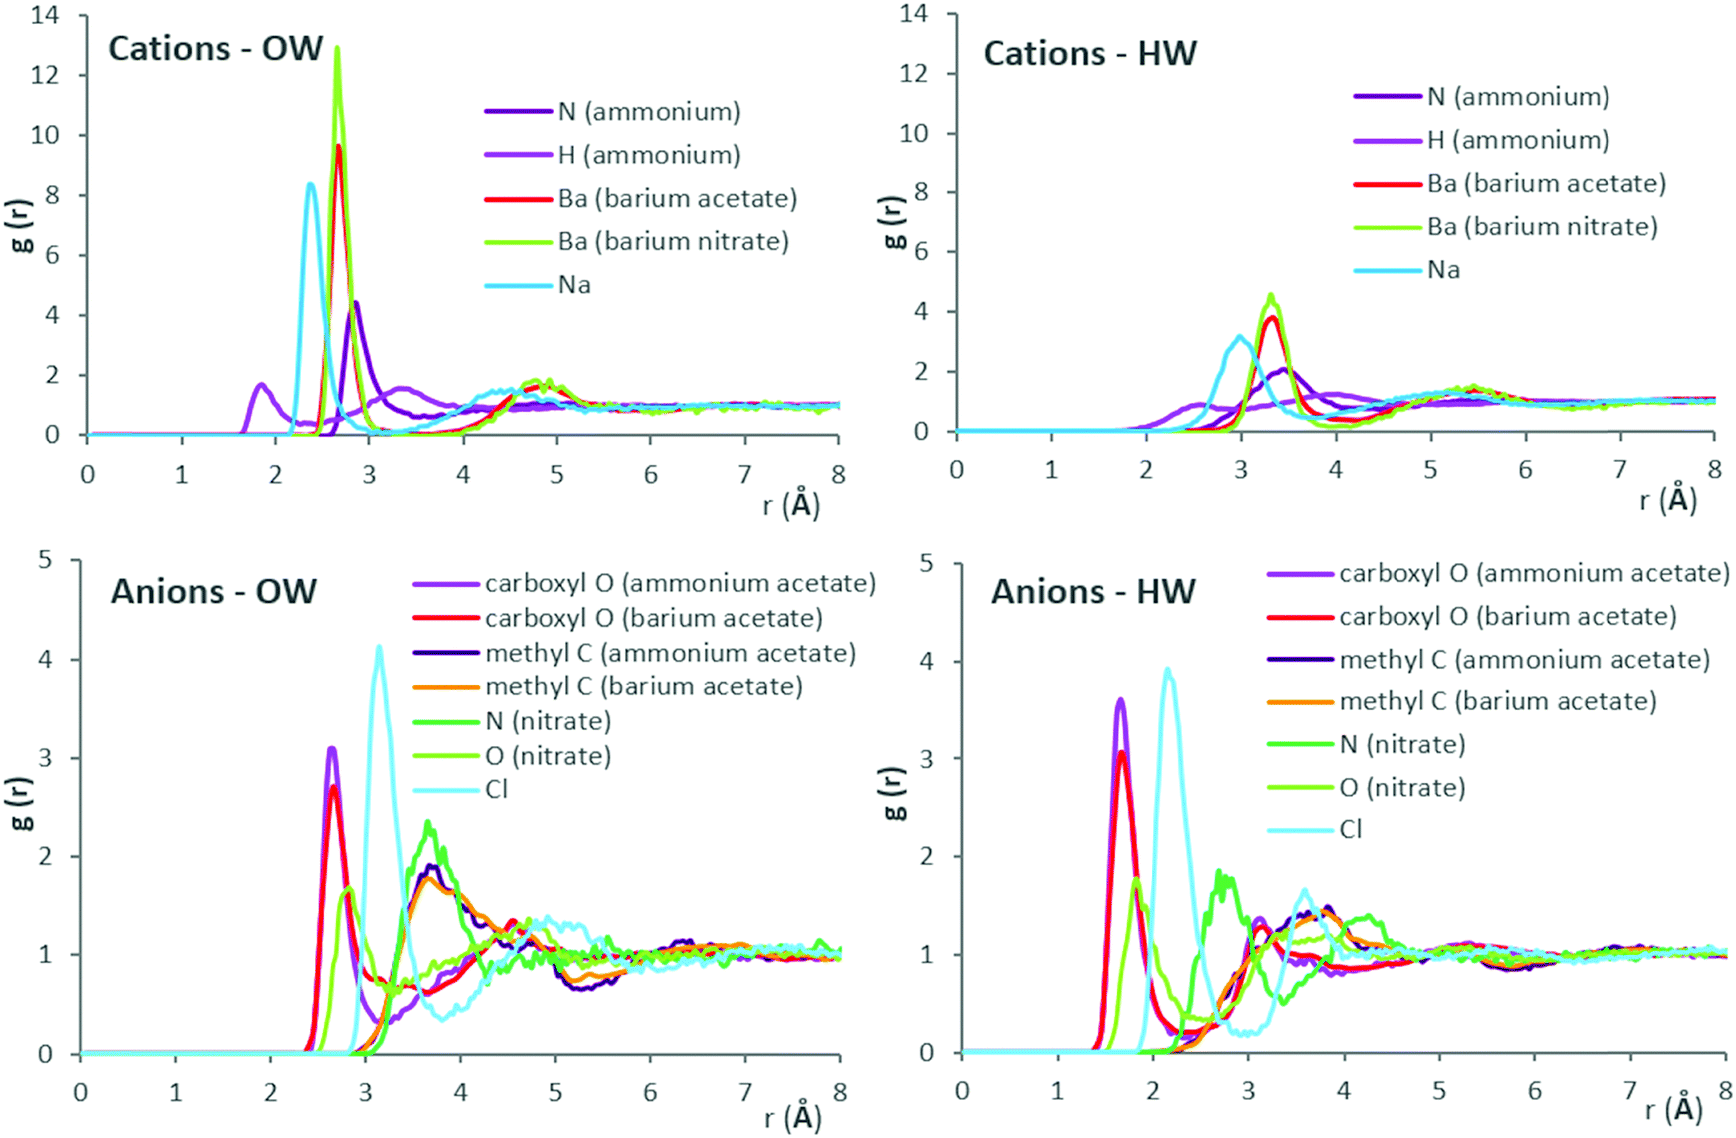 | ||
| Fig. 4 Ion–water (OW, HW) radial distribution functions (RDFs) obtained from MD simulations for salt solutions at 1 M concentration, except barium nitrate (0.3 M, which is near its solubility limit at 26 °C). | ||
Discussion
While discrepancies between simulation predictions and experimental results persist in absolute terms, the magnitude of relative change predicted for viscosity and self-diffusion coefficients, as shown by the normalized results of Fig. 2 and 3, is in good agreement.For viscosity, simulation results lie within 8.3% of experimental values; for self-diffusion this extends to 12%, notably for sodium chloride. For all solutions considered, viscosity increases with salt concentration, with proportionally opposite self-diffusion coefficient trends. Regarding self-diffusion coefficient predictions from MD simulations, Kim et al. (2012)69 observed that all commonly used water models (including SPC/E), simulated with a selection of ‘structure-making’ and ‘structure-breaking’ salts, predict a decrease of D as salt concentration increases, even for salts that experimentally yield increased values. This was attributed to the form of the interaction potentials for water models, i.e., the use of simple point charge models to treat water hydrogen bonding and the Lennard-Jones potential to treat non-bonded van der Waals interactions. In the present work, the agreement with experimental trends suggests that salt-specific effects on dynamics are reasonably reproduced by our simulations, though it is recognised that all the salts considered here decrease water self-diffusion, as measured experimentally.
Both simulation and experimental results presented here show barium acetate as having the greatest effect on increasing viscosity and simultaneously reducing the mobility of water molecules, as indicated by the decreased self-diffusion coefficients. Sodium chloride produces the weakest effects, with ammonium acetate and barium nitrate in between, although analysis for barium nitrate is restricted by its low solubility limit.
RDF results are generally in good agreement with literature data, as shown in Fig. S3–S6 of ESI.† Fig. S3 (ESI†) shows results from Monte-Carlo (MC) molecular simulations with TIP4P water for both acetate and ammonium ions76 and classical MD simulations with SPC/E for the acetate ion.77 Results of the present work for the acetate ion are near-identical to literature simulation data, while slight discrepancies emerge for ammonium. For the latter, comparison with ab initio simulation data78 indicate an over-prediction of first-shell number densities by MC and MD methods, for interactions with oxygen atoms of water (OW) in particular. For barium–water systems, available literature data from experiment51 and classical MD simulations51 with SPC/E locate the Ba–OW maxima at 2.75 Å and 2.69 Å, respectively. Using the same water model and barium ion parameters yields the corresponding maxima at 2.65 Å, in the presence of acetate counter-ions. Ion–water RDFs obtained here for sodium chloride appear indistinguishable from classical MD simulation data from literature (at 24.85 °C, M = 1.3877),79 which were also obtained using SPC/E and Joung–Cheatham ion parameters (see Fig. S5, ESI†). However, compared to results obtained from the Empirical Structural Refinement (EPSR) approach,79 over-structured first solvation shells predicted by classical MD simulations become apparent. For barium nitrate systems, the OW number-density peaks at 3.65 Å from the nitrate anion (nitrogen), which agrees with experimental values of 3.5 ± 0.311 Å.81 Results are in reasonable agreement with literature data shown for the nitrate ion in Fig. S6 (ESI†), sourced from an MD study of rotational dynamics in aqueous (SPC/E) nitrate solutions,80 albeit for a dilute system (0.102 M) of potassium nitrate at 26.85 °C.
Considering the RDFs of Fig. 4, out of the cations, barium possesses the most radially distant first hydration shell with highest number density of both (water) oxygens and hydrogens; out to ∼3 and 4 Å, respectively. RDFs of Ba–OW, Ba–HW for barium nitrate and barium acetate are virtually identical in terms of peak positions. This suggests that the anion has no significant effect on hydration shell spacing around the cation. The greater height of the first Ba–OW peak in the presence of the nitrate (g(Ba–OW) ∼ 13) compared to the acetate anion (g(Ba–OW) ∼ 10) is possibly due partly to the lower concentration of barium nitrate (0.3 M, due to solubility limits) and to the corresponding decreased ‘competition’ for water binding sites. Considering the anions, in the presence of barium, water (OW) structuring around (acetate) methyl carbon is diffuse compared to (nitrate) nitrogen; out to ∼5 Å, compared to ∼4.25 Å. The diffuse hydration shells suggest a greater orientational freedom of the inhabitant water molecules. Additionally, acetate (carboxylate) oxygens appear more neutral to OW when compared to nitrate oxygens; g(O–OW) ∼ 2.75 and 1.75, respectively. Three nitrate oxygens (H-bond acceptors) contrast with the acetate possessing two, together with a hydrophobic CH3 group. Considering the above, the greater number density of OW around barium in barium nitrate, compared to barium acetate aqueous solution, could be therefore partly interpreted as an effect of lesser ‘OW interaction engagement’ from its (nitrate) anion counterpart.
For the ammonium cation, the higher peaks, at closer proximity, for OW compared to HW around both the nitrogen and hydrogen atoms, implicate first-shell water molecules as H-bond acceptors for ammonium hydrogens. Comparing RDFs for ammonium acetate and barium acetate (at 1 M concentration), water structuring around acetate (methyl) carbon appears scarcely affected by the cation (whether monovalent ammonium or divalent barium). Considering the oxygen (carboxylate) atoms of acetate however, the occurrence of OW in the transition between first and second hydration shells in the presence of ammonium shows a deeper minima (at 3.1 Å), compared to barium. With the prior comparison of anion effects between barium nitrate and barium acetate, it would appear, at least for the salts presented here, that water-structuring effects of an ion can be affected by its counter-ion; such mutual effects are relevant to phenomena across varied contexts, including water structuring,82 behaviours of ionic liquids83,84 and battery performance energetics.85 For ion hydration shell population densities, it appears that OW around cations comprises the biggest share, especially for the large monoatomic cations. A significantly greater contrast between OW and HW population densities around cations, than for anions, is also apparent, as shown by the RDF peak heights.
To explain the contrasting influences on viscosity and water self-diffusion between sodium chloride and barium acetate, an interplay of factors becomes evident when considering the RDFs, and visualising the ion combinations as in Fig. 1. The RDFs show sodium as the second-most water-structuring cation after barium, due to its smaller size; both are monoatomic, with similar charge density. The weakness of sodium chloride therefore appears to stem from the chloride anion; furthest-placed first hydration shell, weakly bound, due to its large radius and low charge density. The populous, narrow first hydration shell of divalent barium is the combined effect of its large surface area with high charge density. For the acetate counter-ion, observations include diffuse hydration shells around a complex spatial arrangement of charges and resulting attraction–repulsion configurations, compounded by the doubled anion concentration in solution needed to attain charge neutrality. Both variants of interaction strength and engagement, together, appear to strongly affect the bulk dynamics. In water-structuring terms, barium could be described as kosmotropic, as it promotes narrow, densely-populated hydration shells. Conversely, the greater orientational freedom of diffusely bound water molecules around the acetate, with its hydrophobic (methyl group) and hydrophilic (carboxylate) ‘ends’, yields a chaotropic effect (for approximate viscosity Jones–Dole coefficients obtained from our experimental data, see ESI,† Fig. S7). For the acetate anion, a greater ‘local drag’ experienced by bulk water moving past interfacial waters could be anticipated. For polyatomic ions, MD simulations have shown that the translational and rotational motions of ions are coupled; to which the dynamics of surrounding water molecules are coupled in turn.86 Furthermore, for the ions investigated, which included nitrate and acetate, the extent of geometric asymmetry was found to influence diffusivity. Nitrate undergoes faster rotational jump motion in water, with enhanced diffusivity, compared to acetate; rotational diffusivity values obtained were 0.056 ± 0.0024 ps−1 and 0.02 ± 0.003 ps−1, respectively.86 Rotational dielectric friction of the aqueous nitrate ion, 1.44 × 10⁻²⁴ erg s−1, compared to 1.57 × 10⁻²⁴ erg s−1 for acetate,86 confirms the contribution of charge distribution complexity, as well as geometric asymmetry, to hindrance of rotational motion in water.
For further interpretation of our results, selected physicochemical data for the ions considered are compiled in Table 4. In light of the over-structuring of all commonly utilised water models for OW–HW interactions (Fig. S1, ESI†) and possible effects on ion–water coordination number predictions, the coordination numbers in Table 4 are sourced from experimental and quantum-level simulation data.
| Barium | Ammonium | Sodium | Nitrate | Acetate | Chloride | |
|---|---|---|---|---|---|---|
| Aqueous ionic radii,87 Å | 1.36 | 1.48 | 1.02 | 1.79 | 1.62 | 1.81 |
| Experimental molar Gibbs energy of hydration (ΔhydG/kJ mol−1)87 | −1250 | −285 | −365 | −300 | −365 | −340 |
| Ion–water coordination number | 888 | 4–589 | 590 | 2191 | ∼1692 | ∼693 |
| CH3 ∼ 10, COO ∼ 5.5–6.5 | ||||||
| Topological polar surface area,94 Å2 | 0 | 1 | 0 | 62.9 | 40.1 | 0 |
| ‘Complexity’94,96 | 0 | 0 | 0 | 18.8 | 25.5 | 0 |
| Enthalpy of formation (kJ mol−1)95 | −537.6 | −132.5 | −240.1 | −207.4 | −486.0 | −167.2 |
| Gibbs free energy of formation (kJ mol−1)95 | −560.8 | −79.3 | −261.9 | −111.3 | −369.3 | −131.2 |
| Standard entropy (J mol−1 K−1)95 | 9.6 | 113.4 | 59.0 | 146.4 | 86.6 | 56.5 |
The aqueous ionic radii87 are calculated as the average distance between the ion and its nearest water molecules, obtained from diffraction experiments and simulations. Topological polar surface area94 is defined as the surface sum over all polar atoms in a molecule. The rating for ‘complexity’ is computed using the Bertz/Hendrickson/Ihlenfeldt formula,96 and provides a rough estimate in terms of the displayed structural features, including symmetry, and the elements contained. Similar formulations, incorporating volume, bulkiness and surface area parameters have been implemented since for calculating thermodynamic properties of 1:1 aqueous salt solutions.97
Also incorporated in Table 4 are values for enthalpy of formation, Gibbs energy of formation and standard entropy of the aqueous ions.95 Data refer to ‘standard state’, i.e. the hypothetical ideal solution with molality M = 1 mol kg−1 (mean ionic molality, in the case of a species assumed to dissociate at infinite dilution), at 25 °C and 1 atm. For the case of both barium and acetate ions, breaking of water–ion interactions appears energetically unfavourable. For nitrate, the correlation of polar surface area and entropy suggests polarizability as another strong influencing mechanism on water ordering and interaction strength, in polar solutes. Similar influences have been proposed to explain a weaker influence of cations compared to anions on water-ordering, due to the larger positive electrostatic potential ‘visible’ to anions at the water molecule surface.98
The direct effect of ions on water structure, as observed from the RDFs, appears spatially limited to a radial zone of 8 Å from the ion–water interface. If so, a question arises as to whether bulk transport properties observed at macroscopic scale are simply a multiplication, across orders of magnitude, of molecular-scale phenomena, or if cumulative indirect effects emerge which may also be part of the picture. To this end, approximating the proportion of total water of the system ‘engaged’ in the first hydration shell of ions, and perhaps considering the resulting network through which remaining ‘un-bound’ waters flow, may be helpful. Using the coordination numbers of Table 4, it can be estimated that, in aqueous solutions of 1 molar concentration, ∼20% of total water molecules are ‘engaged’ with sodium chloride in first hydration shells; this value increases to ∼72% of total water molecules for barium acetate (details in Table S6, ESI†). These estimates suggest that the salt-specific effects on macroscopic dynamics observed in Fig. 2 and 3, for the most part, might arise cumulatively from the direct effect of the ions on their hydration shells. In this way, ions with hydration shells containing more water molecules could exert stronger influence on bulk dynamics (whether accelerating or decelerating), depending on charge distribution and ion–water interaction strengths.
Conclusions
Bulk dynamics for the aqueous solutions of four 1:1 and 2:1 salt types have been investigated utilising experiments and classical molecular dynamics (MD) simulations. Results for aqueous sodium chloride are in good agreement with published data. New data are reported for viscosity and water self-diffusion coefficients for aqueous solutions of ammonium acetate,99 barium nitrate100 and barium acetate101 salts, for which scarce data were available in the open literature.
Our results show that atomistic MD simulations, with the force-field combinations applied here, are able to predict results for the properties of interest which, when normalized, closely agree with experimental trends.
The availability of macroscopic experimental data, together with atomistic details from MD simulations, facilitates a discussion of the results that addresses the synergy of various ion attributes, analysed above in the context of published data to achieve a ‘holistic’ interpretation. Influencing mechanisms, when considering salt-specific effects and macroscopic transport properties of the aqueous solutions, are found to be ion size and charge density (for monoatomic ions), but also size and number of component atoms (for multi-atomic ions), their spatial arrangement, polarizability and radial accessibility (i.e., ‘visibility’ of component atoms to surrounding water molecules at the interface). All these factors are found to be interlinked with interaction strength and energetics. In yielding the energetically strong interactions that characterize the ‘strongest salts’ of the present work (in terms of slowing water dynamics), polar surface area, charge density and charge distribution complexity emerged as significant ion attributes.
The findings presented could be useful in interpreting experimental results for other aqueous salt solutions and for formulating aqueous systems within the development of many industrial applications, including the production of catalytic converters.
Conflicts of interest
There are no conflicts to declare.Acknowledgements
This project was supported financially by Johnson Matthey and, in part, by the UCL Department of Chemical Engineering. We are grateful to Dr Andy York at Johnson Matthey Technology Centre (Sonning Common), for guidance with the experimental setup of PFGSE-NMR water self-diffusion measurements, and to Dr Misbah Sarwar, for comments on this manuscript. Within the UCL Chemical Engineering Department, we owe special thanks to Prof. Panagiota Angeli for accommodating time on the rheometer, and to Dr Simona Migliozzi, for her guidance with viscosity measurements. Computational time and resources were provided by University College London Research Computing Platforms Support (Myriad cluster). We thank Dr Anh T. V. Phan for her support in the set-up of MD simulations. We are also grateful to Prof. Pierandrea Lo Nostro and Dr Robin Curtis, for discussions on salt-specific effects within the Hofmeister framework.References
- G. C. Sosso, T. Li, D. Donadio, G. A. Tribello and A. Michaelides, Microscopic Mechanism and Kinetics of Ice Formation at Complex Interfaces: Zooming in on Kaolinite, J. Phys. Chem. Lett., 2016, 7(13), 2350–2355 CrossRef CAS PubMed.
- M. Fitzner, G. C. Sosso, S. J. Cox and A. Michaelides, Ice is born in low-mobility regions of supercooled liquid water, Proc. Natl. Acad. Sci. U. S. A., 2019, 116(6), 2009–2014 CrossRef CAS PubMed.
- S. Chatterjee, P. G. Debenedetti, F. H. Stillinger and R. M. Lynden-Bell, A computational investigation of thermodynamics, structure, dynamics and solvation behavior in modified water models, J. Chem. Phys., 2008, 128, 124511 CrossRef PubMed.
- Z. Yan, S. V. Buldyrev, P. Kumar, N. Giovambattista, P. G. Debenedetti and H. E. Stanley, Structure of the first- and second-neighbor shells of simulated water: Quantitative relation to translational and orientational order, Phys. Rev. E: Stat., Nonlinear, Soft Matter Phys., 2007, 76, 051201 CrossRef PubMed.
- J. D. Durrant and J. A. McCammon, Molecular dynamics simulations and drug discovery, BMC Biol., 2011, 9, 71 CrossRef CAS PubMed.
- W. Kunz, J. Henle and B. W. Ninham, Zur Lehre von der Wirkung der Salze’ (about the science of the effect of salts): Franz Hofmeister's historical papers, Curr. Opin. Colloid Interface Sci., 2004, 9(1–2), 19–37, DOI:10.1016/j.cocis.2004.05.005.
- D. Roberts, J. Warwicker and R. Curtis, Chapter 7: Molecular Modeling for Protein Aggregation and Formulation, in Computational Pharmaceutics: Application of Molecular Modeling in Drug Delivery, ed. D. Ouyang and S. C. Smith, John Wiley & Sons, Ltd., 2015, Section 7.3.1, p. 129. Available at: https://onlinelibrary.wiley.com/doi/pdf/10.1002/9781118573983 Search PubMed.
- B. Hribar, N. T. Southall, V. Vlachy and K. A. Dill, How ions affect the structure of water, J. Am. Chem. Soc., 2002, 124, 12302–12311 CrossRef CAS PubMed.
- G. A. Krestov, Thermodynamics of solvation, Ellis Horwood, New York, 1990 Search PubMed.
- O. Y. Samoilov, A new approach to the study of hydration of ions in aqueous solutions, Discuss. Faraday Soc., 1957, 24, 141–146 RSC.
- O. Y. Samoilov, in Water and Aqueous Solution: Structure, Thermodynamics and Transport Processes, ed. R. A. Horne, Wiley-Interscience, New York, 1972, pp. 597–612 Search PubMed.
- A. W. Omta, M. F. Kropman, S. Woutersen and H. J. Bakker, Negligible Effect of Ions on the Hydrogen-Bond Structure in Liquid Water, Science, 2003, 301, 347–349 CrossRef CAS PubMed.
- J. D. Batchelor, A. Olteanu, A. Tripathy and G. J. Pielak, Impact of Protein Denaturants and Stabilizers on Water Structure, J. Am. Chem. Soc., 2004, 126, 1958–1961 CrossRef CAS PubMed.
- Y. Marcus, Effect of Ions on the Structure of Water: Structure Making and Breaking, Chem. Rev., 2009, 109, 1346–1370 CrossRef CAS PubMed.
- Y. Marcus, Effect of Ions on the Structure of Water, Pure Appl. Chem., 2010, 82, 1889–1899 CAS.
- P. Ball and J. E. Hallsworth, Water Structure and Chaotropicity: Their Uses, Abuses and Biological Implications, Phys. Chem. Chem. Phys., 2015, 17, 8297–8305 RSC.
- M. T. Record, E. Guinn, L. Pegram and M. Capp, Faraday Discussion 160 Introductory Lecture: Interpreting and Predicting Hofmeister Salt Ion and Solute Effects on Biopolymer and Model Processes Using the Solute Partitioning Model, Faraday Discuss., 2013, 160, 9–44 RSC.
- M. Andreev, J. J. de Pablo, A. Chremos and J. F. Douglas, Influence of Ion Solvation on the Properties of Electrolyte Solutions, J. Phys. Chem. B, 2018, 122(14), 4029–4034 CrossRef CAS PubMed.
- A. Salis and B. W. Ninham, Models and mechanisms of Hofmeister effects in electrolyte solutions, and colloid and protein systems revisited, Chem. Soc. Rev., 2014, 43, 7358–7377, 10.1039/C4CS00144C.
- K. D. Collins, Charge density-dependent strength of hydration and biological structure, Biophys. J., 1997, 72(1), 65–76, DOI:10.1016/S0006-3495(97)78647-8.
- K. D. Collins, Ions from the Hofmeister series and osmolytes: effects on proteins in solution and in the crystallization process, Methods, 2004, 34(3), 300–311, DOI:10.1016/j.ymeth.2004.03.021.
- L. A. Moreira, M. Boström, B. W. Ninham, E. C. Biscaia and F. W. Tavares, Hofmeister effects: Why protein charge, pH titration and protein precipitation depend on the choice of background salt solution, Colloids Surf., A, 2006, 282–283, 457–463, DOI:10.1016/j.colsurfa.2005.11.021.
- M. Boström, F. W. Tavares, S. Finet, F. Skouri-Panet, A. Tardieu and B. W. Ninham, Why forces between proteins follow different Hofmeister series for pH above and below pI, Biophys. Chem., 2005, 117(3), 217–224 CrossRef PubMed.
- CrystalMaker webpage: ‘Elements, Atomic Radii and the Periodic Table’, and refs therein. URL: http://crystalmaker.com/support/tutorials/atomic-radii/index.html [Accessed: 3rd May 2020].
- CrystalMaker Element Tables: ‘CPK Atomic-Ionic Radii’, and refs therein. http://crystalmaker.com/support/tutorials/atomic-radii/resources/CPK_Atomic_Ionic_Radii.jpg.
- J. C. Slater, Atomic Radii in Crystals, J. Chem. Phys., 1964, 41(10), 3199–3204, DOI:10.1063/1.1725697.
- S. Yue and A. Z. Panagiotopoulos, Dynamic properties of aqueous electrolyte solutions from non-polarisable, polarisable, and scaled-charge models, Mol. Phys., 2019, 1–12 CAS.
- A. L. Benavides and M. A. Portillo, et al., A potential model for sodium chloride solutions based on the TIP4P/2005 water model, J. Chem. Phys., 2017, 147, 104501 CrossRef CAS.
- R. Fuentes-Azcatl and M. C. Barbosa, Sodium chloride, NaCl/ε: New Force Field, J. Phys. Chem. B, 2016, 120, 2460–2470 CrossRef CAS.
- A. P. Lyubartsev and A. Laaksonen, Concentration effects in aqueous NaCl solutions. A Molecular Dynamics Simulation, J. Phys. Chem., 1996, 100(40), 16410–16418 CrossRef CAS.
- S.-B. Zhu and G. W. Robinson, Molecular-dynamics computer simulation of an aqueous NaCl solution: structure, J. Chem. Phys., 1992, 97, 4336 CrossRef CAS.
- M. Patra and M. Karttunen, Systematic comparison of force fields for microscopic simulations of NaCl in aqueous solutions: Diffusion, free energy of hydration, and structural properties, J. Comput. Chem., 2004, 25, 678–689 CrossRef CAS PubMed.
- H. Uchida and M. Matsuoka, Molecular dynamics simulation of solution structure and dynamics of aqueous sodium chloride solutions from dilute to supersaturated concentration, Fluid Phase Equilib., 2004, 219(1), 49–54 CrossRef CAS.
- J. P. Brodholt, Molecular dynamics simulations of aqueous NaCl solutions at high pressures and temperatures, Chem. Geol., 1998, 151(1–4), 11–19 CrossRef CAS.
- H. Ozbek, J. A. Fair and S. L. Phillips, Viscosity of aqueous sodium chloride solutions from 0–150 °C, Lawrence Berkeley National Laboratory, 1977. https://escholarship.org/uc/item/3jp6n2bf#main [Accessed: 25th February 2021] Search PubMed.
- S. L. Phillips, H. Ozbek, et al., Viscosity of NaCl and other solutions up to 350 °C and 50 MPa pressures, Lawrence Berkeley National Laboratory, 1980. https://www.osti.gov/servlets/purl/6731414/ [Accessed: 25th February 2021] Search PubMed.
- J. Kestin, H. E. Khalifa and R. J. Correia, Tables of the dynamic and kinematic viscosity of aqueous NaCl solutions in the temperature range 20-150 °C and the pressure range 0.1-35 MPa, J. Phys. Chem. Ref. Data, 1981, 10(1), 71–87 CrossRef CAS.
- L. Konermann, Addressing a common misconception: ammonium acetate as neutral pH ‘buffer’ for native electrospray mass spectroscopy, J. Am. Soc. Mass Spectrom., 2017, 28, 1827–1835 CrossRef CAS PubMed.
- Silver Fern Chemical Inc. Product description page: Ammonium Acetate Buffer (CAS No: 631-61-8). URL: http://www.silverfernchemical.com/products/ammonium-acetate-buffer/ [Accessed: 3rd May 2020].
- R. M. Heck, R. J. Farrauto and S. T. Gulati, Catalytic Air Pollution Control: commercial technology, John Wiley & Sons, Inc., 3rd edn, 2009 Search PubMed.
- S. Plimpton, Fast Parallel Algorithms for Short-Range Molecular Dynamics, J. Comput. Phys., 1995, 117, 1–19 CrossRef CAS.
- W. C. Swope, H. C. Andersen, P. H. Berens and K. R. Wilson, A computer simulation method for the calculation of equilibrium constants for the formation of physical clusters of molecules: Application to small water clusters, J. Chem. Phys., 1982, 76, 637–649 CrossRef CAS.
- S. Nosé, A molecular dynamics method for simulations in the canonical ensemble, Mol. Phys., 1984, 52(2), 255–268 CrossRef.
- W. G. Hoover, Canonical dynamics: equilibrium phase-space distributions, Phys. Rev. A: At., Mol., Opt. Phys., 1985, 31(3), 1695–1697 CrossRef PubMed.
- R. W. Hockney and J. W. Eastwood, Chapter 8: Particle-Particle-Particle-Mesh (P3M) Algorithms, Computer simulation using particles, CRC Press, 1988, pp. 267–304, ISBN: 9780852743928 Search PubMed.
- H. J. C. Berendsen, J. R. Grigera and T. P. Straatsma, The missing term in effective pair potentials, J. Phys. Chem., 1987, 91(24), 6269–6271 CrossRef CAS.
- J. L. F. Abascal and C. Vega, A general purpose model for the condensed phases of water: TIP4P/2005, J. Chem. Phys., 2005, 123, 234505 CrossRef CAS.
- J. P. Ryckaert, G. Ciccotti and H. J. C. Berendsen, Numerical integration of the Cartesian equations of motion of a system with constraints: molecular dynamics of n-Alkanes, J. Comput. Phys., 1977, 23, 327–341 CrossRef CAS.
- I. S. Joung and T. E. Cheatham, Determination of alkali and halide monovalent ion parameters for use in explicitly solvated biomolecular simulations, J. Phys. Chem. B, 2008, 112(30), 9020–9041 CrossRef CAS PubMed.
- H. Krienke and D. Opalka, Hydration of molecular ions: a molecular dynamics study with a SPC/E water model, J. Phys. Chem. C, 2007, 111(43), 15935–15941 CrossRef CAS.
- S. Mamatkulov, M. Fyta and R. R. Netz, Force fields for divalent cations based on single-ion and ion-pair properties, J. Chem. Phys., 2013, 138, 024505 CrossRef PubMed.
- S. Kashefolgheta and A. V. Verde, Developing force fields when experimental data is sparse: AMBER/GAFF-compatible parameters for inorganic and alkyl oxoanions, Phys. Chem. Chem. Phys., 2017, 19(31), 20593–20607 RSC.
- W. D. Cornell, P. Cieplak, C. I. Bayly, I. R. Gould, K. M. Merz and D. M. Ferguson, et al. , J. Am. Chem. Soc., 1995, 117(19), 5179–5197 CrossRef CAS.
- J. Wang, R. M. Wolf, J. W. Caldwell, P. A. Kollman and D. A. Case, J. Comput. Chem., 2004, 25(9), 1157–1174 CrossRef CAS PubMed.
- J. Wang, P. Cieplak and P. A. Kollman, J. Comput. Chem., 2000, 21(12), 1049–1074 CrossRef CAS.
- W. L. Jorgensen and J. Tirado-Rives, J. Am. Chem. Soc., 1988, 110(6), 1657–1666 CrossRef CAS PubMed.
- D. J. Evans and G. P. Morriss, Nonlinear-response theory for steady planar Couette flow, Phys. Rev. A: At., Mol., Opt. Phys., 1984, 30(3), 1528–1530 CrossRef CAS.
- P. J. Daivis and B. D. Todd, A simple, direct derivation and proof of the validity of the SLLOD equations of motion for generalized homogeneous flows, J. Chem. Phys., 2006, 124, 194103 CrossRef PubMed.
- B. Hess, Determining the shear viscosity of model liquids from molecular dynamics simulations, J. Chem. Phys., 2002, 116(1), 209–217 CrossRef CAS.
- A. Einstein, Über die von der molekularkinetischen Theorie der Wärme geforderte Bewegung von in ruhenden Flüssigkeiten suspendierten Teilchen, Ann. Phys., 1905, 17, 549–560 CrossRef CAS . Available at: https://einstein-annalen.mpiwg-berlin.mpg.de/annalen/chronological/1905 (German), http://www.maths.usyd.edu.au/u/UG/SM/MATH3075/r/Einstein_1905.pdf (English; Dover Publications Inc., 1956). [Accessed: 4th May 2020].
- E. Frey and K. Kroy, Brownian motion: a paradigm of soft matter and biological physics, Ann. Phys., 2005, 14(1–3), 20–50, DOI:10.1002/andp.200410132.
- G. Åkerlöf, A Study of the Composition of the Liquid Phase in Aqueous Systems containing Strong Electrolytes of Higher Valence Types as Solid Phases, J. Phys. Chem., 1937, 41(8), 1053–1076 CrossRef.
- M. Aghaie, H. Aghaie and A. Ebrahimi, Thermodynamics of the solubility of barium nitrate in the mixed solvent, ethanol + water, and the related ion-association, J. Mol. Liq., 2007, 135(1–3), 72–74 CrossRef CAS.
- R. Wright, Selective Solvent Action. Part VI. The Effect of Temperature on the Solubilities of Semi-solutes in Aqueous Alcohol, J. Chem. Soc., 1927, 1334–1337 RSC.
- E. L. Hahn, Spin Echoes, Phys. Rev., 1950, 80(4), 580–594 CrossRef.
- E. O. Stejskal and J. E. Tanner, Spin diffusion measurements: spin echoes in the presence of a time dependent field gradient, J. Chem. Phys., 1965, 42, 288–292 CrossRef CAS.
- M. Holz, S. R. Heil and A. Sacco, Temperature-dependent self-diffusion coefficients of water and six selected molecular liquids for calibration in accurate 1H NMRPFG measurements, Phys. Chem. Chem. Phys., 2000, 2(20), 4740–4742 RSC.
- I. C. Yeh and G. J. Hummer, System-Size Dependence of Diffusion Coefficients and Viscosities from Molecular Dynamics Simulations with Periodic Boundary Conditions, J. Phys. Chem. B, 2004, 108(40), 15873–15879 CrossRef CAS.
- J. S. Kim, Z. Wu, A. R. Morrow, A. Yethiraj and A. Yethiraj, Self-Diffusion and Viscosity in Electrolyte Solutions, J. Phys. Chem. B, 2012, 116(39), 12007–12013 CrossRef CAS PubMed.
- M. Afzal, M. Saleem and M. T. Mahmood, Temperature and Concentration Dependence of Viscosity of Aqueous Electrolytes from 20 to 50 °C. Chlorides of Na+, K+, Mg2+, Ca2+, Ba2+, Sr2+, Co2+, Ni2+, Cu2+, and Cr3+, J. Chem. Eng. Data, 1989, 34, 339–346 CrossRef CAS.
- H.-L. Zhang and S. J. Han, Viscosity and Density of Water + Sodium Chloride + Potassium Chloride Solutions at 298.15K, J. Chem. Eng. Data, 1996, 41(3), 516–520 CrossRef.
- A. A. Aleksandrov, E. V. Dzhuraeva and V. F. Utenkov, Viscosity of aqueous solutions of sodium chloride, High Temp., 2012, 50, 354–358 CrossRef CAS.
- J. Kestin, H. E. Khalifa and R. J. Correia, Tables of the dynamic and kinematic viscosity of aqueous NaCl solutions in the temperature range 20–150 °C and the pressure range 0.1–35 MPa, J. Phys. Chem. Ref. Data, 1981, 10(1), 71 CrossRef CAS . NIST weblink: https://srd.nist.gov/JPCRD/jpcrd176.pdf.
- R. Fuentes-Azcatl and M. C. Barbosa, Sodium Chloride, NaCl/ε: New Force Field, J. Phys. Chem. B, 2016, 120(9), 2460–2470 CrossRef CAS PubMed.
- D. W. McCall and D. C. Douglass, The effect of ions on the self-diffusion of water. I. Concentration dependence, J. Phys. Chem., 1965, 69(6), 2001–2011 CrossRef CAS.
- E. C. Meng and P. A. Kollman, Molecular Dynamics Studies of the Properties of Water around Simple Organic Solutes, J. Phys. Chem., 1996, 100(27), 11460–11470 CrossRef CAS.
- W. L. Jorgensen and J. Gao, Monte Carlo Simulations of the Hydration of Ammonium and Carboxylate Ions, J. Phys. Chem., 1986, 90(10), 2174–2182 CrossRef CAS.
- M. Ekimova, W. Quevedo, L. Szyc and M. Iannuzzi, et al., Aqueous Solvation of Ammonia and Ammonium: Probing Hydrogen Bond Motifs with FT-IR and Soft X-ray Spectroscopy, J. Am. Chem. Soc., 2017, 139(36), 12773–12783 CrossRef CAS PubMed.
- S. Joung, T. Luchko and D. A. Case, Simple electrolyte solutions: Comparison of DRISM and molecular dynamics results for alkali halide solutions, J. Chem. Phys., 2013, 138(4), 044103 CrossRef PubMed.
- P. Banerjee, S. Yashonath and B. Bagchi, Coupled jump rotational dynamics in aqueous nitrate solutions, J. Chem. Phys., 2016, 145(23), 234502 CrossRef PubMed.
- R. Caminiti, G. Licheri, G. Piccaluga and G. Pinna, On NO−3–H2O interactions in aqueous solutions, J. Chem. Phys., 1978, 68(4), 1967–1970 CrossRef CAS.
- A. L. Thompson, D. Parker, D. A. Fulton and J. A. K. Howard, et al., On the role of the counter-ion in defining water structure and dynamics: order, structure and dynamics in hydrophilic and hydrophobic gadolinium salt complexes, Dalton Trans., 2006, 5605–5616 RSC.
- P. Naert, K. Rabaey and C. V. Stevens, Ionic liquid ion exchange: exclusion from strong interactions condemns cations to the most weakly interacting anions and dictates reaction equilibrium, Green Chem., 2018, 20, 4277–4286 RSC.
- H. Luo, S. Dai, P. V. Bonnesen, T. J. Haverlock, B. A. Moyer and A. C. Buchanan III, A Striking Effect of Ionic-Liquid Anions in the Extraction of Sr2+ and Cs+ by Dicyclohexano-18-Crown-6, Solvent Extr. Ion Exch., 2006, 24(1), 19–31 CrossRef CAS.
- S. Sankarasubramanian, J. Kahky and V. Ramani, Tuning anion solvation energetics enhances potassium-oxygen battery performance, Proc. Natl. Acad. Sci. U. S. A., 2019, 116(30), 14899–14904 CrossRef CAS PubMed.
- P. Banerjee and B. Bagchi, Rotational dynamics of polyatomic ions in aqueous solutions: from continuum model to mode-coupling theory, aided by computer simulations, J. Chem. Phys., 2018, 148, 224504 CrossRef PubMed.
- Y. Marcus, Thermodynamics of solvation of ions. Part 5. Gibbs free energy of hydration at 298.15K, J. Chem. Soc., Faraday Trans., 1991, 87(18), 2995–2999 RSC.
- M. I. Chaudhari, M. Soniat and S. B. Rempe, Octa-coordination and the aqueous Ba2+ ion, J. Phys. Chem. B, 2015, 119(28), 8746–8753 CrossRef CAS PubMed.
- F. Aydin, C. Zhan, C. Ritt, R. Epsztein, M. Elimelech, E. Schwegler and T. A. Pham, Similarities and differences between potassium and ammonium ions in liquid water: a first principles study, Phys. Chem. Chem. Phys., 2020, 22, 2540–2548 RSC.
- S. Varma and S. B. Rempe, Coordination numbers of alkali metal ions in aqueous solutions, Biophys. Chem., 2006, 124, 192–199 CrossRef CAS PubMed.
- A. Tongraar, P. Tangkawanwanit and B. M. Rode, A combined QM/MM molecular dynamics simulations study of nitrate anion (NO3−) in aqueous solution, J. Phys. Chem. A, 2006, 110, 12918–12926 CrossRef CAS PubMed.
- M. V. Fedotova and S. E. Kruchinin, Hydration of acetic acid and acetate ion in water studied by 1D-RISM theory, J. Mol. Liq., 2011, 164, 201–206 CrossRef CAS.
- R. Mancinelli, A. Botti, F. Bruni, M. A. Ricci and A. K. Soper, Hydration of sodium, potassium and chloride ions in solution and the concept of structure maker/breaker, J. Phys. Chem. B, 2007, 111(48), 13570–13577 CrossRef CAS PubMed.
- PubChem (https://pubchem.ncbi.nlm.nih.gov/): compound summary webpages for ‘barium’, ‘ammonium’, ‘sodium’, ‘nitrate’, ‘acetate’ and ‘chloride’ - Section 3.1, Computed Properties, [Accessed: 9th July 2020].
- W. M. Haynes, D. R. Lide and T. J. Bruno, CRC Handbook of Chemistry and Physics, Section 5-66: Thermodynamic properties of aqueous ions, CRC Press, 95th edn, 2014–2015 Search PubMed.
- J. B. Hendrickson, P. Huang and A. G. Toczko, Molecular Complexity – A Simplified Formula Adapted to Individual Atoms, J. Chem. Inf. Comput. Sci., 1987, 27, 63–67 CrossRef CAS ; W. D. Ihlenfeldt, Computergestützte Syntheseplanung durch Erkennung synthetisch nutzbarer Möglichkeit von Molekülen, PhD thesis, TU Munich, 1991.
- A. Zuber, R. F. Checoni, R. Mathew, J. P. L. Santos, F. W. Tavares and M. Castier, Thermodynamic properties of 1:1 salt aqueous solutions with the electrolattice equation of state, Oil Gas Sci. Technol., 2013, 68(2), 255–270 CrossRef CAS.
- K. D. Collins, Charge density-dependent strength of hydration and biological structure, Biophys. J., 1997, 72(1), 65–76 CrossRef CAS PubMed.
- S. D. Deosarkar and M. S. Mendkudle, Physicochemical properties and Ion-Solvent interactions in aqueous sodium, ammonium and lead acetate solution, Russ. J. Phys. Chem. A, 2014, 88(9), 1527–1532 CrossRef CAS.
- T. H. Doan and J. Sangster, Viscosities of concentrated aqueous solutions of some 1:1, 2:1 and 3:1 nitrates at 25 °C, J. Chem. Eng. Data, 1981, 26(2), 141–144 CrossRef CAS.
- J. Padova, Ion-Solvent Interaction in Mixed Solvents. II. The Viscosity of Electrolytes in Mixed Solvents, J. Chem. Phys., 1963, 38(11), 2635–2640 CrossRef CAS.
Footnote |
| † Electronic supplementary information (ESI) available. See DOI: 10.1039/d0cp05331g |
| This journal is © the Owner Societies 2021 |