Dimensional interpolation for metallic hydrogen
Kumar J. B.
Ghosh
 a,
Sabre
Kais
 b and
Dudley R.
Herschbach
 *c
*c
aDepartment of Electrical and Computer Engineering, University of Denver, Denver, CO 80210, USA. E-mail: jb.ghosh@outlook.com
bDepartment of Chemistry and Physics, Purdue University, West Lafayette, IN 47906, USA. E-mail: kais@purdue.edu
cDepartment of Chemistry and Chemical Biology, Harvard University, Cambridge, MA 02138, USA. E-mail: dherschbach@gmail.com
First published on 6th November 2020
Abstract
We employ a simple and mostly accurate dimensional interpolation formula using dimensional limits D = 1 and D = ∞ to obtain D = 3 ground-state energy of metallic hydrogen. We also present results describing the phase transitions for different symmetries of three-dimensional structure lattices. The interpolation formula not only predicts fairly accurate energies but also predicts a correct functional form of the energy as a function of the lattice parameters. That allows us to calculate different physical quantities such as the bulk modulus, Debye temperature, and critical transition temperature, from the gradient and the curvature of the energy curve as a function of the lattice parameters. These theoretical calculations suggest that metallic hydrogen is a likely candidate for high temperature superconductivity. The dimensional interpolation formula is robust and might be useful to obtain the energies of complex many-body systems.
1 Introduction
In 1935, Eugene Wigner and H.B. Huntington predicted the metallization of hydrogen,1 a phase of hydrogen that behaves like an electrical conductor. Ever since this has been a major quest for condensed matter physics. In pursuing metallic hydrogen (MH), we have admired many papers, but cite a few dealing with extreme high-pressure experiments.2–7 Moreover, MH is a candidate for phase transitions from superconductivity to superfluidity and vice versa under the influence of a magnetic field.8–10Dimensional scaling offers simple solutions for D = 1 and D → ∞ limits, then often interpolates to obtain useful results for D = 3, with accuracy adequate for many areas of chemical physics.11–21 Already, the D → ∞ limit for MH was treated in 1992 by John Loeser.22 He employed a Hartree–Fock Hamiltonian that localizes the electrons in a lattice of hydrogen atoms with clamped nuclei for rigid three-dimensional simple cubic (SC), body-centered (BCC), face-centered (FCC) cubic proton-lattices. We shall tune up the D → ∞ limit and develop the D = 1 limit for MH and interpolate to obtain D = 3. Recently, we used dimensional interpolation to apply ground-state energies for two, three, and four electron atoms and for ground-state H2 molecule over a wide range of the internuclear distance R. The results compare well with the standard exact energies obtained from the Full Configuration Interaction.23
Here we investigate the phase transition for metallic hydrogen using dimensional scaling with the three-dimensional proton lattices: SC, BCC, and FCC. Section 2 describes an interpolation formula for extended systems. Sections 3 and 4 develop a one-electron Hamiltonian for quantum theory of MH in SC, BCC, and FCC lattice with D → ∞ and D = 1 respectively. Section 5 implements the dimensional interpolation to obtain D = 3, observes MH and its phase transition. Section 6 uses extrapolation and curve fitting to obtain a functional form of the ground state energy of MH in SC, BCC, FCC lattice as a function of the lattice parameter, R, and investigate the physical properties like bulk modulus, Debye temperature, melting curve, and superconductivity. Section 7 has some prospects.
2 Dimensional interpolation formula for extended systems
For dimensional scaling of atoms and molecules the energy erupts to infinity as D → 1 and vanishes as D → ∞. Hence, we adopt scaled units (with Hartree atomic units) whereby ED = (Z/β)2εD and , so the reduced energy εD remains finite in both limits. When expressed in a 1/Z perturbation expansion, the reduced energy is given by
| εD = −1 + ε(1)Dλ + ε(2)Dλ2 + … | (1) |
The interpolation for atoms, developed in ref. 20, weights the dimensional limits by δ = 1/D, providing δε1 and (1 − δ)ε∞ in a simple analytic formula
| εD = δε1 + (1 − δ)ε∞ + [ε(1)D − δε(1)1 − (1 − δ)ε(1)∞]λ. | (2) |
For a diatomic molecule, a different scaling scheme is used and illustrated. The rescaling of distances is:
| R → δR′ for D → 1; R → (1 − δ)R′ for D → ∞. | (3) |
An approximation for D = 3 (where R = R′) emerges:
 | (4) |
We keep the structure of the formula same as above for extended systems like metallic hydrogen. We assume the cubic symmetry for the metallic hydrogen in the large D limit and a linear chain of atoms in one dimension. The rescaled distances in different dimension is given by:
In![[thin space (1/6-em)]](https://www.rsc.org/images/entities/char_2009.gif) D = 1: r → r′/3 and R → R′/3; D = 1: r → r′/3 and R → R′/3; | (5a) |
In![[thin space (1/6-em)]](https://www.rsc.org/images/entities/char_2009.gif) D → ∞: ρ → 2ρ′/3 and R → 2R′/3. D → ∞: ρ → 2ρ′/3 and R → 2R′/3. | (5b) |
The coordinates r and ρ are the electronic coordinates, and the parameter R is the spacing between the atomic nuclei (or lattice parameters) in D = 1 and D = ∞ respectively.
3 Metallic hydrogen at the large-D-limit
With appropriate scaling, energies will be in units of 4/(D − 1)2 Hartrees, and distances in units of D(D − 1)/6 Bohr radii. Loeser applied with simplifications the Hartree–Fock one-electron Hamiltonian in the D → ∞ limit in a lattice of hydrogen atoms with clamped nuclei:22 | (6) |
 | (7) |
| σ2 = l2 + m2 + n2, | (8) |
For any specified lattice type and scaled lattice constant R, the minimum of eqn (6) with respect to ρ gives the energy per electron. The whole lattice is three-dimensional, noted ![[script L]](https://www.rsc.org/images/entities/char_e144.gif) ′ minus the one site (0,0,0). The single variable ρ is the orbit radius and R is the lattice spacing. The quantity (ρ/R) is used to characterize the different density regimes.
′ minus the one site (0,0,0). The single variable ρ is the orbit radius and R is the lattice spacing. The quantity (ρ/R) is used to characterize the different density regimes.
We began with the simple cubic lattice. In Hartree–Fock approximation of MH the triple sum W(ρ,R) is a kind of Madelung sum. Loeser evaluated W(ρ,R) for the two limiting cases. For, the low-density regime (ρ ≪ R), the sums over integers are taken from the tables of Born and Misra28 and the Hamiltonian of eqn (6) becomes:
 | (9) |
For the high-density regime (ρ ≫ R), the sum can be replaced by an integral and the Hamiltonian of eqn (6) becomes:
 | (10) |
For the criticality of the metallic hydrogen, we have to find the critical density for which the above Hamiltonian (6) attends the minimum. For calculation-convenience we fix the parameter R = 1 and the lattice size to be (400 × 400 × 400). Although ideally the number lattice points should be infinitely large, but for calculation our lattice size is sufficient to observe the critical phenomenon. We calculate numerically and display in Fig. 1(a) of the above Hamiltonian for a wide range of ρ, from 0.01 to 65, i.e. the density (ρ/R) ranges from 0.01 to 65. From Fig. 1(b), we find that, for R = 1, at density ρ/R = 0.799 Hamiltonian (6) attends the minimum.
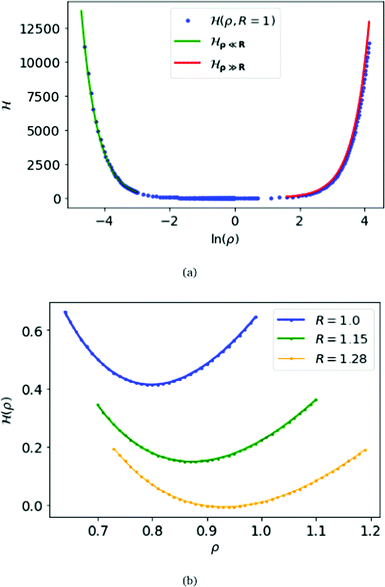 | ||
| Fig. 1 At the top panel (a), we plot the electronic energy per atom H(ρ,R), for MH in SC lattice, as a function of ln(ρ) keeping the parameter R = 1. We also plot the energy for ρ ≫ R obtained from eqn (10) in red, and the energy for ρ ≪ R obtained from eqn (9) in green. At the bottom (b), we plot the energy for each atom (ρ) as a function of ρ for R = 1.0,1.5 and 1.28 respectively. | ||
Then, we choose different values of R and calculate the minimum of the Hamiltonian  by varying the parameter ρ for each R, which gives the electronic ground state energy per atom.
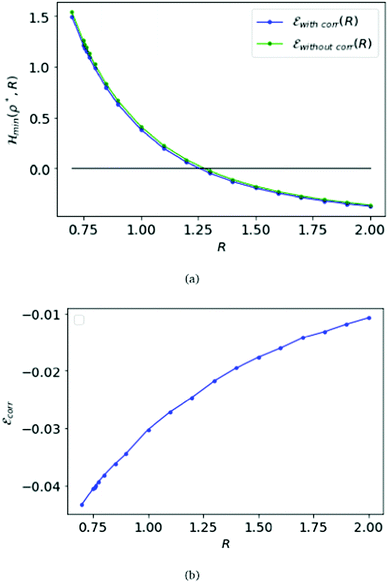
At R = 1.28, we find  at the minimum and see in Fig. 2(a), the ground state energy becomes positive to negative around R = 1.28. Physically this means for R < 1.28, the ground state energy becomes positive therefore makes the system is unstable. Therefore, at the point R = 1.28 and
  , the system goes through a phase transition. This is an elemental model at D → ∞ limit with Hartree–Fock approximation and hydrogen atoms are in a simple cubic lattice, but we observe the criticality and find a critical density for the corresponding critical phenomenon.
Remarkably, Loeser added to the Hartree–Fock approximation in the D → ∞ limit by introducing inter-electronic correlation.22 That was essentially by opening the dihedral angles in the simple cubic lattice.22 As shown in Fig. 2(a), the energy with correlation is nearly the same as without the correlation. Further, in Fig. 2(b), we plot the difference between the correlation energy and the Hartree–Fock energy.
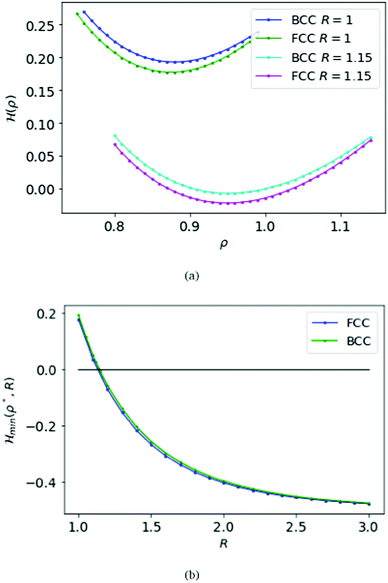
We first choose the parameter R = 1 in the electronic Hamiltonian per atom and calculate the energies with respect to the variable ρ; see Fig. 3(a). Like the SC case we find a minimum for the Hamiltonian, which is ρBCC = 0.88 = ρFCC.
Again we calculate the minimum of the Hamiltonian  for the different values of R by varying the parameter ρ, which gives the electronic ground state energy per atom. From Fig. 3(b), we see that the ground state energy becomes positive to negative around R = 1.15 for both FCC and BCC lattices. Hence, the ground state energy becomes positive so makes the lattice is unstable or the system loses the crystalline structure. Therefore, around the point RBCC = 1.15 = RFCC and the system goes through a phase transition. Since the parameters (ρ,R) at the transition point are same for BCC and FCC lattices, this could be coming from some symmetry working akin to their reciprocal spaces.
4 Metallic hydrogen in D = 1
A lonely, single hydrogen molecule in one-dimension is described by I. R. Lapidus.29,30 However, to investigate the quantum theory of MH in one dimension, we need to develop a long chain of N individual hydrogen atoms, with the nuclei sitting on the lattice sites located at r = 0,R,2R,…(N − 1)R. Hence one-electron Hamiltonian in D = 1 using atomic units can be written as: | (11) |
We choose the linear combination of atomic orbitals (LCAO) representation and construct the state for each electron in the metallic hydrogen chain in one dimension as follows:
 | (12) |
 | (13) |
| ϕi(r) = e−|r+iR|. |
 | (14) |
Unlike the nuclei, which are localized at single points, the superpositioned electron-clouds are smeared around the whole lattice. So, to calculate the inter-electronic repulsion part we consider an electron density (or a negative charge density) over an infinitesimally small line element dr at a location r which interacts with another electron density sitting over an infinitesimally small line element dr′ at a location r′. The repulsion energy for these two infinitesimally small electron clouds is given by dEee = ψ(r)ψ(r)δ(r − r′)ψ(r′)ψ(r′)drdr′. Therefore, the total electron–electron interaction part is given by:
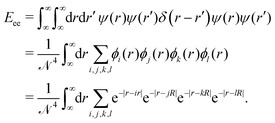 | (15) |
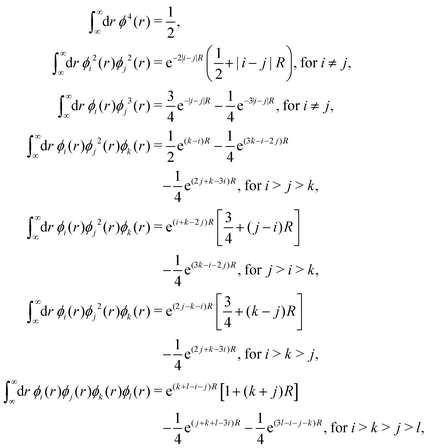
We break the above expression (15) into many smaller terms and calculate all them individually as follows:
to calculate the interaction part in eqn (15).
We set the number of lattice points equal to i,j,k,l = 100 and calculate all the above quantities numerically and obtain the final energy as a function of the inter-atomic distance R.
For FCC or BCC lattices the calculations in D = 1 is slightly different from SC lattice in one dimension. For e.g. in case of BCC lattice in D = ∞ the Hamiltonian (6), the lattice parameters l,m,n are either even or odd integers.22 We choose the same conversion for the calculation in one dimension. In one dimension the FCC and BCC lattices are the same.
For MH in D = 1 with inter-electronic correlation there is no way to define dihedral angles between electrons. Therefore, we keep the Hamiltonian same as defined in eqn (11). In Fig. 4, we plot the energy per electron as a function of the inter-atomic distance R for simple cubic and FCC/BCC lattices.
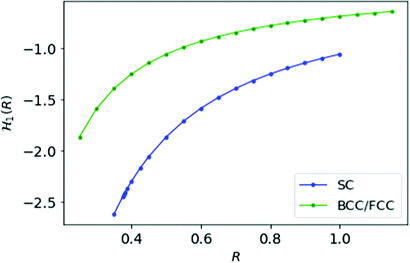 | ||
Fig. 4 We plot the energy ![[script letter H]](https://www.rsc.org/images/entities/char_e142.gif) 1(R) for MH at D = 1 as a function of R; blue curve is for SC lattice and green for FCC or BCC lattice. 1(R) for MH at D = 1 as a function of R; blue curve is for SC lattice and green for FCC or BCC lattice. | ||
5 Metallic hydrogen in D = 3 from dimensional interpolation
The dimensional interpolation formula described in Section 2 combines the D = 1 and D = ∞ limits and obtains the D = 3 reduced energy from | (16) |
In Fig. 5, we plot the electronic energies involved for the metallic hydrogen in simple cubic lattice (SC). We compare our interpolation ![[scr E, script letter E]](https://www.rsc.org/images/entities/char_e140.gif) 3(R) curve (blue) with points (red) that come from density functional theory31 (there Table III). The agreement is very good. As noted in Fig. 2, the inter-electronic correlation examined in the D → ∞ limit turns quite minor. From Fig. 5 we see that the ground state energy at D = 3 becomes positive to negative around R = 1.14. Physically this means for R < 1.14 the ground state energy becomes positive therefore makes the lattice is unstable or the system loses the crystalline structure. Therefore, at the point R = 1.14, the system goes through a phase transition.
3(R) curve (blue) with points (red) that come from density functional theory31 (there Table III). The agreement is very good. As noted in Fig. 2, the inter-electronic correlation examined in the D → ∞ limit turns quite minor. From Fig. 5 we see that the ground state energy at D = 3 becomes positive to negative around R = 1.14. Physically this means for R < 1.14 the ground state energy becomes positive therefore makes the lattice is unstable or the system loses the crystalline structure. Therefore, at the point R = 1.14, the system goes through a phase transition.
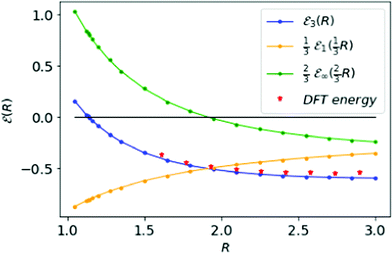 | ||
Fig. 5 The orange and green curves describe the results from D = 1 and D → ∞ respectively. The blue curve energy ![[scr E, script letter E]](https://www.rsc.org/images/entities/char_e140.gif) 3(R) represented the interpolation result at D = 3 for MH, in the SC lattice. The red points represent the results obtained from density functional theory in ref. 31. The black line shows the zero-energy line, where the blue curve goes through on R = 1.14 at a phase transition. 3(R) represented the interpolation result at D = 3 for MH, in the SC lattice. The red points represent the results obtained from density functional theory in ref. 31. The black line shows the zero-energy line, where the blue curve goes through on R = 1.14 at a phase transition. | ||
Fig. 6 displays the MH energies from the BCC and FCC lattices, similar to the SC lattice in Fig. 5, interpolating to D = 3 from eqn (16). The corresponding transition point for BCC and FCC lattice, where the ground state energy changes sign, is given by RFCC = 1.21 = RBCC.
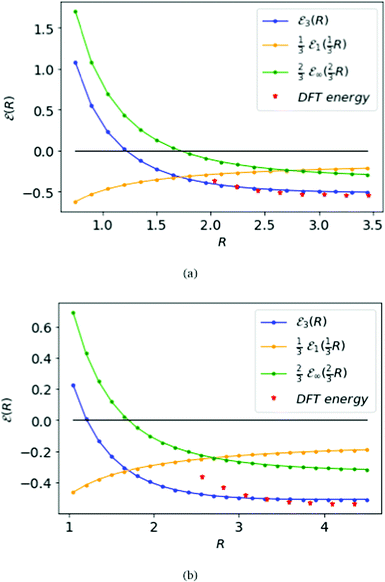 | ||
| Fig. 6 The top panel (a) is for the BCC lattice, the bottom panel (b) for the FCC lattice. Compare results in Fig. 5 for the SC lattice. Both of the blue curves meet the black line at zero-energy on R = 1.14 at the same phase transition for all three lattices. | ||
6 Physical properties of metallic hydrogen
The scaled lattice constant R is related to rs, the standard solid state parameter defined as the radius of a sphere (in a0 Bohr units) in which contains on average one electron. For the SC lattice, | (17) |
Thus, rs = 0.71 corresponds to the transition point R = 1.14, for the D → ∞ limit. Many studies for D = 3 have obtained rs = 0.8 for the existence of crystalline phase of metallic hydrogen.32 However, we have simply used R when the interpolation formula provides appropriate energies of metallic hydrogen for different lattice symmetries and parameters.
In this section, we are allowed to calculate different physical quantities such as the bulk modulus, Debye temperature, and critical transition temperature, from the gradient and the curvature of the energy curve as a function of the lattice parameters. Thus, the numerical results of the interpolation formula can be fitted to the following functional form as a function of the lattice parameter R,33,34 driven in a following table and Fig. 7.
 | (18) |
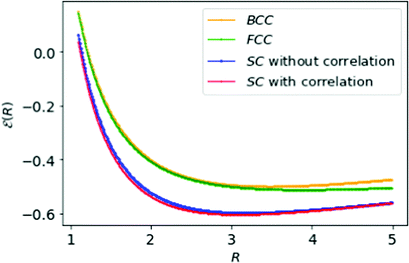 | ||
| Fig. 7 The simple formula, eqn (18), fits neatly the energies of MH in Table 1: SC with HF (in blue) and with correlation (in red); BCC (in orange), and FCC (in green) lattice structures respectively. | ||
![[scr E, script letter E]](https://www.rsc.org/images/entities/char_e140.gif) (R) in different lattice structures
(R) in different lattice structures
We also calculate the ![[scr E, script letter E]](https://www.rsc.org/images/entities/char_e140.gif) min and Rmin from eqn (18) and in Table 2 compare them for the lattice structures:
min and Rmin from eqn (18) and in Table 2 compare them for the lattice structures:
![[scr E, script letter E]](https://www.rsc.org/images/entities/char_e140.gif) min and Rmim in different lattice structures
min and Rmim in different lattice structures
| Lattice structure | R mim | ![[scr E, script letter E]](https://www.rsc.org/images/entities/char_e140.gif) min min |
|---|---|---|
| SC in HF limit | 3.18 | −0.597 |
| SC with correlation | 3.09 | −0.603 |
| BCC | 3.48 | −0.499 |
| FCC | 3.88 | −0.512 |
The minimum energies of the MH lattices are evident in Fig. 7 and the energy differences are ΔFCC–SC = 0.091, ΔBCC–SC = 0.104, ΔFCC–BCC = 0.013 respectively. The energy differences between FCC and BCC are very modest compared to SC. That may lead to possibility for a phase transition from BCC to FCC structure or vice versa.
Now we examine briefly consequential properties that involve from the interpolated formula (eqn (16)) for MH energy. First is pressure:
 | (19) |
![[scr E, script letter E]](https://www.rsc.org/images/entities/char_e140.gif) =
= ![[scr E, script letter E]](https://www.rsc.org/images/entities/char_e140.gif) min, the pressure changes sign; the corresponding rs = 1.9. This transition has a physical significance. Although at high densities the crystalline phase is preferred for metallic hydrogen, however at low densities (rs > 1.6) the metallic hydrogen behaves like a fluid or liquid metal.32,35,36 This particular point R = 3.18 and
min, the pressure changes sign; the corresponding rs = 1.9. This transition has a physical significance. Although at high densities the crystalline phase is preferred for metallic hydrogen, however at low densities (rs > 1.6) the metallic hydrogen behaves like a fluid or liquid metal.32,35,36 This particular point R = 3.18 and ![[scr E, script letter E]](https://www.rsc.org/images/entities/char_e140.gif) = −0.597 possibly signifies that crystalline-fluid transition point for MH in simple cubic lattice (Fig. 8).
= −0.597 possibly signifies that crystalline-fluid transition point for MH in simple cubic lattice (Fig. 8).
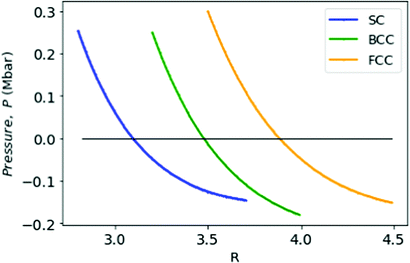 | ||
| Fig. 8 We plot the pressure P in Mbar for MH in SC (in blue), BCC (in green), and FCC (in orange) lattices as a function of R. | ||
From the curvature of the energy curves in Fig. 7, we can calculate the elastic modulus of MH for different structures as the bulk modulus B of a cubic metallic lattice is given by
 | (20) |
 | (21) |
 | (22) |
Fig. 9 displays Debye temperature Θ (top) and melting temperature Tm (bottom) as functions of pressure for MH lattices, SC, BCC, and FCC. As well known, MH will climb to a very high Debye temperature, and could become a quantum liquid. Melting curves of metallic hydrogen as a function of pressure via the Lindemann melting law.40,41 Some samples: for SC lattice at R = 3.1, Θ = 57 K, and at R = 1.12 obtains Θ = 1779 K at P = 118 Mbar. For BCC lattice at R = 3.48, Θ = 52 K, and at R = 1.21 obtains Θ = 1627 K at P = 147 Mbar. For FCC lattice at R = 3.88, Θ = 41 K, whereas at R = 1.21 obtains Θ = 2114 K at P = 294 Mbar.
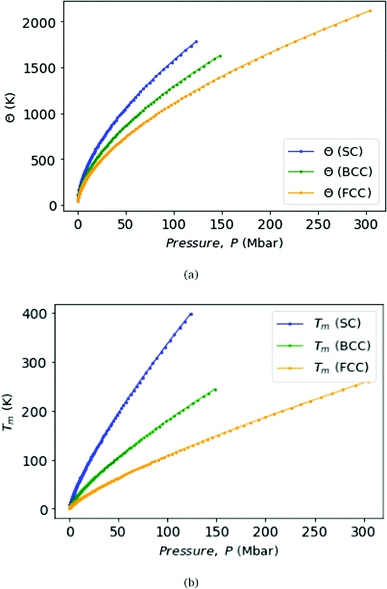 | ||
| Fig. 9 We plot the Debye temperatures Θ (top panel) and melting points Tm (bottom panel) of MH in SC, BCC, and FCC lattice structure with the correlation with respect to the pressure, P. | ||
Finally, as many authors predicted that metallic hydrogen is a superconductor below some critical temperature and others even argued that it might be a superconductor up to a room temperature.42,43 Following Koblischka, et al.,44 we have used our MH energy curves via interpolation from eqn (16) and formulate the transition temperature Tc for a MH superconductor:
 | (23) |
Here again h is the Planck constant; k is the Boltzmann constant; x is the atomic distance. A correction factor n is usually taken to be 1 for metals, and ML is taken to be equal to the mass of a proton mp.
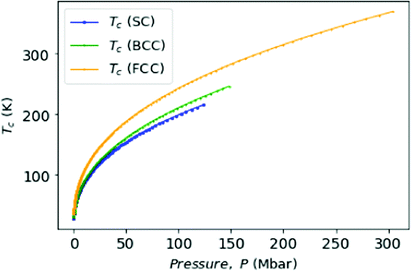
In Fig. 10, we plot the possible values of transition temperature Tc calculated from eqn (23) as a function of pressure for MH in SC, BCC, and FCC lattices, within a range where the energy is negative and pressure is positive. For the atomic distances, x = R for SC;  for BCC;
  for FCC. Samples: For SC lattice at R = 3.1, Tc = 28 K whereas for R = 1.12, Tc = 215 K and P = 118 Mbar. For BCC lattice at R = 3.48, Tc = 30 K whereas at R = 1.21, Tc = 246 K, and P = 147 Mbar. For FCC lattice at R = 3.88, Tc = 36 K whereas for R = 1.21, Tc = 369 K and P = 294 Mbar.
Although the experimental verification of superconductivity in MH is yet to be confirmed, but from the above theoretical calculations we see that the metallic hydrogen is a very good candidate for a high temperature superconductor.
7 Conclusion
The simplicity of the D → ∞ limit causes the disappearance of derivatives from a Hamiltonian as well as h → 0, so is a true classical limit.27 It is different from a semiclassical approximation such as WKB theory for small h. The simplicity of the D = 1 limit keeps derivatives in a Hamiltonian and is a true hyperquantum limit. Combining these extreme partner limits delivers the dimensional interpolation formula. It was tried out with two-electron atoms20 and generalized out with few electron atoms and simple diatomic molecules.23 Here we find the interpolation approach is appropriate for metallic hydrogen. With beginning by Loeser,22 we find the interpolation not only provided adequate energies but also the correct function forms of symmetry and lattice parameters. From the gradient and the curvature of the energy curves as a function of the lattice parameter R, we were able to calculate some important physical quantities. Among are the bulk and shear moduli, and three temperatures governed by pressure: the Debye temperature, the Lindemann melting temperature, and the critical transition temperature for superconductivity.It is relatively easy to calculate the D → ∞ and D = 1 limits, so the interpolation formula can predict results for the physical dimension, D = 3. Therefore, D-scaling might approach the electronic structure of strongly correlated systems, where often traditional approaches are faced with computational difficulties!
Conflicts of interest
There are no conflicts to declare.Acknowledgements
S. K. would like to acknowledge funding by the U.S. Department of Energy (Office of Basic Energy Sciences) under Award No. DE-SC0019215.References
- E. Wigner and H. B. Huntington, J. Chem. Phys., 1935, 3, 764–770 CrossRef CAS.
- R. J. Hemley and H. K. Mao, Phys. Rev. Lett., 1988, 61, 857 CrossRef CAS.
- R. J. Hemley, M. Hanfland and H. K. Mao, Nature, 1991, 350, 488–491 CrossRef CAS.
- R. J. Hemley, H. k. Mao, A. F. Goncharov, M. Hanfland and V. Struzhkin, Phys. Rev. Lett., 1996, 76, 1667 CrossRef CAS.
- M. Zaghoo, A. Salamat and I. F. Silvera, Phys. Rev. B, 2016, 93, 155128 CrossRef.
- I. F. Silvera and R. Dias, J. Phys.: Condens. Matter, 2018, 30, 254003 CrossRef.
- P. Loubeyre, F. Occelli and P. Dumas, Nature, 2020, 577, 631–635 CrossRef CAS.
- E. Babaev and N. W. Ashcroft, Nat. Phys., 2007, 3, 530–533 Search PubMed.
- E. Babaev, A. Sudbø and N. W. Ashcroft, Nature, 2004, 431, 666–668 CrossRef CAS.
- E. Babaev, Phys. Rev. Lett., 2002, 89, 067001 CrossRef.
- D. R. Herschbach, J. S. Avery and O. Goscinski, Dimensional Scaling in Chemical Physics, Springer Science & Business Media, 1993 Search PubMed.
- D. Z. Goodson, M. López-Cabrera, D. R. Herschbach and J. D. Morgan III, J. Chem. Phys., 1992, 97, 8481–8496 CrossRef CAS.
- Z. Zhen and J. Loeser, Large-D Limit for N-Electron Atoms, Springer, 1993, pp. 83–114 Search PubMed.
- S. Kais and D. R. Herschbach, J. Chem. Phys., 1994, 100, 4367–4376 CrossRef CAS.
- J. Rudnick and G. Gaspari, Science, 1987, 237, 384–389 CrossRef CAS.
- J. G. Loeser, Z. Zhen, S. Kais and D. R. Herschbach, J. Chem. Phys., 1991, 95, 4525–4544 CrossRef CAS.
- S. Kais and D. R. Herschbach, J. Chem. Phys., 1993, 98, 3990–3998 CrossRef CAS.
- Q. Wei, S. Kais and D. Herschbach, J. Chem. Phys., 2008, 129, 214110 CrossRef.
- Q. Wei, S. Kais and D. Herschbach, J. Chem. Phys., 2007, 127, 094301 CrossRef.
- D. R. Herschbach, J. G. Loeser and W. L. Virgo, J. Phys. Chem. A, 2017, 121, 6336–6340 CrossRef CAS.
- T. C. Germann and S. Kais, J. Chem. Phys., 1993, 99, 7739–7747 CrossRef CAS.
- J. G. Loeser, Large-D Limit for Metalic Hydrogen, Dimensional Scaling in Chemical Physics, Springer, 1993, pp. 389–427 Search PubMed.
- K. J. B. Ghosh, S. Kais and D. R. Herschbach, Front. Phys., 2020, 8, 331 CrossRef.
- D. D. Frantz and D. R. Herschbach, Chem. Phys., 1988, 126, 59–71 CrossRef.
- A. L. Tan and J. G. Loeser, in Simple molecules and variant scalings, ed. D. R. Herschbach, J. Avery and O. Goscinski, Springer Netherlands, Dordrecht, 1993, pp. 230–255 Search PubMed.
- M. López-Cabrera, A. L. Tan and J. G. Loeser, J. Phys. Chem., 1993, 97, 2467–2478 CrossRef.
- J. G. Loeser, J. H. Summerfield, A. L. Tan and Z. Zheng, J. Chem. Phys., 1994, 100, 5036–5053 CrossRef CAS.
- M. Born and R. D. Misra, Math. Proc. Cambridge Philos. Soc., 1940, 466–478 CrossRef CAS.
- I. R. Lapidus, Am. J. Phys., 1975, 43, 790–792 CrossRef CAS.
- I. R. Lapidus, Am. J. Phys., 1982, 50, 453–456 CrossRef CAS.
- B. I. Min, H. J. F. Jansen and A. J. Freeman, Phys. Rev. B: Condens. Matter Mater. Phys., 1984, 30, 5076–5083 CrossRef CAS.
- K. K. Mon, G. V. Chester and N. W. Ashcroft, Phys. Rev. B: Condens. Matter Mater. Phys., 1980, 21, 2641–2646 CrossRef CAS.
- P. Nozières and D. Pines, Phys. Rev., 1958, 111, 442–454 CrossRef.
- E. E. Salpeter and H. S. Zapolsky, Phys. Rev., 1967, 158, 876–886 CrossRef CAS.
- P. M. Robitaille, Prog. Phys., 2011, 7, 4005 Search PubMed.
- S. A. Bonev, E. Schwegler, T. Ogitsu and G. Galli, Nature, 2004, 431, 669–672 CrossRef CAS.
- K. K. Phani and D. Sanyal, Mater. Sci. Eng., A, 2008, 490, 305–312 CrossRef.
- O. L. Anderson, J. Phys. Chem. Solids, 1963, 24, 909–917 CrossRef CAS.
- C. Li and Z. Wang, in Advances in Science and Technology of Mn + 1AXn Phases, ed. I. Low, Woodhead Publishing, 2012, pp. 197–222 Search PubMed.
- M. Ross and C. Shishkevish, Molecular and metallic hydrogen, Tech. Rep. (RAND CORP SANTA MONICA CA), 1977 Search PubMed.
- V. P. Trubitsyn, Sov. Astron., 1971, 15, 303 Search PubMed.
- N. W. Ashcroft, Phys. Rev. Lett., 1968, 21, 1748–1749 CrossRef CAS.
- B. Cheng, G. Mazzola, C. J. Pickard and M. Ceriotti, Nature, 2020, 585, 217–220 CrossRef CAS.
- M. R. Koblischka, S. Roth, A. Koblischka-Veneva, T. Karwoth, A. Wiederhold, X. L. Zeng, S. Fasoulas and M. Murakami, Metals, 2020, 10, 158 CrossRef CAS.
| This journal is © the Owner Societies 2021 |

