 Open Access Article
Creative Commons Attribution 3.0 Unported Licence
Diffusion of the carbon dioxide–ethanol mixture in the extended critical region†
René Spencer
Chatwell
 a,
Gabriela
Guevara-Carrion
 a,
Yuri
Gaponenko
b,
Valentina
Shevtsova
 b and
Jadran
Vrabec
 *a
*a
aThermodynamics and Process Engineering, Technische Universität Berlin, 10587 Berlin, Germany. E-mail: vrabec@tu-berlin.de; Tel: +49 30 314 22755
bMicrogravity Research Center, Université Libre de Bruxelles, 1050 Bruxelles, Belgium
First published on 18th January 2021
Abstract
The effect of traces of ethanol in supercritical carbon dioxide on the mixture's thermodynamic properties is studied by molecular simulations and Taylor dispersion measurements. This mixture is investigated along the isobar p = 10 MPa in the temperature range between T = 304 and 343 K. Along this path, the mixture undergoes two transitions: First, the Widom line is crossed, marking the transition from liquid-like to gas-like conditions. A second transition occurs from the supercritical gas-like domain to a subcritical gas. The Widom line crossover entails inflection points for most of the studied properties, i.e. density, enthalpy, shear viscosity, Maxwell–Stefan and intradiffusion coefficients. On the other hand, the transition between the super- and subcritical regions is found to be generally smooth, an observation that is qualitatively confirmed by experimental Taylor dispersion measurements. Dedicated atomistic simulations show the presence of microheterogeneities due to ethanol self-association along the investigated path, which lead to the mixture's anomalous behavior in its extended critical region.
1 Introduction
Investigating the thermophysical properties of supercritical carbon dioxide (scCO2) has grown to a topic of great interest.1–4 While the majority of work had focused on pure fluids in sufficient distance from the critical point,5,6 only some special case scenarios with respect to a second component have been examined under near-critical conditions.7–9CO2 is commonly used in various technological applications, ranging from environmental, mechanical, chemical, geothermal to pharmaceutical industries.10 It constitutes an attractive alternative to organic or aqueous solvents by having a remarkably mild critical point, being non-toxic, non-flammable, widely available and largely inert. However, due to its low dielectric constant in combination with a zero dipole moment,11 it is a poor solvent for polar substances. Yet, the solubility of high molecular weight solutes is readily enhanced by adding small amounts of strongly polar entrainers.12,13 Consequently, ethanol emerges as a widespread commodity in supercritical extraction processes. Further, ethanol forms a non-ideal mixture with CO2 due to the presence of strong solute-solute interactions and hydrogen bonding making this mixture particularly interesting.
In contrast to the classical perception of the supercritical region as a featureless domain, experimental evidence14–17 and molecular dynamics simulations3,4,9,18–20 indicate a partition into several subdomains. The continuous dynamic crossover between different domains occurs across transition lines, i.e. Fisher–Widom,21 Nishikawa,14,16 Frenkel22,23 and Widom.24 For moderate pressures, i.e. up to three times the critical pressure25p ≤ 3pc, the crossover between gas-like and liquid-like regimes is accomplished over a delta shaped area20,26,27 that is delimited by the loci of extrema of particular thermodynamic response functions, i.e. isobaric and isochoric heat capacities cp, cv, thermal expansion αv, isothermal compressibility βT, density ρ and speed of sound c. These response functions eventually confluence to a single line in close vicinity to the critical point, the so-called Widom line, which can be considered as an extension of the vapor pressure curve. Crossing the Widom line is additionally associated with a minimum of the thermodynamic factor and with large density fluctuations.28
While the critical point exhibits critical opalescence,29 its extended vicinity is characterized by emerging microscopic clusters that have been observed experimentally28 and with equilibrium molecular dynamics simulations.30–34 The present work contributes to the understanding of how ethanol diluted into CO2 affects the mixture's microscopic structure and consequently its transport properties in the extended critical region. The CO2 + ethanol mixture was examined twofold. While the microscopic structure was investigated exclusively by equilibrium molecular dynamics (EMD) simulations, mutual diffusion was sampled atomistically and was measured in the lab with the Taylor dispersion technique. The present mixture has already been investigated experimentally35–37 and by molecular simulations. In particular, the vapor–liquid equilibrium (VLE),38 solubility parameters,39 microscopic structure31,32,40–42 and diffusion coefficients43 have been studied by molecular simulation. However, the effects of structural changes on mutual diffusion across the Widom line in the extended critical region of this mixture have not yet been considered neither experimentally, nor by molecular simulation. This is of special interest for the understanding and description of supercritical extraction processes which are performed in this region.
2 Method
2.1 Molecular simulation
Classical molecular simulations are based on molecular force fields models that are typically optimized to describe the pure component phase behavior. The transferability to a given mixture is validated by comparing simulation predictions to experimental data along the VLE curves. While the employed force fields were based on the Lennard-Jones potential for both components, a predictive mode was used to describe the interactions between unlike Lennard-Jones sites, i.e. the Lorentz–Berthelot combining rules were assumed. The force field for ethanol consisted of three Lennard-Jones sites with three superimposed point charges.44 In contrast, the two Lennard-Jones sites of carbon dioxide's force field included a superimposed point quadrupole.45 States along the VLE curves were sampled by Monte Carlo (MC) simulations with the grand equilibrium method containing N = 1372 molecules for the liquid phase and N = 460 molecules for the gas phase simulations.The MC simulation results for the VLE curves are in excellent agreement with experimental literature data46–52 over the entire investigated temperature and pressure ranges, cf.Fig. 1. In order to properly appreciate the simulation results, the coexistence curves were additionally computed by three equations of state, allowing for a temperature-dependent binary parameter kij, cf.Table 1. While the employed cubic equations of state, i.e. Soave–Redlich–Kwong53 and Peng-Robinson,54 tend to overestimate the mixture's vapor pressure at high CO2 mole fractions, the PCP-SAFT55 equation of state overestimates the vapor pressure at low CO2 mole fractions.
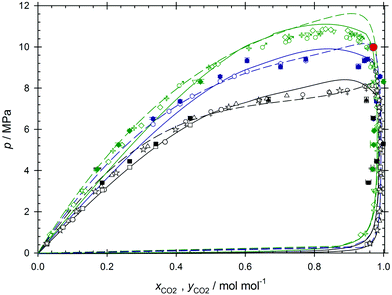 | ||
| Fig. 1 Vapor–liquid phase diagram of CO2 + ethanol. The open symbols indicate experimental literature data along three isotherms depicted in black T = 312 K (bullets,49 squares,49 triangles,50 stars,46 male symbols47), blue T = 325 K (hexagons56) and green T = 333 K (diamonds,49 inverted triangles,49 crosses,46 female symbols47). The solid symbols are present molecular simulation results. The solid lines represent the binodals according to the Peng–Robinson and the dashed lines according to the PCP-SAFT equation of state. The solution according to the Soave–Redlich–Kwong equation was omitted to maintain readability. The red bullet symbolizes the molar composition xCO2 = 0.97 mol mol−1 and pressure p = 10 MPa at which all other molecular dynamics simulations were carried out. | ||
| Equation of state | m/10−4 | C |
|---|---|---|
| Peng–Robinson | −1.7 | 0.0879 |
| Soave–Redlich–Kwong | −1.0 | 0.0863 |
| PCP-SAFT | −3.0 | 0.0506 |
The intra- Di and Maxwell–Stefan Ð diffusion coefficients as well as the shear viscosity were sampled directly with EMD simulation and the Green–Kubo formalism.57,58 The working equations for the determination of these transport properties have been published e.g. in ref. 59 and are not repeated here. EMD simulations for transport properties were made in two steps. In the first step, a simulation in the isobaric-isothermal (NpT) ensemble was performed to calculate the density at the desired temperature and pressure. In the second step, EMD simulations were performed at this temperature and density in the canonical (NVT) ensemble containing N = 3000 molecules in cubic volumes with periodic boundary conditions and specifying an integrator time step of Δt = 1 fs. The associated finite size effects were corrected with a modified Yeh–Hummer approach60,61 employing the sampled shear viscosity values. To improve statistics, a total of 2.5 × 10⁵ correlation functions was averaged. The thermodynamic factor Γ was sampled directly with Kirkwood–Buff integration based on the methodology proposed by Ganguly and van der Vegt,62 which was found to be the most adequate in previous work.63 Extrapolation to the thermodynamic limit was not necessary. All molecular simulations were performed with the fully open source software ms2.64 Statistical uncertainties were calculated with the error propagation law and a coverage factor of k = 1. Throughout, the cut-off radius was set to rc = 17.5 Å. Electrostatic long-range corrections were made using the reaction field technique with conducting boundary conditions (εRF = ∞).
2.2 Taylor dispersion technique
The employed Taylor apparatus has been optimized for the use of scCO2 as described in preceding works.35,65,66 The experimental determination of the mixture's mutual diffusion coefficient D constitutes a four stage procedure utilizing the Taylor dispersion technique. The experimental schematic is disclosed in the ESI.† During the first step, the pure CO2 carrier fluid which was stored under VLE conditions, i.e. at T = 288.15 K, p ∼ 5 MPa with a purity 0.99998 mol mol−1 (Air Liquide), was initially liquefied through a cryostat reducing its temperature to T = 269.15 K. Liquid CO2 was subsequently pumped above the critical pressure and eventually heated to its target temperature before it reached the injection valve (Knauer model D-14163). In the second step, scCO2 was delivered to the dispersion tube with a constant flow rate. The carrier stream was thermostated by means of a heat reservoir ensuring a constant target temperature ranging from Texp = 304 to 343 K with an accuracy of ±0.1 K and barostated with a high pressure pump at pexp = 10 MPa with ±0.05 MPa accuracy. The ethanol sample (purity 99.9% (GC) in volume fraction, CAS 64-17-5; purchased from VWR) adopts to the respective target temperature Texp within the valve's loop prior to its injection into the scCO2 stream. In order to ensure temperature homogenization in this section of the experiment, the dispersion tube and injection valve were placed inside a polyurethane foam insulated housing with an additional air fan. In the third step, the sample was injected into the scCO2 stream. The resulting strongly diluted mixture was fed to a l = 30.916 ± 0.001 m long dispersion capillary with a circular cross section of radius r = 0.375 mm. The capillary was coiled around a grooved, hollow aluminum cylinder with radius Rc = 0.175 m providing stability and fixation. The cylinder was additionally thermostated with an internal circular flow ensuring a temperature stabilization of ±0.1 K. In order to minimize pressure and density disturbances during injection, an ethanol sample volume of V0 = 2 × 10⁻⁶ dm3 was selected, with smaller volumes having a negative effect on the signal-to-noise ratio.35,65 The pressure of the system was controlled by a back pressure regulator (Jasco BP-2080) and measured by means of a pressure sensor (JUMO dTrans p30) with an accuracy of ±0.05 MPa. In the experiment's final step, the Taylor peak was monitored at the outlet of the dispersion tube by means of a FT-IR spectrometer (Jasco FT-IR 4100) with ± 0.01 cm−1 accuracy and 4 cm−1 resolution. In contrast to its nominal operation, the employed FT-IR was equipped with a custom-built high pressure demountable cell (Harrick) that was optimized for the best possible signal-to-noise ratio.35 The ZnSe cell had a thickness 150 μm35 and allowed for a maximum working pressure of 25 MPa. The data generated by the FTIR were digitally read out by a specific software (Spectra Manager by Jasco) and the variation of the solute concentration over time was monitored through the absorbance spectra at wavenumbers corresponding to different vibration modes. The procedure to select the working wavenumbers, the experimental protocol and the fitting procedure have been reported in ref. 65 and 66.3 Results
3.1 Critical line and Widom line
The CO2 + ethanol mixture was investigated by EMD simulation along the isobar p = 10 MPa in the temperature range between T = 305 and 340 K with a composition xCO2 = 0.97 mol mol−1, cf.Fig. 2. This composition was chosen as the closest to the infinite dilution limit that allowed for adequate statistics. Along this path, the mixture undergoes two transitions, indicated as I and II in Fig. 2. First, the Widom line is crossed at T ∼ 323 K (point I) marking the transition from liquid-like to gas-like conditions, as indicated by the maxima of the response functions cp, αv, βT, cf. Fig. S2–S4 in the ESI.† Each function's inflection point corresponds to a maximum of a thermodynamic response function and consequently determines the mixture's Widom line. The inflection points of the enthalpy and density, which correspond to maxima of the isobaric heat capacity cp and the thermal expansion αv, respectively, occur according to the employed force field at T = 317 K for pure CO2 and T = 323 K for the mixture, cf.Fig. 3. Thus, the addition of a small amount of ethanol shifts the Widom line up by ∼ 6 K. To assess the capability of the employed force field to predict the studied properties, the temperature dependence of density and enthalpy of pure CO2 was compared to the Span–Wagner equation of state,67 which is of reference quality. In general, the employed CO2 force field is able to predict the density of CO2 in the studied temperature and pressure ranges with a good accuracy. The average deviation between simulation results and the Span–Wagner equation of state67 is 5.4%. However, the predicted inflection points, which define the Widom line, occur approximately 2 K below those according to the Span–Wagner equation of state.67 Therefore, the related uncertainty of the present simulation results is expected to have a similar magnitude, which is marked as a shaded region around the calculated transition points I and II.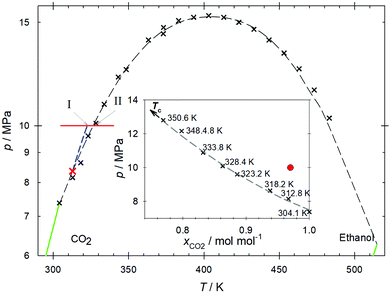 | ||
| Fig. 2 Pressure–temperature projection of both components' vapor pressure curves (green lines). The critical line of the mixture (dashed line) was determined on the basis of experimental literature data68,69 (black crosses). The Widom line (dashed blue line) extends the influence of the present mixture's (xCO2 = 0.97 mol mol−1) critical point (red cross) to higher temperatures and pressures. The red line represents the studied isobar in the homogeneous region. Points I and II represent the crossing of the Widom line and the transition from the super- to the subcritical regimes. The inset shows the critical line (dashed line) as a function of mole fraction as given in Table 2 (black crosses). The red bullet symbolizes the molar composition xCO2 = 0.97 mol mol−1 and pressure p = 10 MPa at which all molecular dynamics simulations were carried out. | ||
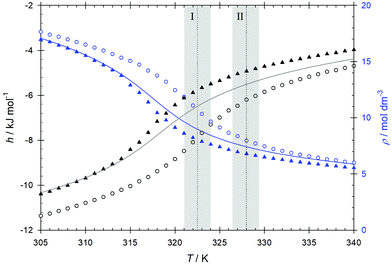 | ||
| Fig. 3 EMD simulation results for enthalpy h (black) and density ρ (blue) of pure CO2 (triangles) and the CO2–ethanol mixture (circles) to determine the Widom line at pressure p = 10 MPa. The lines represent the properties of pure CO2 calculated with the Span–Wagner equation of state.67 Statistical uncertainties are within symbol size. The temperatures I and II represent the crossing of the Widom line and the transition from the super- to the subcritical regimes. The shaded areas indicate their expected uncertainty. | ||
After crossing the Widom line, the mixture undergoes a transition from the supercritical gas-like domain to a gas at subcritical conditions at T ∼ 328 K (point II), as indicated by the critical line of the mixture, cf.Table 2. More specifically, while for T = 318 K all states above p = 8.64 MPa and xCO2 = 0.938 mol mol−1 are located in the supercritical region, for T = 328 K only states above p = 10.09 MPa and xCO2 = 0.863 mol mol−1 lie in the supercritical region. This can be clearly seen in the inset of Fig. 2, while for temperatures below T ∼ 328 K the simulated pressure-composition pair is clearly located above the critical line, for higher temperatures, the simulated pressure is below that of the critical line. The pressure–temperature projection of the vapor pressure curves for the CO2 + ethanol mixture is shown in Fig. 2. The critical line of the mixture was determined by joining the mixture's critical points from experimental data.67–70 A distinctive feature of the curve is that it goes through a pronounced pressure maximum at p ∼ 15.5 MPa despite the relatively small difference between the critical pressures of pure CO2 and pure ethanol, pc = 7.4 and 6.3 MPa, respectively. The large temperature range of that curve (304 K to 515 K) is simply due to the difference between the critical temperatures of the pure substances. Note that the composition varies along the critical line such that the pressure-composition pair that is focussed on does not cross the two-phase region.
| T/K | p/MPa | x CO2/mol mol−1 |
|---|---|---|
| 304.13 | 7.38 | 1.0 |
| 312.82 | 8.15 | 0.967 |
| 318.24 | 8.64 | 0.938 |
| 328.36 | 10.09 | 0.863 |
| 333.82 | 10.88 | 0.832 |
| 350.62 | 12.80 | 0.769 |
| 514.71 | 6.27 | 0.0 |
3.2 Intradiffusion coefficients
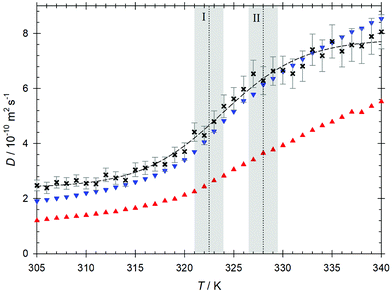
The dynamical crossover between the supercritical high density and the low density regimes across the Widom line has been related to the presence of inflection points or extrema of some transport coefficients.3 Therefore, the analysis of the diffusion behavior of the mixture along the regarded isobar offers insight into the underlying transition dynamics. The temperature dependence of the intradiffusion coefficient of CO2 is sigmoidal, with an initially rather weak temperature dependence followed by a strong stepwise increase at temperatures between T = 320 and 330 K, cf.Fig. 4. This curve is similar to that observed for the enthalpy and shows an inflection point at the Widom line, i.e. at T ∼ 323 K. The random propagation of molecules is not only dependent on the thermodynamic state point, but is also strongly affected by other factors like molecular size and polarity. Thus, within a mixture, the components generally propagate with different velocity distributions leading to different intradiffusion coefficients. In fact, the intradiffusion coefficient of the bulkier ethanol molecules is on average 40% lower than that of the smaller CO2 molecules. Although both curves show a sigmoidal behavior, the stepwise increase of the intradiffusion coefficient of ethanol is less pronounced than the one of CO2, which can be linked to the presence of local density inhomogeneities caused by self-association. Further, the inflection point of the curve is observed at the transition between the super- and subcritical regimes T ∼ 328 K.3.3 Microscopic structure
To elucidate the relevant microscopic structure aspects, the center-of-mass radial distribution functions of the ethanol–ethanol gEtOH–EtOH(r), CO2–ethanol gCO2–EtOH(r) and CO2–CO2gCO2–CO2(r) pair interactions were analyzed, cf.Fig. 5 and Fig. S5 of the ESI.† The main peak of gEtOH–EtOH(r) with a maximum located at r ∼ 4.3 Å is related to ethanol self-association through hydrogen bonding. This first peak is followed by a well defined shoulder, which is more pronounced at the lowest studied temperature and indicates an overlap with the second solvation shell. The location of the main peak does not change significantly along the studied isobar, suggesting that ethanol remains structured at short intermolecular distances. On the other hand, gCO2–CO2(r) shows a well defined first peak followed by a considerably smaller second peak, which becomes weaker with increasing temperature and disappears at T ∼ 330 K. This reduction of the long-range structure is expected because of the transition from supercritical gas-like to compressed gas conditions. The observed differences in peak intensity and the relatively small main peaks observed in the radial distribution functions at lower temperatures are mainly a result from statistical standardization, i.e. more ethanol or CO2 molecules can be found in the far range of the simulation volume.71 The CO2–ethanol pair interaction, shown in Fig. S5 in the ESI,† exhibits a relatively small peak with a shoulder located between r ∼ 3.0 and 6.3 Å, which partially lies within the range of hydrogen bonding interactions and suggests the occurrence of relatively strong CO2–ethanol association.32 However, because of the rather small peak magnitude, these interactions are expected to occur rather sporadically.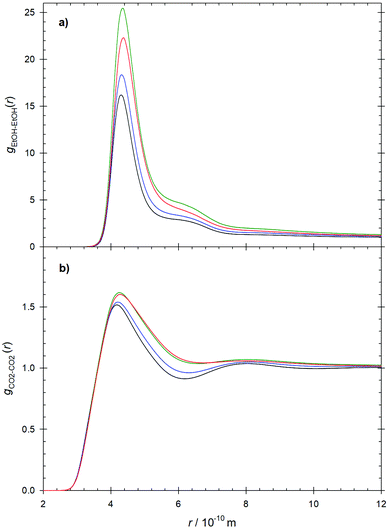 | ||
| Fig. 5 (a) Ethanol–ethanol and (b) CO2–CO2 radial distribution functions at T = 310 K (black), 320 K (blue), 330 K (green) and 340 K (red) along the isobar p = 10 MPa. | ||
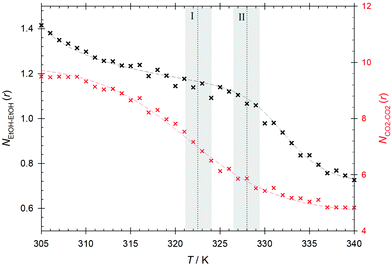
A quantification of the local inhomogeneities can be achieved by monitoring the average coordination numbers for the first coordination shell defined as  . Therein, x stands for the central interaction site surrounded by interaction sites of type y, ρy is the bulk density of interaction sites of type y, gx−y(r) represents the radial distribution function of the pair involved in the running average number calculation and rc is the radius of the first coordination shell, i.e. the location of the first minimum of the regarded radial distribution function gx−y(r). The average coordination number NCO2–CO2 shows a similar behavior as the bulk density. At temperatures between T = 315 and 330 K, the coordination number decreases rapidly to approximately one third of its initial value and remains more stable in the compressed gas region, cf.Fig. 6. The strong decrease of the coordination number is mirrored in the observed stepwise increase of the CO2 intradiffusion coefficient. Similarly, the inflection point of the coordination number was also found to be located at the Widom line, i.e. at T ∼ 323 K. The average coordination number NEtOH–EtOH, indicating the amount of ethanol self-association, shows a stronger temperature dependence in the supercritical liquid-like region. At T = 305 K, each ethanol molecule is associated on average with 1.4 alcohol molecules, but after an increase of 10 K in temperature this value is reduced to 1.23. This implies a reduction of about 12% in the hydrogen bonded structures and explains the related increase of the ethanol intradiffusion coefficient between T = 305 and 315 K. In the region between 315 and 328 K, the decrease of the average ethanol–ethanol coordination number is much less pronounced than that of CO2, suggesting the presence of enhanced ethanol hydrogen bonded structures that are disrupted to a lesser extent by the strong density reduction. These rather stable ethanol hydrogen bonded structures are linked to mixture microheterogeneities observed in the domain influenced by the Widom line and the super- to subcritical transition. The relatively small values of the thermodynamic factor as well as the milder sigmoidal increase of the ethanol intradiffusion coefficient can also be explained with these microscopic structures. At temperatures above T ∼ 328 K, the coordination number decreases almost stepwise, suggesting a steady breakup of the hydrogen bonded structures with temperature in the compressed gas region.
The presence of ethanol self-association and microheterogeneities can be visually corroborated when simulation snapshots are analyzed. Although a snapshot represents only one microstate of a molecular system, in case of mixtures with associating components, a single microstate may well represent all possible microstates, since they are permutations of the segregation patterns.72Fig. 7 shows snapshots of simulation volumes for four temperatures. In spite of the low alcohol content, ethanol molecules tend to self-associate and form hydrogen bonded networks. At low temperatures up to the Widom line, most of the ethanol molecules are part of clusters that form segregated domains. As the temperature is increased, the ethanol clusters become smaller and are more uniformly distributed in the simulation volume. This observation corresponds to the observed values of the intradiffusion coefficient of ethanol and the relatively low values of the thermodynamic factor.
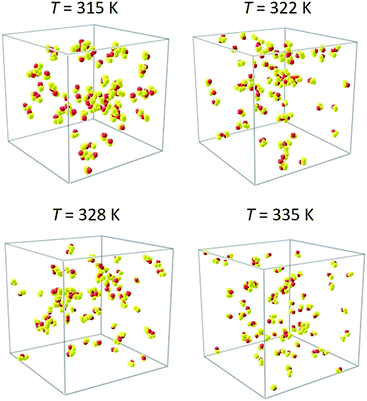 | ||
| Fig. 7 Snapshots of the present EMD simulations at selected temperatures. The CO2 solvent molecules were graphically removed to reveal clustering among ethanol molecules. | ||
3.4 Mutual diffusion coefficients
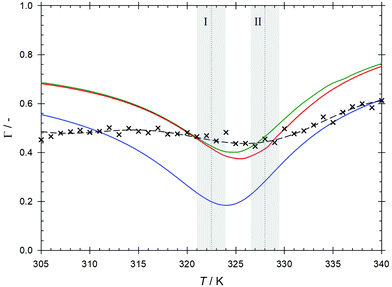
The Maxwell–Stefan diffusion coefficient calculated from the Onsager phenomenological coefficients73 of the studied mixture is shown in Fig. 4. As can be seen for temperatures below T = 328 K, the Maxwell–Stefan diffusivity curve runs almost parallel to and above the one of CO2 intradiffusion. Higher values of the Maxwell–Stefan diffusion coefficient with respect to the intradiffusion coefficient are related to cluster formation due to alcohol self-association.74 In the regime following the transition to the compressed gas, the Maxwell–Stefan diffusion coefficient becomes lower than the CO2 intradiffusion coefficient, which is in line with the strong reduction of the ethanol hydrogen bonded structures indicated by the decrease of the average ethanol–ethanol coordination number. The inflection point of the Maxwell–Stefan diffusivity curve is located in the vicinity of the Widom line, i.e. at T ∼ 324 K.The Maxwell–Stefan diffusion coefficient obtained from EMD simulation can be straightforwardly related to the Fick diffusion coefficient D through the so-called thermodynamic factor Γ, i.e. D = ΓÐ, which is a measure of the mixture's non-ideality. Because of the nature of the CO2 + ethanol mixture and the presence of microheterogeneities, the sampled thermodynamic factor reaches relatively low values Γ ∼ 0.45. The expected minimum of the thermodynamic factor in the proximity of the Widom line is predicted clearly by the employed equations of state. The Kirkwood–Buff integration results predict a weaker minimum shifted to higher temperatures, cf.Fig. 8. For the sake of consistency and because of the rather large differences in Γ obtained from the different equations of state, the thermodynamic factor from Kirkwood–Buff integration was employed here to calculate the Fick diffusion coefficient. Since the values of the sampled thermodynamic factor do not show a strong variation in the range of the studied thermodynamic conditions, the temperature dependence of the sampled Fick diffusion coefficient is similar to that observed for the Maxwell–Stefan diffusion coefficient, cf.Fig. 9. However, its inflection point is shifted to a higher temperature, i.e. T ∼ 329 K, which can be explained with the changes observed for the ethanol–ethanol average coordination number near this temperature. In general, values of the Fick diffusion coefficient sampled by EMD are comparable with present measurements within the statistical uncertainties, cf.Table 3. However, the experimental values exhibit a smoother temperature dependence with an inflection point located at T ∼ 327 K. The comparably lower values of the predicted Fick diffusion coefficient in the supercritical liquid-like region, i.e. at T < 320 K, could be due to an overestimation of ethanol self-association by molecular simulation. Approaching the Widom line, where density variations are large, simulation and experimental results agree quite well up to T ∼ 332 K, i.e. right after the transition into the subcritical region. At the highest studied temperatures, the Fick diffusion coefficient predicted by EMD is overestimated when compared with the experimental data. This suggests that the actual breakup of ethanol hydrogen bonded structures in the compressed gas region occurs more gradually than predicted by EMD simulation. It should be noted that contrary to EMD simulations, where the mixture concentration is exactly known, the experimental concentration can only be estimated. Therefore, the differences between simulation and experimental values can partially be explained with the difference in ethanol concentration, which has been proven to have a strong influence on the Fick diffusion coefficient even in the dilution limit of scCO2 mixtures.66,75 This significant influence of concentration on the Fick diffusion coefficient is mainly related to the strong concentration dependence of the thermodynamic factor given by the proximity of the critical point.66 A direct comparison of present experimental results with data from previous studies36,37 is not possible because of they were measured for different state points.
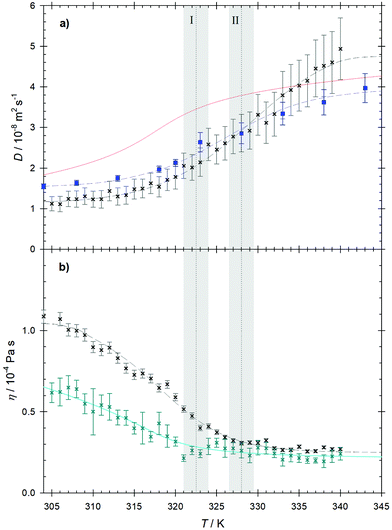 | ||
| Fig. 9 (a) Fick diffusion coefficient predicted by EMD simulation (crosses) and obtained experimentally (squares) as a function of temperature along the isobar p = 10 MPa. The red line represents the predictive equation by He and Yu.82 (b) Shear viscosity predicted by EMD simulation (crosses) compared to the shear viscosity of pure CO2 according to the correlation by Laesecke and Muzny84 (cyan line). The dashed lines serve as a guide to the eye. The temperatures I and II represent the crossing of the Widom line and the transition from the super- to subcritical regimes. The shaded areas indicate their expected uncertainty. | ||
| T/K | D/10−8 m2 s−1 | σ/10−8 m2 s−1 |
|---|---|---|
| 304 | 1.55 | 0.06 |
| 308 | 1.64 | 0.07 |
| 313 | 1.75 | 0.07 |
| 318 | 1.97 | 0.08 |
| 320 | 2.07 | 0.09 |
| 323 | 2.43 | 0.23 |
| 328 | 2.86 | 0.25 |
| 333 | 3.34 | 0.28 |
| 338 | 3.62 | 0.31 |
| 343 | 3.97 | 0.36 |
The Stokes–Einstein based equations by Wilke-Chang,76 Sassiat,77 Tyn-Calus,78 Scheibel,76 Reddy-Doraiswamy79 and Lai-Tan80 as well as the free volume based equations by Catchpole and King,81 He and Yu82 as well as Funazukuri et al.83 were tested with respect to their ability to predict the Fick diffusion coefficient at infinite dilution of the CO2 + ethanol mixture. However, none of these equations was able to capture neither qualitatively nor quantitatively the present experimental Fick diffusion coefficient values, cf. Fig. S7 of the ESI.† The predictive He and Yu82 equation yields the best results among the tested equations, however, its agreement with the present experimental results is quite poor in the supercritical region, cf.Fig. 9(a). The strong overestimation of the Fick diffusion coefficient in regions with a higher density, where ethanol self-association plays a decisive role for molecular mobility, as well as the better agreement with experiments in the compressed gas region, indicate a failure of these models to adequately consider the hydrogen bonded structures in the mixture.
3.5 Shear viscosity
The importance of considering information on hydrogen bonding dynamics for the prediction of transport properties can be clearly observed when the shear viscosity is analyzed. Fig. 9(b) shows the strong difference between the shear viscosity of pure CO2 and that of the mixture. In the liquid-like region, where intermolecular forces dominate the viscous effects, the shear viscosity of the mixture exhibits an increment of approximately 70% from the value of pure CO2. This enhancement can be ascribed to the presence of microheterogeneities caused by hydrogen bonding networks despite the small amount of ethanol present in the mixture. Here, ethanol self-association is expected to play the main role in the formation of microscopic structures because of the low values of the CO2–ethanol coordination number, i.e. NCO2–EtOH < 0.3. As higher temperatures are reached, the momentum transfer due to molecular thermal motion makes an increasingly important contribution to the shear viscosity and hydrogen bonds break, reducing the viscosity enhancement to less than 15% in the compressed gas region. Further, the shear viscosity curve of the mixture shows an inflection point located at T ∼ 320 K, which cannot be observed for pure CO2. Viscosity and diffusion curves exhibit an opposing behavior, as expected from the Stokes–Einstein equation.4 Conclusions
A study on the dynamic behavior of ethanol diluted in –CO2 in the temperature range from T = 304 to 343 K along the isobar p = 10 MPa was conducted employing complementary approaches, i.e. experiment and molecular simulation. Along this path, the studied mixture goes through a transition in the supercritical region by crossing the Widom line and from super- to subcritical regimes. The Fick diffusion coefficient was measured with the Taylor dispersion technique, while several EMD simulation methods were employed. Shear viscosity, intra- and Maxwell–Stefan diffusion coefficients were sampled with equilibrium molecular dynamics, employing rigid, non-polarizable force fields based on Lennard-Jones sites and superimposed point charges or quadrupoles, and the Green–Kubo formalism. The thermodynamic factor was calculated with Kirkwood–Buff integration. In this way, the Fick diffusion coefficient was determined by EMD simulations consistently on the basis of the selected force fields. In order to validate the force fields employed to describe the mixture, the VLE of the mixture was calculated at three temperatures and compared successfully with experimental data from the literature. Further, to gain insight into the microscopic structure of the mixture, center-of-mass radial distribution functions as well as averaged coordination numbers were investigated.In the region where the crossover between the liquid-like and gas-like regimes occurs, several thermophysical properties become very sensitive to temperature and pressure variations and can therefore change drastically along supercritical paths. Along the studied isobar, the presence of inflection points in the temperature dependence of density, enthalpy, shear viscosity, intra- and transport diffusion coefficients were reported. Mostly, the inflection points were observed at temperatures between T ∼ 321 and ∼324 K, a range that specifies the region influenced by the Widom line. Moreover, the calculated values of the center-of-mass average coordination numbers up to the first solvation shell also exhibit an inflection point in this region, shedding light on the underlying microscopic structural background of the observed macroscopic property behavior.
The transition between the supercritical gas-like and the subcritical compressed gas regimes at T ∼ 328 K is smooth for most of the studied properties, i.e. density, enthalpy, shear viscosity, Maxwell–Stefan and CO2 intradiffusion coefficients. However, the intradiffusion coefficient of ethanol and the Fick diffusion coefficient showed an inflection point in the proximity of this transition. It was noticed that the averaged coordination number of ethanol–ethanol pairs, which is an indicator of ethanol self-association, shows an almost stepwise change in this region. This was related to a relatively strong decrease of ethanol self-association when moving from supercritical to subcritical states, which could also be observed by analyzing snapshots of the simulation volumes.
A satisfactory agreement was found between predictive EMD simulation data and experimental results for the Fick diffusion coefficient, especially in the temperature range from the Widom line to the super- to subcritical transition. Both experiment and simulation exhibit a sigmoidal behavior along the studied isobar, however, experiments showed an inflection point at a slightly lower temperature. Possible reasons for the difference between simulation and experimental results were thoroughly discussed.
An analysis of the shear viscosity of the mixture corroborated the strong influence of microheterogeneities given by hydrogen bonded networks on the macroscopic transport properties of the mixture.
Conflicts of interest
There are no conflicts to declare.Acknowledgements
All authors greatly acknowledge the support of Prof. Joachim Gross (University of Stuttgart) regarding the handling of the PCP-SAFT equation of state. The authors Y. G. and V. S. kindly appreciate financial support by the PRODEX program of the Belgian Federal Science Policy Office and the European Space Agency (ESA). The authors R. C., G. G.-C. and J. V. want to acknowledge the support by – Deutsche Forschungsgemeinschaft (DFG) under Grant No. VR 6/11. This work was carried out under the auspices of the Boltzmann-Zuse Society (BZS). Equilibrium molecular dynamics simulations were performed either on Cray's CS500 system Noctua at the Paderborn Center for Parallel Computing (PC2) or on the HPE Apollo system Hawk at the High Performance Computing Centre Stuttgart (HLRS) contributing to the project MMHBF2.Notes and references
- M. Mukhopadhyay, Natural extraction using supercritical carbon dioxide, CRC Press, 1st edn, 2000 Search PubMed.
- R. Gupta and J.-J. Shim, Solubility in supercritical carbon dioxide, CRC Press, 1st edn, 2007 Search PubMed.
- F. A. Gorelli, T. Bryk, M. Kirsch, G. Ruocco, M. Santoro and T. Scopigno, Sci. Rep., 2013, 3, 1203 CrossRef CAS.
- J. Losey and R. J. Sadus, J. Phys. Chem. B, 2019, 123, 8268–8273 CrossRef CAS.
- K. Karalis, C. Ludwig and B. Niceno, Sci. Rep., 2019, 9, 15731 CrossRef.
- Y. D. Fomin, V. N. Ryzhov, E. N. Tsiok and V. V. Brazhkin, Phys. Rev. E: Stat., Nonlinear, Soft Matter Phys., 2015, 91, 022111 CrossRef.
- A. Imre, G. Hazi, A. Horvath, C. Maraczy, V. Mazur and S. Artemenko, Nucl. Eng. Des., 2011, 241, 296–300 CrossRef CAS.
- A. Imre, C. Ramboz, U. Deiters and K. Kraska, Environ. Earth Sci., 2015, 73, 4373–4384 CrossRef CAS.
- M. Raju, D. T. Banuti, P. C. Ma and M. Ihme, Sci. Rep., 2017, 7, 3027 CrossRef.
- N. Polikhronidi, R. Batyrova, A. Aliev and I. Abdulagatov, J. Therm. Sci., 2019, 28, 394–430 CrossRef.
- P. Raveendran, Y. Ikushima and S. L. Wallen, Acc. Chem. Res., 2005, 38, 478–485 CrossRef CAS.
- T. Tassaing, P. Lalanne, S. Rey, F. Cansell and M. Besnard, Ind. Eng. Chem. Res., 2000, 39, 4470–4475 CrossRef CAS.
- I. Skarmoutsos and E. Guardia, J. Phys. Chem. B, 2009, 111, 8887–8897 CrossRef.
- K. Nishikawa and I. Tanaka, Chem. Phys. Lett., 1995, 244, 149–152 CrossRef CAS.
- H. Nakayama, K.-I. Saitow, M. Sakashita, K. Ishii and K. Nishikawa, Chem. Phys. Lett., 2000, 320, 323–327 CrossRef CAS.
- N. Nishikawa and T. Morita, Chem. Phys. Lett., 2000, 316, 238–242 CrossRef.
- G. G. Simeoni, T. Bryk, F. A. Gorelli, M. Kirsch, G. Ruocco, M. Santoro and T. Scopigno, Nat. Phys., 2010, 6, 503–507 Search PubMed.
- S. Hans and C. C. Yu, Phys. Rev. E: Stat., Nonlinear, Soft Matter Phys., 2012, 85, 051201 CrossRef.
- P. Gallo, D. Corradini and M. Rovere, Nat. Commun., 2014, 5, 5806 CrossRef CAS.
- M. Y. Ha, T. J. Yoon, T. Tlusty, Y. Jho and W. B. Lee, J. Phys. Chem. Lett., 2018, 9, 1734–1738 CrossRef CAS.
- M. Fisher and B. Widom, J. Chem. Phys., 1969, 50, 3756–3772 CrossRef CAS.
- V. Brazhkin, Y. Fomin, A. Lyapin, V. Ryzhov and K. Trachenko, Phys. Rev. E: Stat., Nonlinear, Soft Matter Phys., 2012, 85, 031203 CrossRef CAS.
- D. Bolmativ, M. Zhernenkov, D. Zav'yalov, S. Tkachev, A. Cunsolo and Y. Cai, Sci. Rep., 2015, 5, 15850 CrossRef.
- L. Xu, P. Kumar, S. Buldyrev, S.-H. Chen, P. Poole, F. Sciortino and H. Stanley, Proc. Natl. Acad. Sci. U. S. A., 2005, 102, 16558–16562 CrossRef CAS.
- D. Banuti, M. Raju and M. Ihme, J. Supercrit. Fluids, 2020, 165, 104895 CrossRef CAS.
- T. J. Yoon, M. Y. Ha, W. B. Lee and Y.-W. Lee, J. Chem. Phys., 2018, 149, 014502 CrossRef.
- T. J. Yoon, M. Y. Ha, W. B. Lee and Y.-W. Lee, J. Chem. Phys., 2019, 150, 154503 CrossRef.
- E. Mareev, V. Aleshkevich, F. Potemkin, V. Bagratashvili, N. Minaev and V. Gordienko, Opt. Express, 2018, 26, 13229–13238 CrossRef CAS.
- B. Chu, Ber. Bunsen-Ges., 1972, 76, 202–215 CAS.
- M. M. Hoffmann and M. S. Conradi, J. Phys. Chem. B, 1998, 102, 263–271 CrossRef CAS.
- M. Saharay and S. Balasubramanian, J. Phys. Chem. B, 2006, 110, 3782–3790 CrossRef CAS.
- W. Xu, J. Yang and Y. Hu, J. Phys. Chem. B, 2009, 113, 4781–4789 CrossRef CAS.
- T. Aida, T. Aizawa, M. Kanakubo and H. Nanjo, J. Phys. Chem. B, 2010, 114, 13628–13636 CrossRef CAS.
- B. A. McGuire, M.-A. Martin-Dumel and M. C. McCarthy, J. Phys. Chem. A, 2017, 121, 6283–6287 CrossRef CAS.
- Y. Gaponenko, V. Gousselnikov, C. I. A. V. Santos and V. Shevtsova, Microgravity Sci. Technol., 2019, 31, 475–486 CrossRef CAS.
- D. Mei, H. Li and W. Wang, Huagong Xuebao, 1995, 46, 357–364 CAS.
- C. Y. Kong, T. Funazukuri and S. Kagei, J. Supercrit. Fluids, 2006, 37, 359–366 CrossRef CAS.
- Y. Houndonougbo, K. Kuczera, B. Subramaniam and B. B. Laird, Mol. Simul., 2007, 33, 861–869 CrossRef CAS.
- L. Hui, W. Rui, F. Weiyu, L. Zhaomin, M. Tao and N. Guozhi, Acta Pet. Sin., 2015, 31, 78–83 Search PubMed.
- I. Skarmoutsos, E. Guardia and J. Samios, J. Chem. Phys., 2010, 133, 014504 CrossRef.
- W. Xu and J. Yang, J. Phys. Chem. A, 2010, 114, 5414–5428 CrossRef CAS.
- S. Reiser, N. McCann, M. Horsch and H. Hasse, J. Supercrit. Fluids, 2012, 68, 94–103 CrossRef CAS.
- Z. Li, S. Lai, W. Gao and L. Chen, Russ. J. Phys. Chem. A, 2018, 92, 1332–1337 CrossRef.
- T. Schnabel, J. Vrabec and H. Hasse, Fluid Phase Equilib., 2005, 223, 134–143 CrossRef.
- J. Vrabec, J. Stoll and H. Hasse, J. Phys. Chem. B, 2001, 105, 12126–12133 CrossRef CAS.
- K. Suzuki, H. Sue, M. Itou, R. L. Smith, H. Inomata, K. Arai and S. Saito, J. Chem. Eng. Data, 1990, 35, 63–66 CrossRef CAS.
- J. S. Lim, Y. Y. Lee and H. S. Chun, J. Supercrit. Fluids, 1994, 7, 219–230 CrossRef CAS.
- J. W. Ziegler, J. G. Dorsey, T. L. Chester and D. P. Innis, Anal. Chem., 1995, 67, 456–461 CrossRef CAS.
- L. A. Galicia-Luna, A. Ortega-Rodriguez and D. Richon, J. Chem. Eng. Data, 2000, 45, 265–271 CrossRef CAS.
- I. Tsivintzelis, D. Missopolinou, K. Kalogiannis and C. Panayiotou, Fluid Phase Equilib., 2004, 224, 89–96 CrossRef CAS.
- H.-Y. Chiu, M.-J. Lee and H.-M. Lin, J. Chem. Eng. Data, 2008, 53, 2393–2402 CrossRef CAS.
- C.-N. Han and C.-H. Kang, Korean J. Chem. Eng., 2017, 34, 1781–1785 CrossRef CAS.
- G. Soave, Chem. Eng. Sci., 1972, 27, 1197–1203 CrossRef CAS.
- D.-Y. Peng and D. P. Robinson, Ind. Eng. Chem. Fundam., 1976, 15, 59–64 CrossRef CAS.
- J. Gross and J. Vrabec, AIChE J., 2006, 52, 1194–1204 CrossRef CAS.
- D. W. Jennings, R. J. Lee and A. S. Teja, J. Chem. Eng. Data, 1991, 36, 303–307 CrossRef CAS.
- M. S. Green, J. Chem. Phys., 1954, 22, 398–414 CrossRef CAS.
- R. Kubo, J. Phys. Soc. Jpn., 1957, 12, 570–586 CrossRef.
- Y. M. Muñoz-Muñoz, G. Guevara-Carrion and J. Vrabec, J. Phys. Chem. B, 2018, 122, 8718–8729 CrossRef.
- I.-C. Yeh and G. Hummer, J. Phys. Chem. B, 2004, 108, 15873–15879 CrossRef CAS.
- S. H. Jamali, L. Wolff, T. M. Becker, A. Bardow, T. J. H. Vlugt and O. A. Moultos, J. Chem. Theory Comput., 2018, 14, 2667–2677 CrossRef CAS.
- P. Ganguly and N. F. A. van der Vegt, J. Chem. Theory Comput., 2013, 9, 1347–1355 CrossRef CAS.
- R. Fingerhut and J. Vrabec, Fluid Phase Equilib., 2019, 485, 270–281 CrossRef CAS.
- G. Rutkai, A. Köster, G. Guevara-Carrion, T. Janzen, M. Schappals, C. W. Glass, M. Bernreuther, A. Wafai, S. Stephan, M. Kohns, S. Reiser, S. Deublein, M. Horsch, H. Hasse and J. Vrabec, Comput. Phys. Commun., 2017, 221, 343–351 CrossRef CAS.
- S. Ancherbak, C. Santos, J. Legros, A. Mialdun and V. Shevtsova, Eur. Phys. J. E: Soft Matter Biol. Phys., 2016, 39, 111 CrossRef CAS.
- G. Guevara-Carrion, S. Ancherbak, A. Mialdun, J. Vrabec and V. Shevtsova, Sci. Rep., 2019, 9, 8466 CrossRef.
- R. Span and W. Wagner, J. Phys. Chem. Ref. Data, 1996, 25, 1509–1596 CrossRef CAS.
- K. W. Hutcheson and N. R. Foster, Innovations in Supercritical Fluids: Science and Technology, American Chemical Society, 1995 Search PubMed.
- S.-D. Yeo, S.-J. Park, J.-W. Kim and J.-C. Kim, J. Chem. Eng. Data, 2000, 45, 932–935 CrossRef CAS.
- J. A. Schroeder, S. G. Penoncello and J. S. Schroeder, J. Phys. Chem. Ref. Data, 2014, 43, 043102 CrossRef.
- C. Oldiges, K. Wittler, T. Tönsing and A. Alijah, J. Phys. Chem. A, 2002, 106, 7147–7154 CrossRef CAS.
- M. Požar, B. Lovrinčević, L. Zoranić, T. Primorać, F. Sokolić and A. Perera, Phys. Chem. Chem. Phys., 2016, 18, 23971–23979 RSC.
- R. Krishna and J. A. Wesselingh, Chem. Eng. Sci., 1997, 52, 861–911 CrossRef CAS.
- P. W. M. Rutten, Diffusion in liquids, Delft University Press, 1992 Search PubMed.
- H. Nishiumi and T. Kubota, Fluid Phase Equilib., 2007, 261, 146–151 CrossRef CAS.
- C. R. Wilke and P. Chang, AIChE J., 1955, 1, 264–270 CrossRef CAS.
- P. R. Sassiat, P. Mourier, M. H. Caude and R. H. Rosset, Anal. Chem., 1987, 59, 1164–1170 CrossRef CAS.
- M. T. Tyn and W. F. Calus, J. Chem. Eng. Data, 1975, 20, 106–109 CrossRef CAS.
- K. A. Reddy and L. K. Doraiswamy, Ind. Eng. Chem. Fundam., 1967, 6, 77–79 CrossRef CAS.
- C.-C. Lai and C.-S. Tan, Ind. Eng. Chem. Res., 1995, 34, 674–680 CrossRef CAS.
- O. J. Catchpole and M. B. King, Ind. Eng. Chem. Res., 1994, 33, 1828–1837 CrossRef CAS.
- C.-H. He and Y.-S. Yu, Ind. Eng. Chem. Res., 1998, 37, 3793–3798 CrossRef CAS.
- T. Funazukuri, C. Y. Kong and S. Kagei, Ind. End. Chem. Res., 2000, 39, 835–837 CrossRef CAS.
- A. Laesecke and C. D. Muzny, J. Phys. Chem. Ref. Data, 2017, 46, 013107 CrossRef.
Footnote |
| † Electronic supplementary information (ESI) available: It includes a schematic of the employed Taylor dispersion apparatus, graphical results for the enthalpy h, specific volume v, cp, cv, αv and βT, as well as the center-of-mass radial distribution function and average coordination number of the CO2–ethanol pair. Predictions of the Fick diffusion coefficient of the CO2 + ethanol mixture with the regarded equations are shown in comparison with experimental and simulation results. The numerical data from equilibrium molecular dynamics simulation are also listed. See DOI: 10.1039/d0cp04985a |
| This journal is © the Owner Societies 2021 |

