
Theoretical study on conformational energies of transition metal complexes†‡
Markus
Bursch
 *,
Andreas
Hansen
,
Philipp
Pracht
,
Julia T.
Kohn
and
Stefan
Grimme
*
*,
Andreas
Hansen
,
Philipp
Pracht
,
Julia T.
Kohn
and
Stefan
Grimme
*
Mulliken Center for Theoretical Chemistry, Universität Bonn, Beringstr. 4, 53115 Bonn, Germany. E-mail: grimme@thch.uni-bonn.de; Tel: +49 0228 732351
First published on 26th November 2020
Abstract
Conformational energies are an important chemical property for which a performance assessment of theoretical methods is mandatory. Existing benchmark sets are often limited to biochemical or main group element containing molecules, while organometallic systems are generally less studied. A key problem herein is to routinely generate conformers for these molecules due to their complexity and manifold of possible coordination patterns. In this study we used our recently published CREST protocol [Pracht et al., Phys. Chem. Chem. Phys., 2020, 22, 7169–7192] to generate conformer ensembles for a variety of 40 challenging transition metal containing molecules, which were then used to form a comprehensive conformational energy benchmark set termed TMCONF40. Several low-cost semiempirical, density functional theory (DFT) and force-field methods were compared to high level DLPNO-CCSD(T1) and double-hybrid DFT reference values. Close attention was paid to the energetic ordering of the conformers in the statistical evaluation. With respect to the double-hybrid references, both tested low-cost composite DFT methods produce high Pearson correlation coefficients of rp,mean,B97-3c//B97-3c = 0.922 and rp,mean,PBEh-3c//B97-3c = 0.890, with mean absolute deviations close to or below 1 kcal mol−1. This good performance also holds for a comparison to DLPNO-CCSD(T1) reference energies for a smaller subset termed TMCONF5. Based on DFT geometries, the GFNn-xTB methods yield reasonable Pearson correlation coefficients of rp,mean,GFN1-xTB//B97-3c = 0.617 (MADmean = 2.15 kcal mol−1) and rp,mean,GFN2-xTB//B97-3c = 0.567 (MADmean = 2.68 kcal mol−1), outperforming the widely used PMx methods on the TMCONF40 test set. Employing the low-cost composite DFT method B97-3c on GFN2-xTB geometries yields an slightly improved correlation of rp,mean,B97-3c//GFN2-xTB = 0.632. Furthermore, for 68% of the investigated complexes at least one low-energy conformer was found that is more stable than the respective crystal structure conformation, which signals the importance of conformational studies. General recommendations for the application of the CREST protocol and DFT methods for transition metal conformational energies are given.
1 Introduction
Transition metal (TM) complexes are an indispensable class of molecules, both in basic chemical research and in industrial and pharmaceutical chemistry.1–3 In addition, transition metal complexes are crucial for numerous biological processes.4,5 Accordingly, efforts to study this class of substances by means of quantum chemical methods are also great and more recent Kohn–Sham density functional theory (DFT)6–14 and modern wave function theory (WFT) based methods such as DLPNO-CCSD(T)15 have established themselves as reliable tools in computational organometallic chemistry.16–20 Unfortunately, such methods quickly reach their limits regarding the size of the systems to be investigated and even with more efficient low-cost composite methods like B97-3c6 or PBEh-3c,21 only systems with up to 500 atoms can routinely be studied. For larger systems significantly faster semiempirical quantum mechanical (SQM) (<5000 atoms) or force-field (FF) methods (>5000 atoms) are necessary. This is especially the case if complex reaction mechanisms are to be elucidated or a large number of conformers play a role. Contrary to the importance of TM complexes, many of these methods like DFTB,22–24 OMx25,26 or the prominent Amber,27 CHARMM,28 and OPLS29,30 force-fields are mostly limited to application to (bio-)organic systems, either conceptually or due to the lack of a comprehensive parameterization for the whole periodic table. For a long time the only notable exceptions were the well-known PMx31–34 methods and the general force-field UFF.35 More recently, the range of SQM and force-field methods with comprehensive parameterization for the 3–5d transition metals (and lanthanoids) has been extended by the GFNn-xTB36–39 and GFN-FF40 family of methods.Besides the sheer size of many real transition metal complexes, the amount of required calculations is often a limiting factor and decisive for sampling the relevant low-energy chemical space. A particularly important aspect here is the investigation of the conformational space, since a profound knowledge of the molecular conformation is mandatory for an accurate calculation of various molecular properties. Due to the manifold coordination patterns and electronic structures of transition metal complexes, automated conformer sampling is difficult and only a few approaches are available that can be applied almost generally.41–43 The most universal approach for the generation of conformers is the sampling based on molecular dynamics (MD) simulations employing FFs.44 However, most standard FFs are not parameterized for transition metals and therefore not applicable. Conformational sampling in an ab inito molecular dynamics (AIMD)45,46 approach (mostly at DFT/GGA level) solves the parameterization problem but becomes prohibitively expensive with increasing system size and simulation length. The question if very recent on-the-fly machine learning techniques can help to solve the problem in the future remains open.47,48 The here proposed usage of robust and fast semiempirical methods in combination with meta-dynamics (MTD) simulations provides a practical alternative (and significant acceleration) to the MD/AIMD approach.49
In this study the meta-dynamics based iMTD-GC algorithm, as implemented in the recently published CREST program,41 was used to routinely generate high quality conformer ensembles. CREST utilizes the GFNn-xTB family of methods to sample the potential energy surface (PES) on-the-fly and is designed to generate physically plausible conformers employing an (almost) black-box procedure. The second step after the conformer generation and optimization, the energetic (re)ranking of the conformers, is comparably crucial and time consuming with conventional quantum mechanical (QM) methods like DFT or DLPNO-CCSD(T). This is due to the typically large amount of considered structures and the individual size of the investigated molecules, and thus a sufficiently accurate energy pre-ranking using SQM methods is desirable in a multi-level approach.
A few conformational benchmark sets, such as the SCONF50 and UPU2351 subsets of the GMTKN55 database,52 or the recently published MPCONF19653 and PEPCONF54 sets are readily available for the evaluation of conformational energies. Even though the GFNn-xTB methods proved to yield reasonable conformational energies for (bio)organic molecules,41,55,56 the complexity of organometallic systems is much more challenging and far less data is available for the latter. Minenkov and co-workers showed that the prominent PMx methods are not reliably applicable to calculate conformational energies of transition metal complexes.57 Therefore, this work focuses on testing, if the GFNn-xTB methods can do better for conformational gas-phase energies of transition metal complexes. The goal is to compose a corresponding diverse benchmark dataset that serves as basis for future studies. In this context, the black-box conformer ensemble generation for this compound class using the CREST program was thoroughly tested and some recommendations for its reliable application to transition metal complexes are given. Moreover, the relation of crystal structure conformers to their gas-phase counterparts was investigated. Taking the crystal structure as basis for computational work is still common practice but may be questionable if different conformations are energetically clearly favored in different states (solid/liquid/gas).
2 Computational details
All quantum chemical and FF calculations were conducted with the TUBOMOLE 7.3.1,58 ORCA 4.2.1,59 xtb 6.3.1 and MOPAC201660 program packages. DFT geometry optimizations were performed with the B97-3c composite method as implemented in TURBOMOLE. All semiempirical geometry optimizations and energy calculations were carried out with the xtb program61 directly or as driver for MOPAC. Final DFT single-point energy calculations and fractional occupation density (FOD) analyses62,63 were conducted with ORCA applying TightSCF and Grid5/NoFinalGrid options. Except for the low-cost composite methods, the quadruple-ζ def2-QZVP64 basis set was used for all DFT calculations. The D414,65,66 London dispersion correction scheme (v2.5.0) was generally applied for the non-composite density functional approximation (DFA) calculations, except for MN15. The resolution-of-identity (RI) approximation67 for coulomb (RIJ) and exchange (RIJK) integrals was used in combination with matching auxiliary basis sets68,69 as implemented in TURBOMOLE and ORCA (def2/J, def2/JK options, def2-QZVPP/C70 for the MP2 correlation part) to speed up the DFT calculations. For elements with Z > 36, Stuttgart–Dresden effective core potentials (ECPs) were generally applied.71,72 DLPNO-CCSD(T1)106 calculations employed the def2-TZVPP and def2-QZVPP basis sets with VeryTightPNO settings.15,73,74 If applicable the complete basis set (CBS) extrapolation as suggested by Neese and Valeev was applied for the self-consistent field (SCF) and correlation energies.74 For fully automated conformer searches, GFN2-xTB was applied in conjunction with a development version (2.11) of the CREST program using the iMTD-GC algorithm.3 The TMCONF40 benchmark set
The benchmark set to study the performance of low-cost DFT and semiempirical GFNn-xTB methods for the calculation of conformational energies of transition metal complexes consists of 40 realistic closed-shell complexes obtained from the Cambridge Structural Database (CSD).75 The entries are denoted by their respective CSD identifier. Diverse coordination patterns, ligands and transition metals are included. Part of the set was adapted from the work of Minenkov et al.,57 even though five of the 27 complexes were excluded as qualitative FOD analysis indicated possible multi-reference character (see ESI‡) and thus no reliable reference data can be obtained in the framework of single-reference DFT and coupled cluster (CC) calculations used in this work. To ensure comprehensiveness of the benchmark, the remaining structure collection (22 molecules) was extended by 18 new complexes. The full collection of transition metal complexes is depicted in Fig. 1 and an overview of the involved elements in Fig. 2.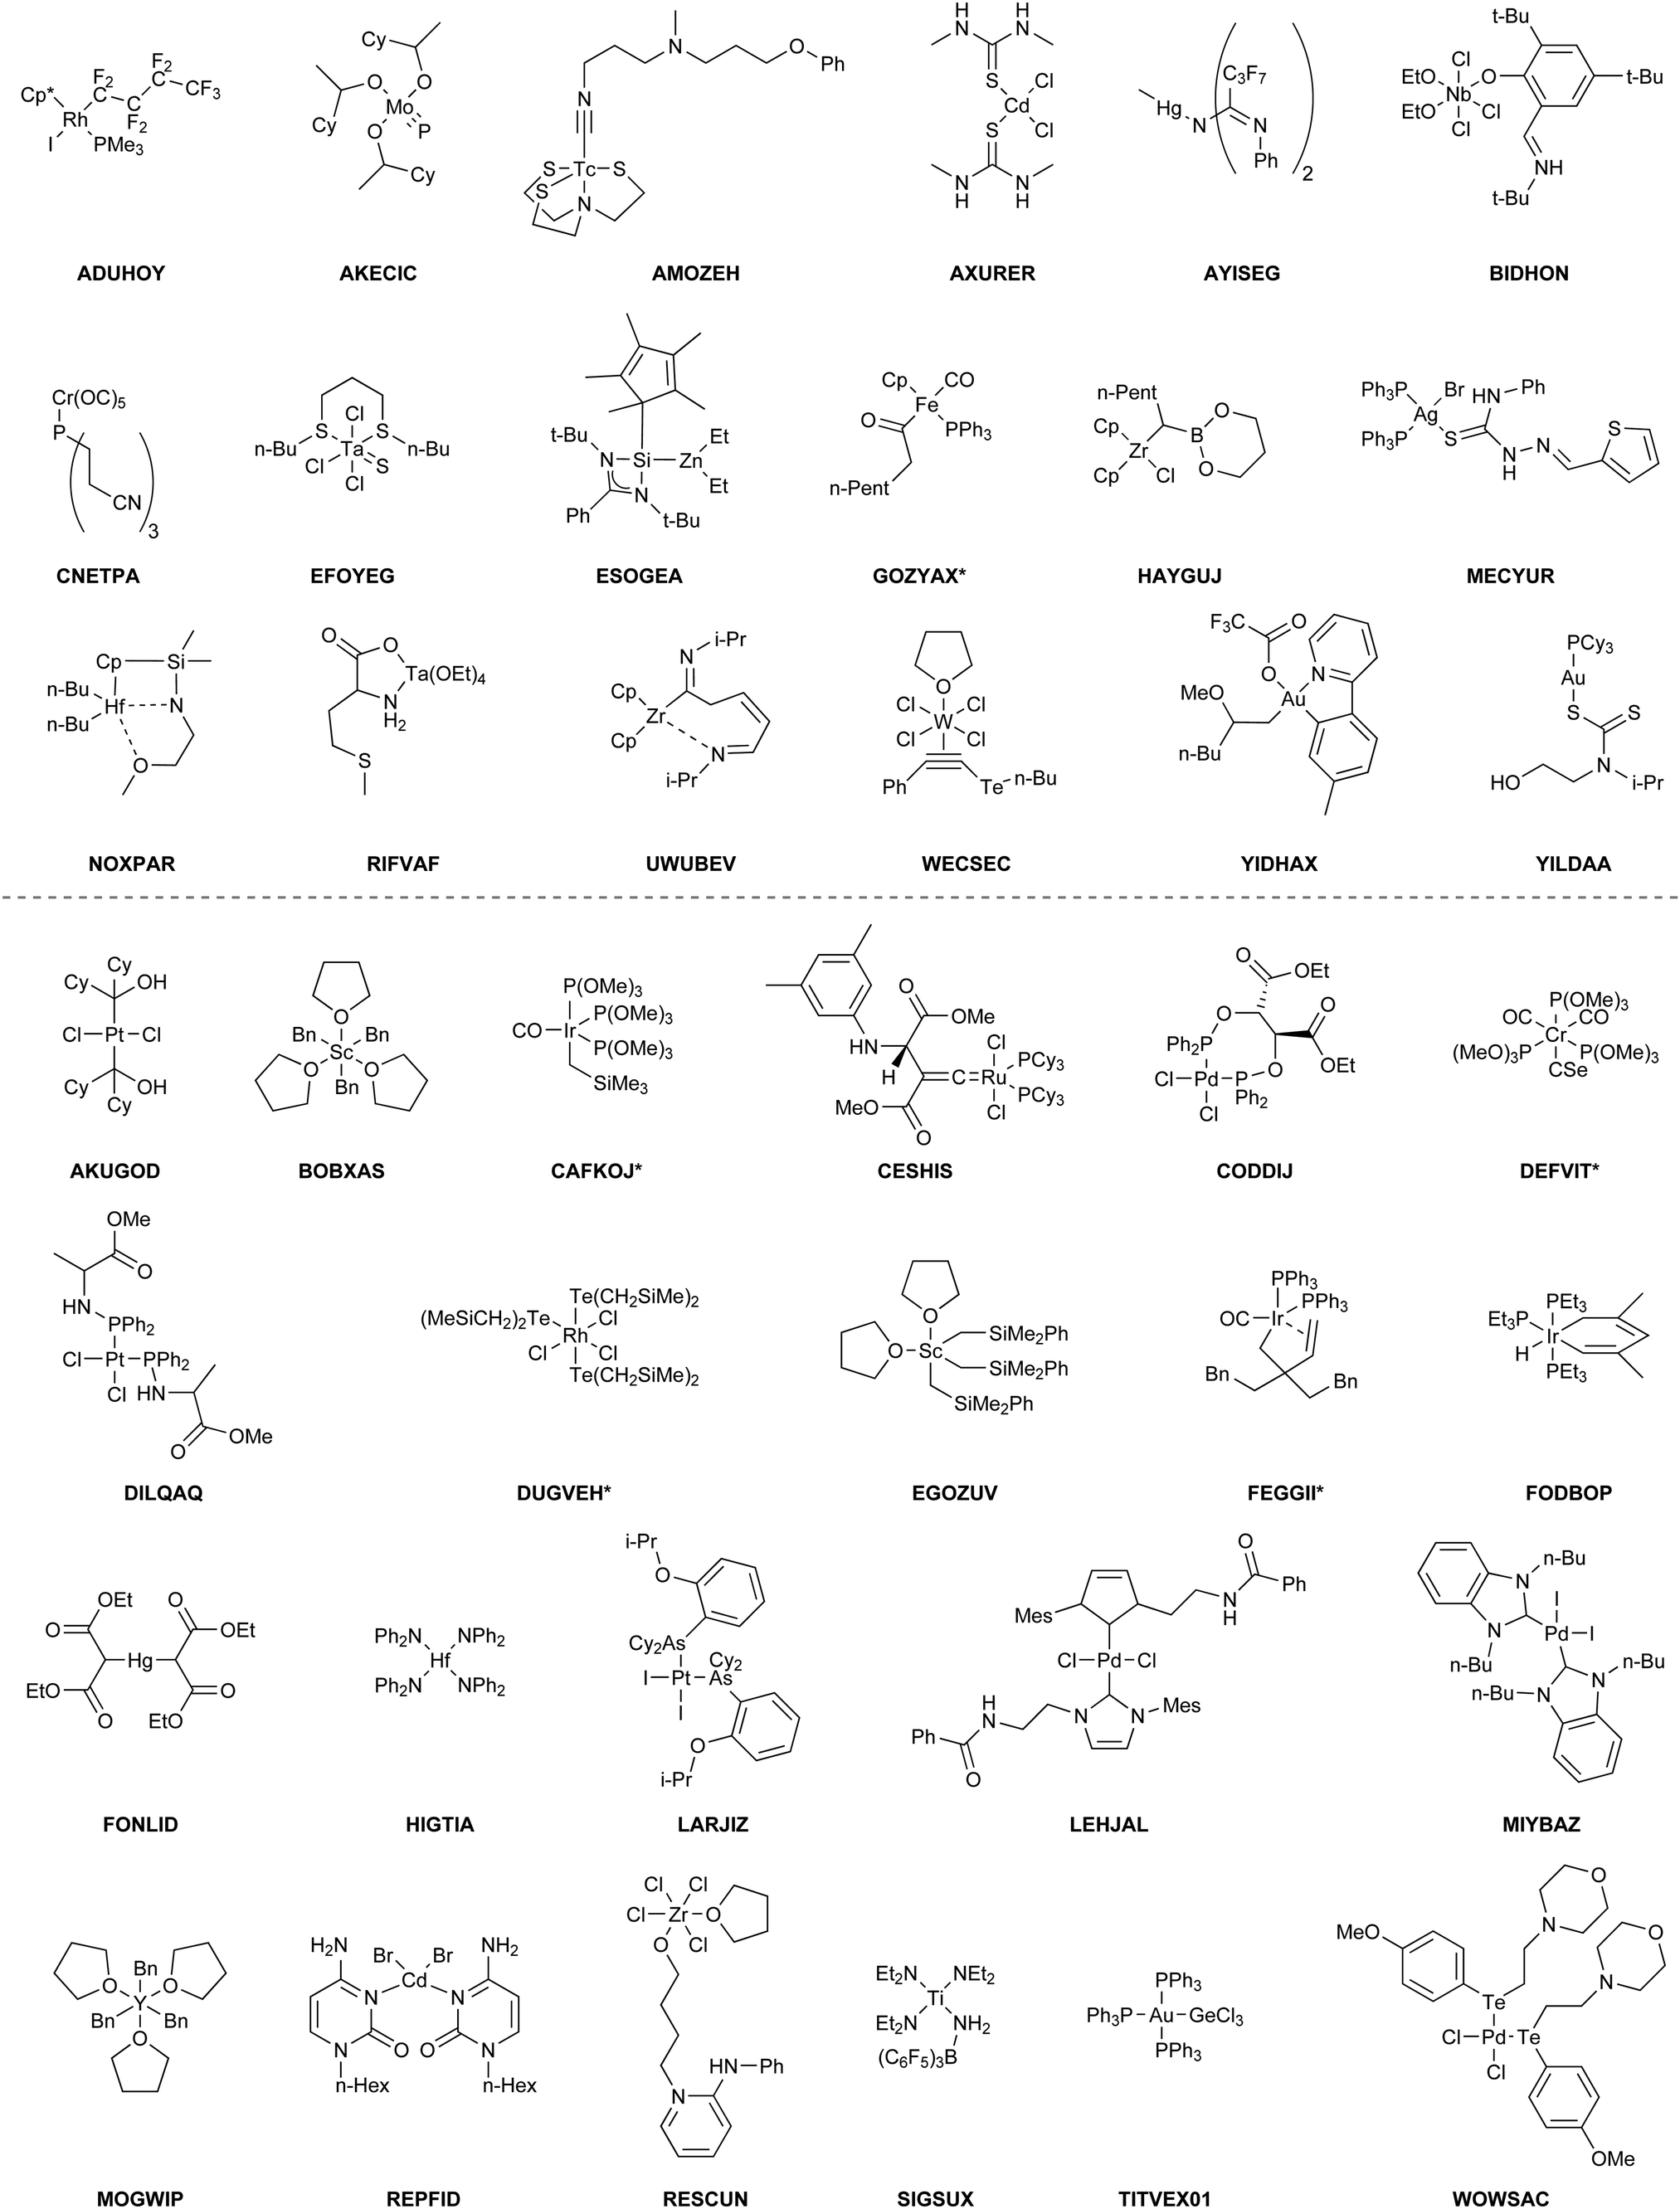 | ||
| Fig. 1 Structure collection forming the TMCONF40 benchmark set and the CSD identifiers of the original X-ray structure. Systems marked with an asterisk transformed chemically in the automated conformer search and thus, the transformed structure ensemble was used for evaluation. | ||
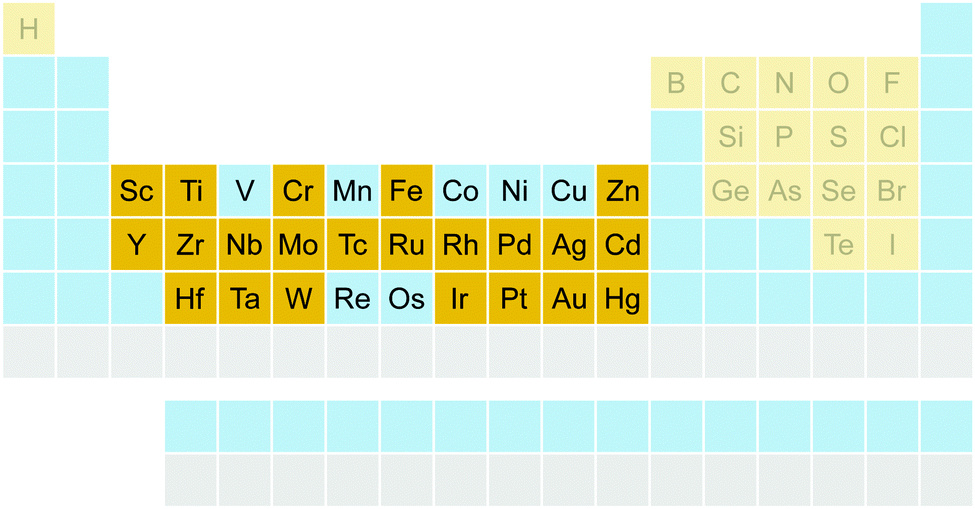 | ||
| Fig. 2 Elements included in the TMCONF40 benchmark set. Included elements are highlighted in yellow. Elements that are not available in the current parameterization of the GFNn-xTB methods are depicted in grey. | ||
For all 40 complexes a fully automated conformer search was conducted, applying GFN2-xTB and the default iMTD-GC algorithm as implemented in the CREST program. The resulting conformer ensembles (CE) were simplified in a clustering approach, utilizing a combined principle component analysis (PCA) dimensionality reduction76,77 and k-means clustering algorithm.78,79 The clustering approach based on PCAs with dihedral angles as conformation descriptor reduces the full CE to structurally comparable clusters in a clustered conformer ensemble (CCE) with a representative structure with low energy for each of the respective clusters. For each complex up to 30 of these representative conformers were selected resulting in overall 969 evaluated conformers. The clustering procedure further introduces a conformational energy range of up to 17 kcal mol−1 for systems with only small numbers of structurally distinct low energy conformer clusters. These structures included in the CCEs were then further optimized and re-ranked at the B97-3c level. Finally, high-level gas-phase conformational single point energies (SPE) were calculated at the double-hybrid PWPB95-D4/def2-QZVP11,64–66 level of theory. A schematic depiction of the generation workflow of the TMCONF40 is depicted in Fig. 3. The mean reference conformational energy (energy difference to the lowest-lying structure) is 3.53 kcal mol−1.
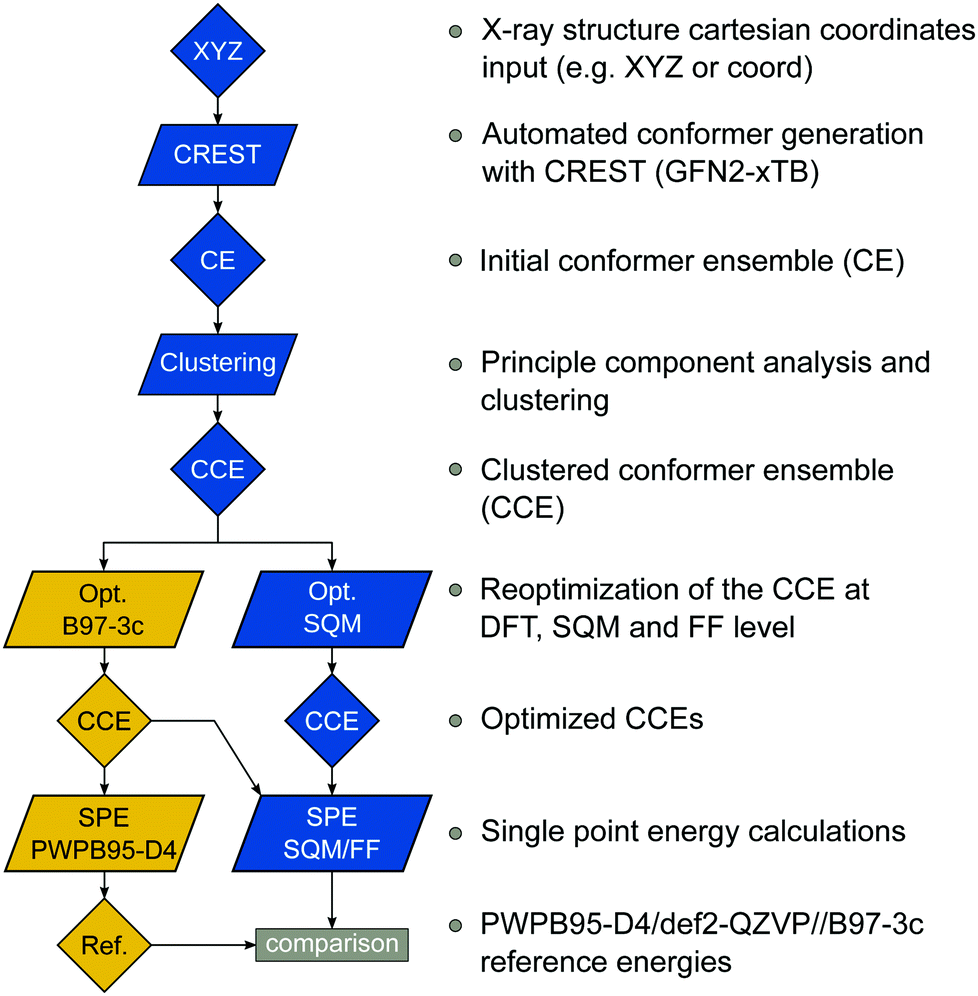 | ||
| Fig. 3 TMCONF40 testset generation procedure. All conformers were generated fully automatic at the SQM level using CREST prior to DFT based post-procession. | ||
3.1 Statistical measures
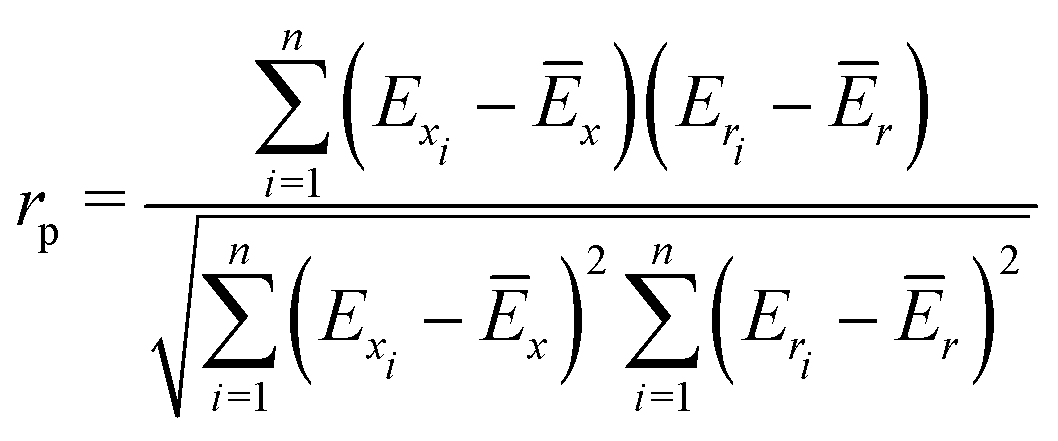
To quantify the performance of the tested methods, mainly three statistical criteria were applied: (i) mean absolute deviation (MAD) of the relative conformer energies, (ii) Pearson correlation coefficient of the conformer energies (rp, eqn (1)), and (iii) Spearman correlation coefficient of the conformer rankings (rs, eqn (2)). Both correlation coefficients are viable to elucidate the parallelism of PES.Pearson correlation coefficient (rp):
 | (1) |
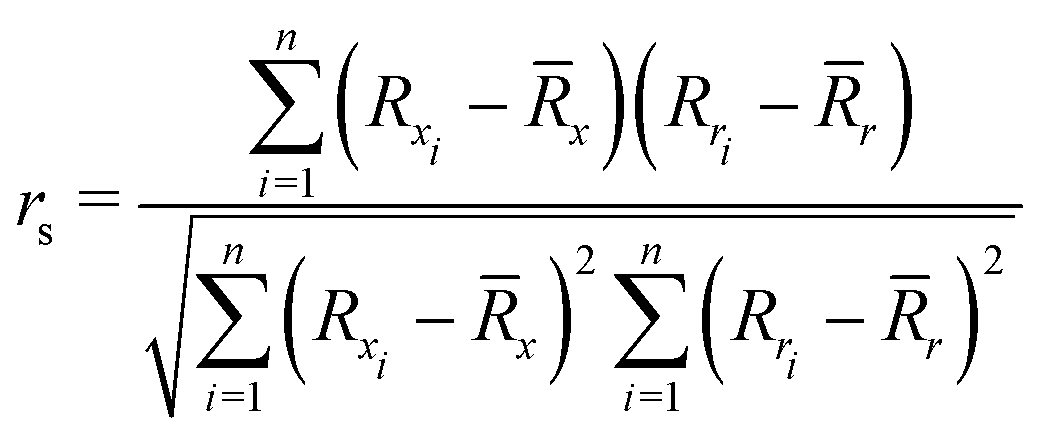 | (2) |
4 Results and discussion
4.1 Choice of DFT reference level
To justify the use of a DFT method to compute reference conformational energies for the TMCONF40 set and to choose the best candidate for this purpose, we conducted accurate energy calculations at DLPNO-CCSD(T1)/def2-TZVPP/VeryTightPNO level for the complex AYISEG and at DLPNO-CCSD(T1)/CBS(def2-TZVPP/def2-QZVPP)/VeryTightPNO level for AXURER, HAYGUJ, YIDHAX, and WECSEC with five conformers each and a mean conformational energy of 3.45 kcal mol−1. Due to the overall high number of investigated conformers in the TMCONF40 set and the size of the systems, a general calculation of conformational energies at a comparable level has been refrained from. Five London dispersion corrected DFAs and MN1580 that are known to perform well for thermochemistry of closed-shell transition metal complexes based on the results for the MOR41,81 WCCR1082 and TMC15183 benchmark sets were tested. The two smaller basis set composite-methods PBEh-3c and B97-3c were tested as well. The other investigated DFAs are the (range-separated) hybrid functionals PBE0-D4,65,84 ωB97X-V,9 ωB97M-V,10 as well as the PWPB95-D411 and B2PLYP-D485 double hybrid functionals86 in conjunction with the large quadruple-ζ basis set def2-QZVP.64 A general application of London dispersion corrections, e.g., the D387 or D465 scheme should be regarded as indispensable, as prior studies demonstrated their important role for transition metal chemistry14,81,88 and conformational energies in general.52 The performance of the tested methods for the subset termed TMCONF5 with respect to the DLPNO-CCSD(T1) reference data is depicted in Fig. 4 and Table 1. | ||
| Fig. 4 Conformer energy correlation diagrams for (a) AXURER, (b) AYISEG, (c) HAYGUJ, (d) WECSEC, and (e) YIDHAX relative to DLPNO-CCSD(T1)/CBS(def2-TZVPP/def2-QZVPP) (AXURER, YIDHAX, WECSEC, HAYGUJ) and DLPNO-CCSD(T1)/def2-TZVPP (AYISEG) conformational energies. (f) Mean MAD, Pearson (rr), and Spearman (rs) correlation coefficients for several DFAs applying the def2-QZVP basis set for the complete subset. The dashed lines indicate the DLPNO-CCSD(T1) reference conformational energies. The mean conformational energy is 3.45 kcal mol−1. The color code represents individual conformers CC-1 = black; CC-2 = blue; CC-3 = grey; CC-4 = yellow; CC-5 = green. | ||
| Method | MDmean | MADmean | r p,mean | r s,mean |
|---|---|---|---|---|
| PBEh-3c/B97-3c | −0.86 | 0.96 | 0.842 | 0.820 |
| B97-3c//B97-3c | −0.51 | 0.64 | 0.988 | 0.960 |
| PBE0-D4//B97-3c | −0.51 | 0.57 | 0.995 | 0.980 |
| MN15//B97-3c | −0.60 | 0.76 | 0.983 | 0.980 |
| ωB97X-V//B97-3c | −0.54 | 0.57 | 0.992 | 0.980 |
| ωB97M-V//B97-3c | −0.53 | 0.59 | 0.990 | 1.000 |
| PWPB95-D4//B97-3c | −0.51 | 0.55 | 0.996 | 1.000 |
| B2PLYP-D4/B97-3c | −0.40 | 0.46 | 0.994 | 1.000 |
| PM6//B97-3c | −7.49 | 8.73 | 0.033 | 0.080 |
| PM6-D3H4X//B97-3c | −7.57 | 8.87 | 0.046 | 0.120 |
| PM7//B97-3c | −2.66 | 3.40 | 0.356 | 0.380 |
| GFN2-xTB//B97-3c | −2.83 | 2.96 | 0.542 | 0.700 |
| GFN1-xTB//B97-3c | −1.25 | 2.46 | 0.758 | 0.780 |
| GFN-FF//B97-3c | −1.31 | 1.78 | 0.648 | 0.680 |
| UFF//B97-3c | 1.57 | 8.14 | 0.131 | 0.280 |
Overall, the tested hybrid and double-hybrid DFAs with a large AO basis set perform comparably well with small mean MADs between 0.4 and 0.6 kcal mol−1 and high mean Pearson (rp,mean) and Spearman (rs,mean) correlation coefficients above 0.990 and 0.960 (except for MN15 with MADmean = 0.76 kcal mol−1 and rp,mean = 0.983), respectively. B2PLYP-D4 yields the smallest mean MAD of 0.46 kcal mol−1 but comparably small Pearson correlation coefficient of rp,mean = 0.994 compared to PWPB95-D4. The best compromise of best possible mean correlation coefficients and mean MAD is provided by PWPB95-D4 with almost perfect correlation coefficients of rp,mean = 0.996 and rs,mean = 1.000, as well as a small mean MAD of 0.55 kcal mol−1.
The low-cost composite method B97-3c performs comparably well with only slightly worse correlation coefficients of rp,mean = 0.988, rs,mean = 0.960. PBEh-3c, which by construction employs the small def2-mSVP basis set and a high amount of Fock exchange (42%), not unexpectedly performs worst with a comparably high mean MAD of 0.96 kcal mol−1 and lower rp,mean = 0.842, rs,mean = 0.820. At this point it should be noted, that due to the small number of conformers per system included in the subset, deviations in the Spearman correlation coefficient should not be overinterpreted. Based on these results and the experience from other benchmark studies mentioned vide supra, where good double-hybrid functionals typically outperform range-separated hybrid functionals upon comparison to CBS extrapolated DLPNO-CCSD(T1) reference data, PWPB95-D4 was selected as DFT based reference for testing low-cost methods on the full benchmark set. Thus, the PWPB95-D4/def2-QZVP reference values are expected to be sufficiently accurate to evaluate the performance of several magnitudes faster semiempirical and force-field methods.
4.2 Benchmark study of low-cost methods
The performance of several low-cost DFT, SQM and FF methods and their combinations for calculation of conformational energies was evaluated on the full TMCONF40 benchmark set. These method combinations include, single point energies (SPE) calculated on the B97-3c geometries for all tested methods, as well as combinations of SPEs calculated on SQM or force-field geometries with focus on the GFN-xTB/FF method family (see Fig. 5 and Table 2). In general, a successful application of a multi-level Ansatz, combining two different PESs for energy calculation and geometry optimization, requires sufficient parallelism of both. Therefore, a thorough evaluation of such method combinations is of interest. The calculation of high-level SPEs on lower level structures (e.g., WFT energies for DFT structures) is standard practice in computational chemistry because computation times can be reduced strongly.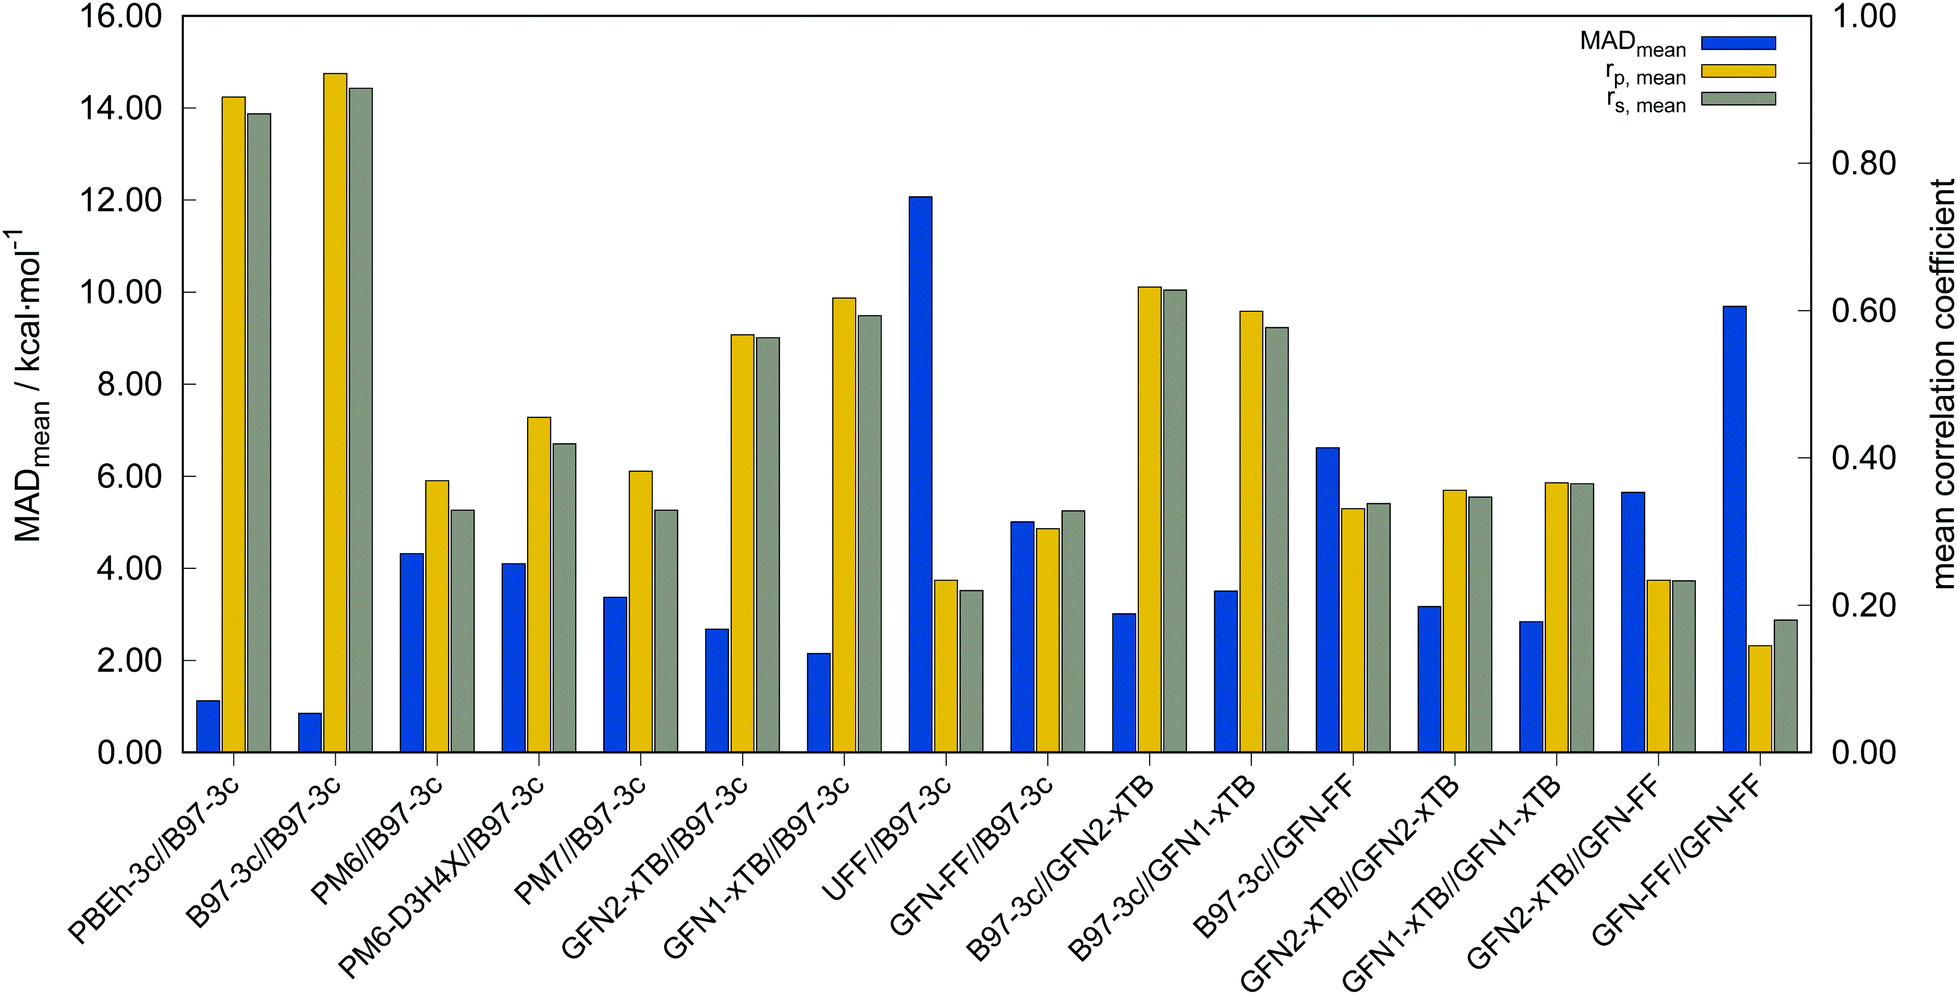 | ||
| Fig. 5 Mean absolute deviation (MADmean), mean Pearson (rp,mean), and Spearman (rs,mean) correlation coefficients for all tested method combinations with reference to PWPB95-D4/def2-QZVP//B97-3c results. The methods are sorted by descending computational cost. | ||
| Method | MDmean | MADmean | r p,mean | r s,mean |
|---|---|---|---|---|
| PBEh-3c//B97-3c | −0.11 | 1.12 | 0.890 | 0.867 |
| B97-3c//B97-3c | −0.33 | 0.85 | 0.922 | 0.902 |
| PM6//B97-3c | −0.57 | 4.32 | 0.369 | 0.329 |
| PM6-D3H4X//B97-3c | −0.12 | 4.10 | 0.455 | 0.419 |
| PM7//B97-3c | −1.17 | 3.37 | 0.382 | 0.329 |
| GFN2-xTB//B97-3c | −2.30 | 2.68 | 0.567 | 0.563 |
| GFN1-xTB//B97-3c | −1.73 | 2.15 | 0.617 | 0.593 |
| UFF//B97-3c | 0.90 | 12.07 | 0.234 | 0.220 |
| GFN-FF//B97-3c | −0.46 | 5.01 | 0.304 | 0.328 |
| B97-3c//GFN2-xTB | −0.36 | 3.01 | 0.632 | 0.628 |
| B97-3c//GFN1-xTB | −1.47 | 3.51 | 0.599 | 0.577 |
| B97-3c//GFN-FF | 0.80 | 6.62 | 0.331 | 0.338 |
| GFN2-xTB//GFN2-xTB | −2.79 | 3.17 | 0.356 | 0.347 |
| GFN1-xTB//GFN1-xTB | −2.44 | 2.84 | 0.366 | 0.365 |
| GFN2-xTB//GFN-FF | −0.74 | 5.65 | 0.234 | 0.233 |
| GFN-FF//GFN-FF | −0.89 | 9.69 | 0.145 | 0.180 |
In the following, these method combinations are labeled as “SPE//geometry” with “SPE” being the energy calculation method and “geometry” being the method applied for geometry optimization. Only mean correlation coefficients and MAD over all systems are discussed in the following. First of all, both tested low-cost composite DFT methods, B97-3c//B97-3c and PBEh-3c//B97-3c yield satisfactory (>0.85) mean correlation coefficients of rp,B97-3c//B97-3c = 0.922, rs,B97-3c//B97-3c = 0.902 and rp,PBEh-3c//B97-3c = 0.890, rs,PBEh-3c//B97-3c = 0.867. Further, both yield relatively small mean MAD of MADB97-3c//B97-3c = 0.85 and MADPBEh-3c//B97-3c = 1.12 kcal mol−1, respectively. With average errors in the sub-kcal mol−1 range with reference to the much more costly double-hybrid PWPB95-D4, B97-3c provides an excellent cost-to-accuracy ratio. Considering the comparably high correlation coefficients, B97-3c and PBEh-3c are suitable for (at least preliminary) energetic sorting of most closed-shell transition metal complex conformers (see below).
For SPEs calculated with SQM methods, as well as GFN-FF, on B97-3c geometries much smaller correlation coefficients are obtained. Here, GFN1-xTB//B97-3c performs best with rp = 0.617, closely followed by GFN2-xTB//B97-3c (rp = 0.567). The slightly poorer performance of the physically more sophisticated GFN2-xTB method compared to its predecessor GFN1-xTB is unusual but is probably statistically insignificant. The PMx methods perform worse yielding mean correlation coefficients between rp = 0.369 to 0.455 which is slightly better than the results for (the orders of magnitude faster) GFN-FF (rp,GFN-FF//B97-3c = 0.304; MAD = 5.01 kcal mol−1). The only generally applicable competing force-field UFF yields a very low correlation coefficient of rp,UFF//B97-3c = 0.234 and a very high mean MAD of 12.07 kcal mol−1. The results for the PMx methods are in line with those reported by Minenkov et al.,57 although it must be noted that the latter were obtained for a much smaller number of conformers and less accurate reference values.
Calculation of DFT, e.g., B97-3c, SPEs on SQM or FF geometries represents a possible step for further increasing the efficiency of conformer search procedures because the costly DFT geometry optimization may be replaced by a much faster SQM or FF one (Fig. 6). If the low-level method structure is reasonable, even the very costly Hessian calculations for thermostatistical free energy corrections can be conducted efficiently as recently shown for large supramolecular complexes.89
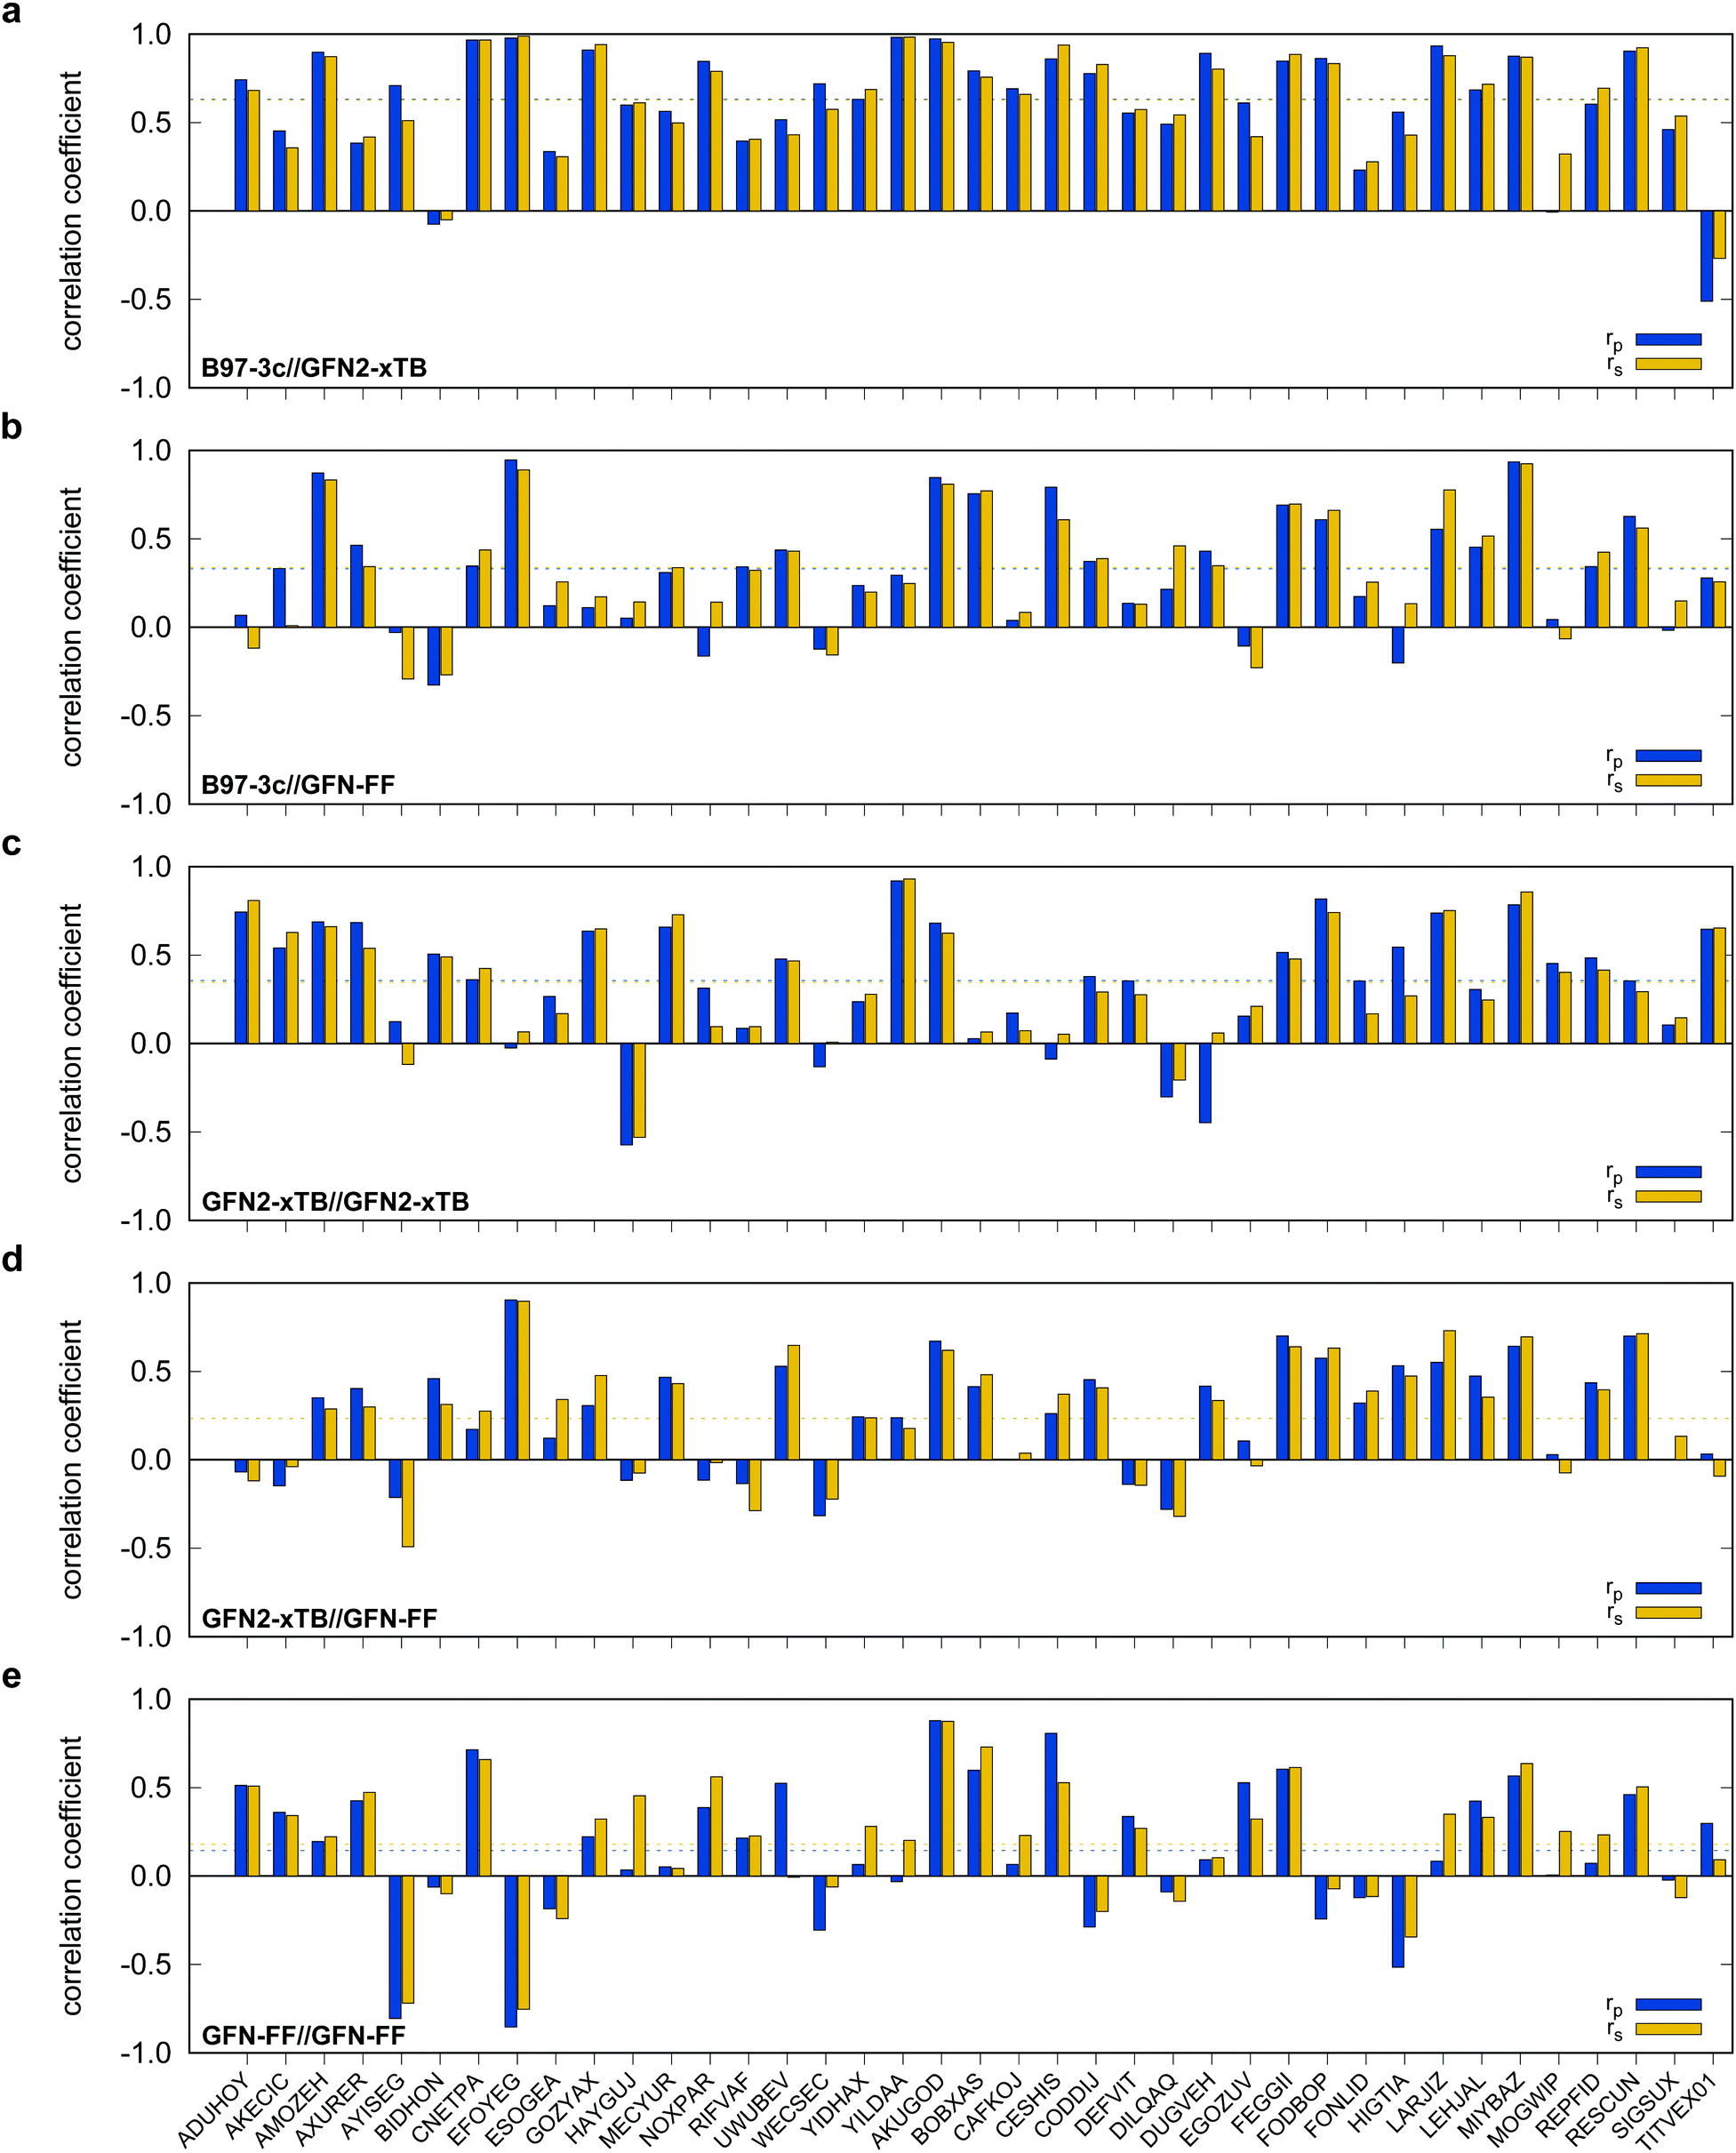 | ||
| Fig. 6 Individual Pearson (rp) and Spearman (rs) correlation coefficients for (a) B97-3c//GFN2-xTB, (b) B97-3c//GFN-FF, (c) GFN2-xTB//GFN2-xTB, (d) GFN2-xTB//GFN-FF, and (e) GFN-FF//GFN-FF with reference to PWPB95-D4/def2-QZVP//B97-3c results. Dashed lines show the average values. | ||
For these method combinations, at least semi-qualitatively correct conformational energies are required since they may be used as the basis for pre-selections. Therefore, in Fig. 6 method combinations with high average correlation coefficients and very few outliers (correlation < 0.0, anti-correlation) are to be preferred.
B97-3c SPEs calculated on GFN2-, GFN1-xTB and GFN-FF geometries yield mean correlation coefficients of rp,B97-3c//GFN2-xTB = 0.632, rp,B97-3c//GFN1-xTB = 0.599, and rp,B97-3c//GFN-FF = 0.331, respectively. These results are in between those for GFNn-xTB//B97-3c and B97-3c//B97-3c. Calculating the geometry and the SPE purely at SQM and/or FF level further significantly decreases the correlation with the double-hybrid reference method (cf.Table 2). For a given geometry, i.e., SPEs for the SQM methods on B97-3c geometries, GFNn-xTB methods clearly outperform their PMx competitors, even though they still perform worse than the two low-cost composite DFAs.
Errors for GFNn-xTB increase slightly if the geometries are also optimized at the respective level, but trends of the performances are maintained. The comparably low average correlation coefficients (<0.4) and the error increase due to geometry optimizations at SQM level indicate non-parallel PES. This results in partially large deviations between the B97-3c and the GFN2-xTB structures and thus hardly comparable energy calculations. In such cases both errors, the decreased accuracy of the SQM energy calculation, and the difference in geometry, accumulate, resulting in worse performance compared to e.g. B97-3c//GFN2-xTB. Nevertheless, previous studies90 showed that the GFN methods provide mostly good geometries of transition metal complexes and high robustness of the respective calculations compared to other SQM methods. Considering the results discussed in this section, there seems to be an obvious discrepancy between the quality of the structure and its energy at the SQM level. Regarding the mean reference conformational energy of only 3.53 kcal mol−1, a relatively poor performance of the SQM and FF methods may be expected.
Possibly increasing errors upon descending the periodic table due to shortcomings of the use of effective core potentials91–93 to implicitly cover relativistic effects, were not observed. For all method combinations discussed in Fig. 6, the overall mean Pearson coefficients amount to 0.320 for the 3d, 0.360 for the 4d, and 0.339 for the 5d transition metals. The comparably lower mean Pearson coefficient for the 5d row mainly results from the generally bad performance of most combinations for BIDHON. As discussed in Section 4.1 (Fig. 4), even sophisticated DFAs with very large basis sets yield residual mean MAD of around 0.5 kcal mol−1 for the small subset. This is a further indication that the electronically complicated structures require a high theoretical level for the correct description of conformational energies. All tested SQM and FF methods should only be used with great care (i.e., with a large energy selection window in filtering steps, see below) for energetic ranking of conformational energies of transition metal complexes. They may be used for initial pre-sorting to exclude very high energy conformers and to reduce the investigated conformational space, but for further refinement a combination with more sophisticated methods, e.g., B97-3c, is strongly advisable. In fact this holds to a weaker extend already for conformational energies of larger organic molecules regarding this very difficult chemical property. Furthermore, energy thresholds for successive conformer post-processing at higher theoretical levels should be chosen more conservatively (i.e., larger), compared to those applied for purely organic systems to account for non-parallel PES. Depending on the system a factor of two to three proved reliable. The calculation of SPEs with B97-3c on GFN2-xTB geometries is particularly promising. B97-3c//GFN2-xTB yields reasonable results and only a very small number of outliers w.r.t. energetic ordering (cf.Fig. 6a; BIDHON, MOGWIP, TITVEX). Such an approach is still much cheaper than the full B97-3c geometry optimization (few minutes vs. several hours). In general, the quality of a method for the conformer generation and the final refinement should also be judged with respect to its applicability.
4.3 Difference between gas-phase and crystal structure
It has previously been noted that conformations can significantly differ between the gas-phase and the crystal structure.41,94,95 The practical problem in this context is the very limited availability of the gas-phase conformers from experimental data. Experimental techniques for the determination of gas-phase conformers for example include rotational and vibrational spectroscopy,96,97 or more specialized methods such as gas-phase electron diffraction,95,98 but all of them are usually limited to small molecules. Crystal structures from X-ray diffraction experiments, on the other hand, are readily available even for large and complicated systems and have become the de facto standard for structure determination. However, for computational work it is essential to investigate the molecular conformation in the actual state, i.e., typically solution or the gas-phase. Because energy differences between low-energy conformers can reach several kcal mol−1, finding the optimum conformer is necessary, e.g., for in silico design of catalytic cycles, thermochemical properties,99,100 or the prediction of spectra.101,102Here we compare the optimized crystal structure conformer directly to the calculated minimum energy conformation found in a CREST run. Both, the total energy difference and the heavy atom root-mean-square-deviation (RMSD)103 of the atomic Cartesian coordinates are used to analyze differences between the conformers. Importantly, for 68% of the investigated complexes at least one conformer lower in energy than the respective crystal structure conformation was found. In five cases (FEGGII, DUGVEH, DEFVIT, CAFKOJ, GOZYAX) the automated conformer search based on GFN2-xTB yields mainly chemically tranformed structures, i.e., no energetically lower conformers but a new conformer ensemble of the transformed structure (Fig. 7). This problem is mainly observed for carbonyl ligands and may be avoided by application of GFN-FF for the automated structure generation, because by construction new covalent bonds can not be formed at the force-field level.
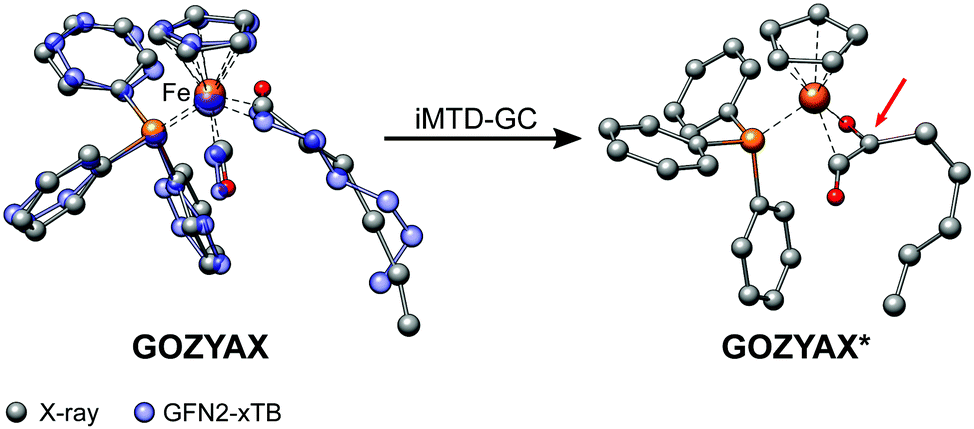 | ||
| Fig. 7 Artificial chemical transformation of GOZYAX to GOZYAX* during the iMTD-GC procedure. The GFN2-xTB correctly optimized X-ray structure cutout is depicted in transparent blue for comparison. | ||
Despite their mediocre performance for the energetic ranking of conformers, the GFNn-xTB/FF methods generally proved to be well suited for the generation of transition metal complex conformer ensembles. The reason for this is an at least qualitatively correct description of the intramolecular forces within the molecules and the moderate performance for structural parameters.90
Differences between conformations in different phases are most likely the result of preferred intermolecular non-covalent interactions in the solid phase (packing effects) opposed to the gas-phase (or solution). Fig. 8 shows an example in which non-covalent interactions in the crystal strongly influence the preferred conformation.
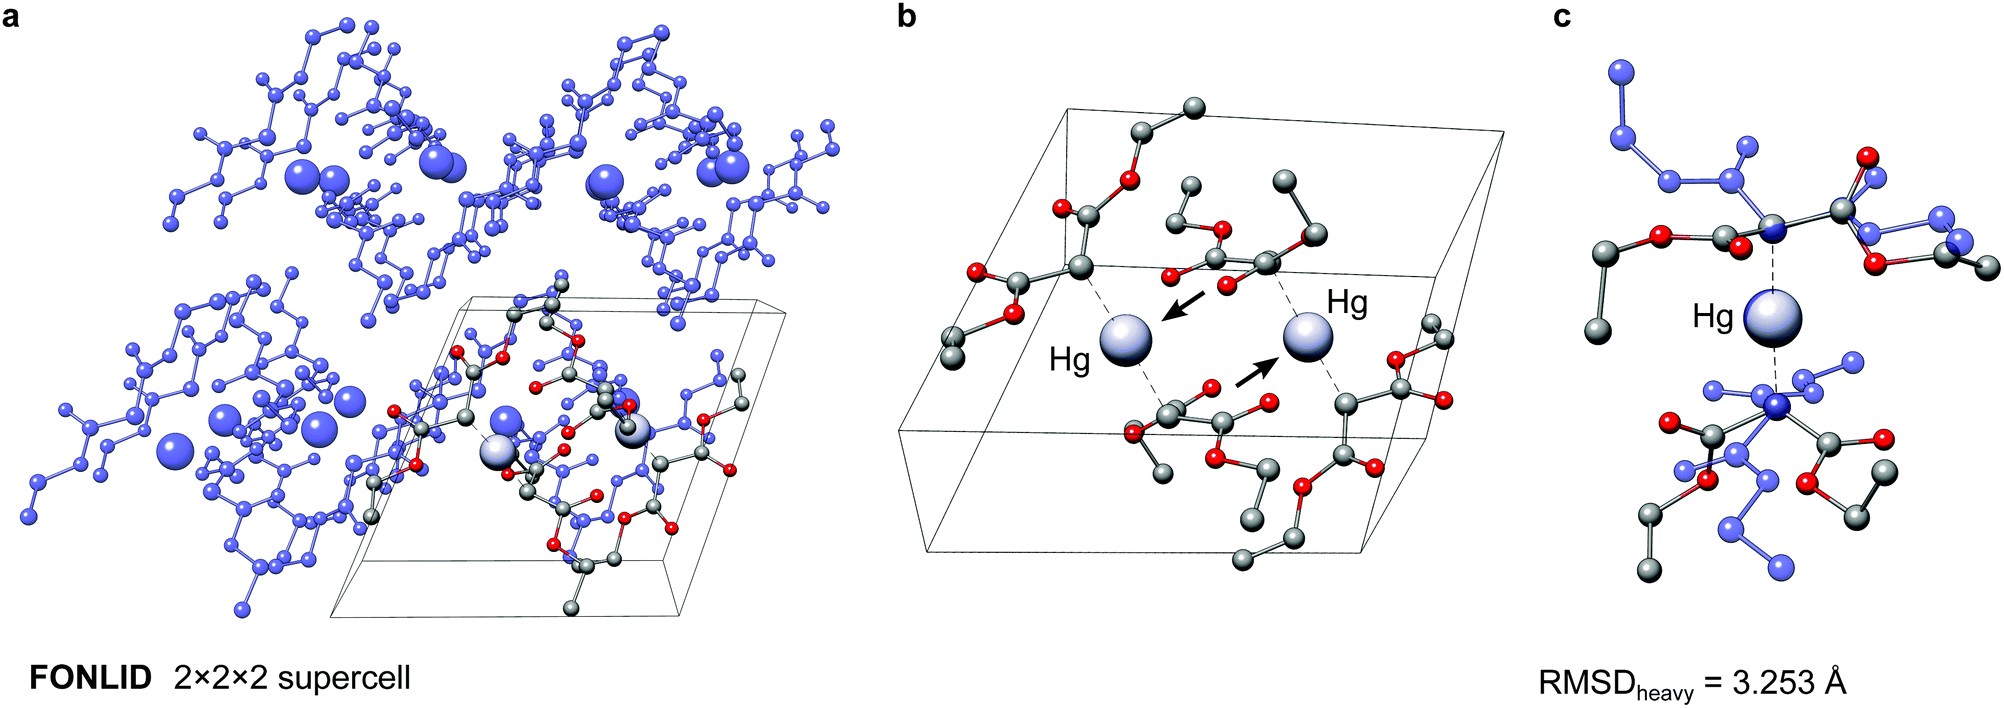 | ||
| Fig. 8 The FONLID structure. (a) 2 × 2 × 2 supercell (b) unit cell (c) overlay between the crystal structure (transparent blue) and gas-phase (solid color) conformer of the FONLID monomer. Hydrogen atoms are omitted for clarity. | ||
The here depicted bis(diethyl malonate)-mercury(II) complex (FONLID) is characterized by a S-shaped non-covalent bonding pattern in the solid phase, which can be seen in a 2 × 2 × 2 supercell (Fig. 8a). Formation of this non-covalent network is enabled by the pairwise coordination of a malonate group to the neighbouring monomers metal center via the dicarboxylic oxygen atoms. This can easily be observed already for the two monomers contained in the crystal structure unit cell, where the pairwise coordination is indicated by the black arrows in Fig. 8b. Each of the FONLID monomers is coordinated by two other monomers in this way, which strongly influences the molecular geometry. In the gas-phase, however, both diethyl malonate groups can freely move in the isolated monomer. During the conformational search this mainly leads to changes in the relative orientation of the two malonate groups relative to each other. At the PWPB95-D4/def2-QZVP//B97-3c level the most stable gas-phase conformer is favored by −1.03 kcal mol−1 over the reoptimized crystal structure monomer. With a heavy atom RMSD (RMSDheavy) of 3.25 Å the two conformers show large structural differences. An overlay of the two structures can be seen in Fig. 8c.
As a second example the YIDHAX molecule is shown in Fig. 9. In this structure the monomers align along the crystallographic a-axis and form π-bonded columns, as can be seen in Fig. 9a. This leads to a parallel alignment of the 2-methoxyhexyl ligands between neighbouring YIDHAX monomers. From the overlay of the crystal structure monomer and the most stable gas-phase conformer in Fig. 9b large structural changes (mainly for the 2-methoxyhexyl ligand) become apparent, which result in a sizeable RMSDheavy of 2.65 Å. The gas-phase conformer of YIDHAX is more stable than the reoptimized crystal structure monomer by −0.94 kcal mol−1. The two examples FONLID and YIDHAX demonstrate that structural changes between the gas-phase and the crystal structure may be attributed to well-defined non-covalent interactions. However, the entirety of packing effects is typically very complicated in the crystal structure and molecular conformations should generally be investigated at the beginning of a computational project referring to the gas-phase or solution.
 | ||
| Fig. 9 The YIDHAX structure. (a) 3 × 1 × 1 supercell (b) overlay between the crystal structure (transparent blue) and gas-phase (solid color) conformer of the YIDHAX monomer. Hydrogen atoms are omitted for clarity. | ||
5 Recommendations for CREST
Based on this study showing that the GFNn-xTB/FF methods can routinely be applied for conformer generation of transition metal complexes, some recommendations for applying the iMTD-GC algorithm in CREST for fully automated conformer search and subsequent conformer ensemble reranking with e.g. ENSO104 for organometallic complexes can be made:• During long meta-dynamics simulations in CREST, the RMSD bias potential might add up too strongly and lead to bond dissociation or chemical transformations as shown in Fig. 7. To remedy this problem additional bond constraints can be applied in the conformational search with the -cbonds or -cmetal keywords. A default force constant of 0.02 Eh is used for the bond constraints, but can manually be increased for critical cases.
• With an increasing level of electronic complexity it becomes more difficult to pre-select the correct structures at a cheap SQM/DFT level. To ensure a correct pre-processing very conservative sorting criteria should be chosen for the energetic ranking thresholds in post-processing programs like ENSO. An increase of typical default values between 2.0 and 4.0 kcal mol−1 by a factor of 2–3 should be considered.
• For very fast conformer ensemble sampling, the general force-field GFN-FF may be applied. Here, the additional bond constraint options are applied by default to avoid dissociation in the meta-dynamics simulations. A further increase in the iMTD-GC energy windows may be necessary, typically from the default of 6.0 to 10.0 kcal mol−1.
• B97-3c//GFNn-xTB may be applied as an intermediate energy screening level, drastically reducing the number of considered conformers in further optimizations.
Note, that even though the convenient, fully automatic conformer ensemble generation can be applied almost black-box in this way, for complex molecules with challenging electronic structures the obtained results should be analyzed carefully by an experienced computational chemist.
6 Conclusion and outlook
Accurate conformational energies are very important for the correct description of molecular systems in various areas of chemistry. Many conformer benchmarks are available for mostly organic systems, but only very few studies of organometallic conformational energies exist. One reason for this is the lack of conformer generation methods that are able to routinely handle transition metal containing systems. In this study we composed a benchmark set of 40 organometallic molecules to investigate the performance of low-cost composite DFT and SQM methods for this problem. Conformers for the 40 molecules were automatically generated using the recently published iMTD-GC workflow with crystal structure geometries as input, i.e., all studied systems are chemically existing and relevant. Up to 30 conformers were selected for each of the complexes, leading to overall 969 conformational energies for the benchmark termed TMCONF40.Besides errors for relative energies, two correlation coefficients (Pearson, Spearman) were used in the evaluation as a measure for parallelism between different potential energy surfaces. In a first step, several composite, hybrid and double-hybrid DFAs were investigated on a small subset of TMCONF40 in comparison to high level DLPNO-CCSD(T1) values. Based on these results the PWPB95-D4/def2-QZVP level was chosen as the theoretical reference for the full set. Here, several combinations of low-cost composite DFAs, SQM methods and generic FFs were tested. Overall, SQM methods perform worse than low-cost DFAs for the conformational energies, which is consistent with findings from other benchmark studies for organic systems. Within the SQM class, GFNn-xTB methods in general outperform the PMx methods. The combination of SQM derived geometries with efficient composite DFAs like B97-3c (B97-3c//GFN2-xTB) yields reasonable conformational energies and is recommended for first steps in multi-level procedures. The automated conformer generation within the CREST program, which is done at the GFNn-xTB/FF level, proved to reliably yield low-energy conformers in a black-box approach despite the only mediocre performance for conformational energies. However, some transition metal complexes require an adjusted technical setup in CREST due to their complicated coordination patterns.
A chemically important result of our study is, that experimental solid state conformers provided by X-ray diffraction in probably many cases do not correspond to the lowest energy structure in gas-phase (and likely also not to the solution structure). Thus, application of automated procedures like the one proposed here in addition to automated post-processing tools like ENSO (for which an updated version will be made available soon) are strongly recommended.
The electronic complexity of transition metal complexes remains challenging, especially for semiempirical and force-field methods, even though recent developments like the GFNn-xTB/FF methods are promising. This complexity of transition metal complexes generally renders the careful analysis by experienced scientists indispensable. This not only holds for SQM or FF methods, but also for DFT and wave function theory based methods. Further development, e.g., in the direction of ligand field molecular mechanics (LFMM)105 based on available composite DFT and SQM/FF methods, may further increase the reliability of automated workflows also for TM complexes. The TMCONF40 benchmark set represents a valuable tool for the evaluation of such further developments in the future.
Conflicts of interest
There are no conflicts to declare.Acknowledgements
This work was supported by the Deutsche Forschungsgemeinschaft (DFG) in the framework of the “Gottfried Wilhelm Leibniz Prize” awarded to S. G.Notes and references
- C. L. Ho and W. Y. Wong, Coord. Chem. Rev., 2011, 255, 2469–2502 CrossRef CAS.
- A. A. Warra, J. Chem. Pharm. Res., 2011, 3, 951–958 CAS.
- E. P. Beaumier, A. J. Pearce, X. Y. See and I. A. Tonks, Nat. Rev. Chem., 2019, 3, 15–34 CrossRef.
- A. Kletzin and M. W. Adams, FEMS Microbiol. Rev., 2006, 18, 5–63 CrossRef.
- R. J. P. Williams, Eur. J. Biochem., 1985, 150, 231–248 CrossRef CAS PubMed.
- J. G. Brandenburg, C. Bannwarth, A. Hansen and S. Grimme, J. Chem. Phys., 2018, 148, 064104 CrossRef PubMed.
- J.-D. Chai and M. Head-Gordon, Phys. Chem. Chem. Phys., 2008, 10, 6615–6620 RSC.
- Y.-S. Lin, G.-D. Li, S.-P. Mao and J.-D. Chai, J. Chem. Theory Comput., 2013, 9, 263–272 CrossRef CAS PubMed.
- N. Mardirossian and M. Head-Gordon, Phys. Chem. Chem. Phys., 2014, 16, 9904–9924 RSC.
- N. Mardirossian and M. Head-Gordon, J. Chem. Phys., 2016, 144, 214110 CrossRef PubMed.
- L. Goerigk and S. Grimme, J. Chem. Theory Comput., 2011, 7, 291–309 CrossRef CAS PubMed.
- S. Kozuch, D. Gruzman and J. M. L. Martin, J. Phys. Chem. C, 2010, 20801–20808 CrossRef CAS.
- S. Kozuch and J. M. L. Martin, J. Comput. Chem., 2013, 34, 2327–2344 CAS.
- M. Bursch, E. Caldeweyher, A. Hansen, H. Neugebauer, S. Ehlert and S. Grimme, Acc. Chem. Res., 2019, 52, 258–266 CrossRef CAS PubMed.
- C. Riplinger, B. Sandhoefer, A. Hansen and F. Neese, J. Chem. Phys., 2013, 139, 134101 CrossRef PubMed.
- C. Poree and F. Schoenebeck, Acc. Chem. Res., 2017, 50, 605–608 CrossRef CAS PubMed.
- T. Sperger, I. A. Sanhueza and F. Schoenebeck, Acc. Chem. Res., 2016, 49, 1311–1319 CrossRef CAS PubMed.
- Z. W. Qu, A. Hansen and S. Grimme, J. Chem. Theory Comput., 2015, 11, 1037–1045 CrossRef CAS PubMed.
- A. Hansen, C. Bannwarth, S. Grimme, P. Petrović, C. Werlé and J.-P. Djukic, ChemistryOpen, 2014, 3, 177–189 CrossRef CAS PubMed.
- I. Efremenko and J. M. Martin, AIP Conf. Proc., 2019, 2186, 030005 CrossRef.
- S. Grimme, J. G. Brandenburg, C. Bannwarth and A. Hansen, J. Chem. Phys., 2015, 143, 054107 CrossRef PubMed.
- A. S. Christensen, T. Kubař, Q. Cui and M. Elstner, Chem. Rev., 2016, 116, 5301–5337 CrossRef CAS PubMed.
- M. Elstner and G. Seifert, Philos. Trans. R. Soc., A, 2014, 372, 20120483 CrossRef PubMed.
- M. Gaus, Q. Cui and M. Elstner, J. Chem. Theory Comput., 2011, 7, 931–948 CrossRef CAS PubMed.
- W. Thiel, Wiley Interdiscip. Rev.: Comput. Mol. Sci., 2014, 4, 145–157 CAS.
- P. O. Dral, X. Wu, L. Spörkel, A. Koslowski, W. Weber, R. Steiger, M. Scholten and W. Thiel, J. Chem. Theory Comput., 2016, 12, 1082–1096 CrossRef CAS PubMed.
- R. Salomon-Ferrer, D. A. Case and R. C. Walker, Wiley Interdiscip. Rev.: Comput. Mol. Sci., 2013, 3, 198–210 CAS.
- X. Zhu, P. E. M. Lopes and A. D. MacKerell, Wiley Interdiscip. Rev.: Comput. Mol. Sci., 2012, 2, 167–185 CAS.
- W. L. Jorgensen and J. Tirado-Rives, J. Am. Chem. Soc., 1988, 110, 1657–1666 CrossRef CAS PubMed.
- W. L. Jorgensen, D. S. Maxwell and J. Tirado-Rives, J. Am. Chem. Soc., 1996, 118, 11225–11236 CrossRef CAS.
- J. J. P. Stewart, J. Mol. Model., 2007, 13, 1173 CrossRef CAS PubMed.
- J. Řezáč and P. Hobza, J. Chem. Theory Comput., 2012, 8, 141–151 CrossRef PubMed.
- P. S. Brahmkshatriya, P. Dobeš, J. Fanfrlík, J. Řezáč, K. Paruch, A. Bronowska, M. Lepšík and P. Hobza, Curr. Comput.-Aided Drug Des., 2013, 9, 118–129 CrossRef CAS PubMed.
- J. J. P. Stewart, J. Mol. Model., 2013, 19, 1–32 CrossRef CAS PubMed.
- A. K. Rappe, C. J. Casewit, K. S. Colwell, W. A. Goddard and W. M. Skiff, J. Am. Chem. Soc., 1992, 114, 10024–10035 CrossRef CAS.
- S. Grimme, C. Bannwarth and P. Shushkov, J. Chem. Theory Comput., 2017, 13, 1989–2009 CrossRef CAS PubMed.
- C. Bannwarth, S. Ehlert and S. Grimme, J. Chem. Theory Comput., 2019, 15, 1652–1671 CrossRef CAS PubMed.
- P. Pracht, E. Caldeweyher, S. Ehlert and S. Grimme, A Robust Non-Self-Consistent Tight-Binding Quantum Chemistry Method for large Molecules, ChemRxiv, 2019 DOI:10.26434/chemrxiv.8326202.v1.
- C. Bannwarth, E. Caldeweyher, S. Ehlert, A. Hansen, P. Pracht, J. Seibert, S. Spicher and S. Grimme, Wiley Interdiscip. Rev.: Comput. Mol. Sci., 2020, e01493 Search PubMed.
- S. Spicher and S. Grimme, Angew. Chem., Int. Ed., 2020, 59, 15665–15673 CrossRef CAS PubMed.
- P. Pracht, F. Bohle and S. Grimme, Phys. Chem. Chem. Phys., 2020, 22, 7169–7192 RSC.
- J.-G. Sobez and M. Reiher, J. Chem. Inf. Model., 2020, 60, 3884–3900 CrossRef CAS PubMed.
- A. K. Vitek, T. M. E. Jugovic and P. M. Zimmerman, ACS Catal., 2020, 10, 7136–7145 CrossRef CAS.
- P. C. D. Hawkins, J. Chem. Inf. Model., 2017, 57, 1747–1756 CrossRef CAS PubMed.
- J. Hutter, Wiley Interdiscip. Rev.: Comput. Mol. Sci., 2012, 2, 604–612 CAS.
- J. S. Tse, Annu. Rev. Phys. Chem., 2002, 53, 249–290 CrossRef CAS PubMed.
- R. Jinnouchi, K. Miwa, F. Karsai, G. Kresse and R. Asahi, J. Phys. Chem. Lett., 2020, 11, 6946–6955 CrossRef CAS PubMed.
- D. Folmsbee and G. Hutchison, Int. J. Quantum Chem., 2020, 121, e26381 Search PubMed.
- S. Grimme, J. Chem. Theory Comput., 2019, 15, 2847–2862 CrossRef CAS PubMed.
- G. I. Csonka, A. D. French, G. P. Johnson and C. A. Stortz, J. Chem. Theory Comput., 2009, 5, 679–692 CrossRef CAS PubMed.
- H. Kruse, A. Mladek, K. Gkionis, A. Hansen, S. Grimme and J. Sponer, J. Chem. Theory Comput., 2015, 11, 4972–4991 CrossRef CAS PubMed.
- L. Goerigk, A. Hansen, C. Bauer, S. Ehrlich, A. Najibi and S. Grimme, Phys. Chem. Chem. Phys., 2017, 19, 32184–32215 RSC.
- J. Řezáč, D. Bím, O. Gutten and L. Rulíšek, J. Chem. Theory Comput., 2018, 14, 1254–1266 CrossRef PubMed.
- V. Prasad, A. Otero-de-la Roza and G. DiLabio, Sci. Data, 2019, 6, 180310 CrossRef CAS PubMed.
- A. T. Cavasin, A. Hillisch, F. Uellendahl, S. Schneckener and A. H. Göller, J. Chem. Inf. Model., 2018, 58, 1005–1020 CrossRef CAS PubMed.
- D. I. Sharapa, A. Genaev, L. Cavallo and Y. Minenkov, ChemPhysChem, 2019, 20, 92–102 CAS.
- Y. Minenkov, D. I. Sharapa and L. Cavallo, J. Chem. Theory Comput., 2018, 14, 3428–3439 CrossRef CAS PubMed.
- S. G. Balasubramani, G. P. Chen, S. Coriani, M. Diedenhofen, M. S. Frank, Y. J. Franzke, F. Furche, R. Grotjahn, M. E. Harding, C. Hättig, A. Hellweg, B. Helmich-Paris, C. Holzer, U. Huniar, M. Kaupp, A. Marefat Khah, S. Karbalaei Khani, T. Müller, F. Mack, B. D. Nguyen, S. M. Parker, E. Perlt, D. Rappoport, K. Reiter, S. Roy, M. Rückert, G. Schmitz, M. Sierka, E. Tapavicza, D. P. Tew, C. van Wüllen, V. K. Voora, F. Weigend, A. Wodyński and J. M. Yu, J. Chem. Phys., 2020, 152, 184107 CrossRef CAS PubMed.
- F. Neese, Wiley Interdiscip. Rev.: Comput. Mol. Sci., 2018, 8, e1327 Search PubMed.
- J. J. P. Stewart, MOPAC2016, Stewart Computational Chemistry, Colorado Springs, CO, USA, 2016 Search PubMed.
- Semiempirical Extended Tight-Binding Program Package xtb, Version 6.3.2 https://github.com/grimme-lab/xtb (accessed: September 3, 2020).
- S. Grimme and A. Hansen, Angew. Chem., Int. Ed., 2015, 54, 12308–12313 CrossRef CAS PubMed.
- C. A. Bauer, A. Hansen and S. Grimme, Chem. – Eur. J., 2017, 23, 6150–6164 CrossRef CAS PubMed.
- F. Weigend and R. Ahlrichs, Phys. Chem. Chem. Phys., 2005, 7, 3297–3305 RSC.
- E. Caldeweyher, S. Ehlert, A. Hansen, H. Neugebauer, S. Spicher, C. Bannwarth and S. Grimme, J. Chem. Phys., 2019, 150, 154122 CrossRef PubMed.
- E. Caldeweyher, C. Bannwarth and S. Grimme, J. Chem. Phys., 2017, 147, 034112 CrossRef PubMed.
- O. Vahtras, J. Almlöf and M. W. Feyereisen, Chem. Phys. Lett., 1993, 213, 514–518 CrossRef CAS.
- K. Eichkorn, F. Weigend, O. Treutler and R. Ahlrichs, Theor. Chem. Acc., 1997, 97, 119–124 Search PubMed.
- F. Weigend, Phys. Chem. Chem. Phys., 2006, 8, 1057–1065 RSC.
- A. Hellweg, C. Hättig, S. Höfener and W. Klopper, Theor. Chem. Acc., 2007, 117, 587–597 Search PubMed.
- D. Andrae, U. Häußermann, M. Dolg, H. Stoll and H. Preuß, Theor. Chim. Acta, 1990, 77, 123–141 CrossRef CAS.
- K. A. Peterson, D. Figgen, E. Goll, H. Stoll and M. Dolg, J. Chem. Phys., 2003, 119, 11113–11123 CrossRef CAS.
- C. Riplinger, P. Pinski, U. Becker, E. F. Valeev and F. Neese, J. Chem. Phys., 2016, 144, 024109 CrossRef PubMed.
- F. Pavošević, C. Peng, P. Pinski, C. Riplinger, F. Neese and E. F. Valeev, J. Chem. Phys., 2017, 146, 174108 CrossRef PubMed.
- C. R. Groom, I. J. Bruno, M. P. Lightfoot and S. C. Ward, Acta Crystallogr., Sect. B: Struct. Sci., Cryst. Eng. Mater., 2016, 72, 171–179 CrossRef CAS PubMed.
- K. Pearson, Philos. Mag., 1901, 2, 559–572 Search PubMed.
- H. Hotelling, J. Educ. Psychol., 1933, 24, 417–441 CrossRef.
- S. Lloyd, IEEE Trans. Inf. Theory, 1982, 28, 129–137 CrossRef.
- J. Shao, S. W. Tanner, N. Thompson and T. E. Cheatham, J. Chem. Theory Comput., 2007, 3, 2312–2334 CrossRef CAS PubMed.
- H. S. Yu, X. He, S. L. Li and D. G. Truhlar, Chem. Sci., 2016, 7, 5032–5051 RSC.
- S. Dohm, A. Hansen, M. Steinmetz, S. Grimme and M. P. Checinski, J. Chem. Theory Comput., 2018, 14, 2596–2608 CrossRef CAS PubMed.
- T. Weymuth, E. P. A. Couzijn, P. Chen and M. Reiher, J. Chem. Theory Comput., 2014, 10, 3092–3103 CrossRef CAS PubMed.
- B. Chan, P. M. W. Gill and M. Kimura, J. Chem. Theory Comput., 2019, 15, 3610–3622 CrossRef CAS PubMed.
- C. Adamo and V. Barone, J. Chem. Phys., 1999, 110, 6158–6170 CrossRef CAS.
- S. Grimme, J. Chem. Phys., 2006, 124, 034108 CrossRef PubMed.
- L. Goerigk and S. Grimme, Wiley Interdiscip. Rev.: Comput. Mol. Sci., 2014, 4, 576–600 CAS.
- S. Grimme, J. Antony, S. Ehrlich and H. Krieg, J. Chem. Phys., 2010, 132, 154104 CrossRef PubMed.
- P. Petrović, J. P. Djukic, A. Hansen, C. Bannwarth and S. Grimme, Non-covalent Interactions in the Synthesis and Design of New Compounds, John Wiley & Sons, Inc, Hoboken, NJ, 2016, pp. 115–143 Search PubMed.
- S. Spicher and S. Grimme, J. Phys. Chem. Lett., 2020, 11, 6606–6611 CrossRef CAS PubMed.
- M. Bursch, H. Neugebauer and S. Grimme, Angew. Chem., Int. Ed., 2019, 58, 11078–11087 CrossRef CAS.
- Y. Minenkov, E. Chermak and L. Cavallo, J. Chem. Theory Comput., 2016, 12, 1542–1560 CrossRef CAS PubMed.
- Y. Minenkov, E. Chermak and L. Cavallo, J. Chem. Theory Comput., 2015, 11, 4664–4676 CrossRef CAS PubMed.
- X. Xu and D. G. Truhlar, J. Chem. Theory Comput., 2011, 7, 2766–2779 CrossRef CAS PubMed.
- N. W. Mitzel and D. W. H. Rankin, Dalton Trans., 2003, 3650 RSC.
- S. Blomeyer, M. Linnemannstöns, J. H. Nissen, J. Paulus, B. Neumann, H.-G. Stammler and N. W. Mitzel, Angew. Chem., Int. Ed., 2017, 56, 13259–13263 CrossRef CAS PubMed.
- P. Klaeboe, Vib. Spectrosc., 1995, 9, 3–17 CrossRef CAS.
- M. Schnell, Z. Phys. Chem., 2013, 227, 1–22 CrossRef CAS.
- D. Li, J. Schwabedissen, H.-G. Stammler, N. W. Mitzel, H. Willner and X. Zeng, Phys. Chem. Chem. Phys., 2016, 18, 26245–26253 RSC.
- H. W. van Vlijmen, M. Schaefer and M. Karplus, Proteins, 1998, 33, 145–158 CrossRef CAS.
- P. Pracht, R. Wilcken, A. Udvarhelyi, S. Rodde and S. Grimme, J. Comput.-Aided Mol. Des., 2018, 32, 1139–1149 CrossRef CAS PubMed.
- S. Grimme, C. Bannwarth, S. Dohm, A. Hansen, J. Pisarek, P. Pracht, J. Seibert and F. Neese, Angew. Chem., Int. Ed., 2017, 56, 14763–14769 CrossRef CAS PubMed.
- J. Seibert, C. Bannwarth and S. Grimme, J. Am. Chem. Soc., 2017, 139, 11682–11685 CrossRef CAS PubMed.
- E. A. Coutsias, C. Seok and K. A. Dill, J. Comput. Chem., 2004, 25, 1849–1857 CrossRef CAS PubMed.
- F. Bohle, ENSO, Mulliken Center for Theoretical Chemistry, Universität Bonn, 2020 Search PubMed.
- R. J. Deeth, A. Anastasi, C. Diedrich and K. Randell, Coord. Chem. Rev., 2009, 253, 795–816 CrossRef CAS.
- C. Riplinger, U. Becker, D. G. Liakos, Y. Minenkov, L. Cavallo and F. Neese, J. Chem. Phys., 2018, 148, 011101 CrossRef PubMed.
Footnotes |
| † The xtb and CREST programs can be obtained from our GitHub page (https://github.com/grimme-lab/xtb and https://github.com/grimme-lab/crest). |
| ‡ Electronic supplementary information (ESI) available: Computational details, taulated relative energies (esi.pdf), and cartesian coordinates in XYZ format (TMCONF40.zip). See DOI: 10.1039/d0cp04696e |
| This journal is © the Owner Societies 2021 |