Lithium vanadium oxide (Li1.1V3O8) thick porous electrodes with high rate capacity: utilization and evolution upon extended cycling elucidated via operando energy dispersive X-ray diffraction and continuum simulation†
Alison H.
McCarthy
 a,
Karthik
Mayilvahanan
b,
Mikaela R.
Dunkin
 a,
Steven T.
King
 d,
Calvin D.
Quilty
d,
Lisa M.
Housel
d,
Calvin D.
Quilty
d,
Lisa M.
Housel
 d,
Jason
Kuang
a,
Kenneth J.
Takeuchi
 ad,
Esther S.
Takeuchi
 acd,
Alan C.
West
*be,
Lei
Wang
 *c and
Amy C.
Marschilok
 *acd
*acd
aDepartment of Materials Science and Chemical Engineering, Stony Brook University, Stony Brook, NY 11794, USA. E-mail: amy.marschilok@stonybrook.edu
bDepartment of Chemical Engineering, Columbia University, New York, NY 10027, USA. E-mail: acw7@columbia.edu
cEnergy and Photon Sciences Directorate, Brookhaven National Laboratory, Upton, NY 11973, USA. E-mail: lwang@bnl.gov
dDepartment of Chemistry, Stony Brook University, Stony Brook, NY 11794, USA
eDepartment of Earth and Environmental Engineering, Columbia University, New York, NY 10027, USA
First published on 30th September 2020
Abstract
The phase distribution of lithiated LVO in thick (∼500 μm) porous electrodes (TPEs) designed to facilitate both ion and electron transport was determined using synchrotron-based operando energy dispersive X-ray diffraction (EDXRD). Probing 3 positions in the TPE while cycling at a 1C rate revealed a homogeneous phase transition across the thickness of the electrode at the 1st and 95th cycles. Continuum modelling indicated uniform lithiation across the TPE in agreement with the EDXRD results and ascribed decreasing accessible active material to be the cause of loss in delivered capacity between the 1st and 95th cycles. The model was supported by the observation of significant particle fracture by SEM consistent with loss of electrical contact. Overall, the combination of operando EDXRD, continuum modeling, and ex situ measurements enabled a deeper understanding of lithium vanadium oxide transport properties under high rate extended cycling within a thick highly porous electrode architecture.
1. Introduction
Newer, ever more demanding energy storage systems require high energy density along with high power under charge and discharge. Conventional slurry-cast electrode fabrication techniques are often limited by the areal capacity of active material and if electrodes are made thicker, transport limitations can become significant where the full utilization of the active material can only be realized at low to moderate rates.1 Recently, new electrode fabrication techniques have been explored to increase the active mass loading and deliverable energy density. The electrode designs consider the porosity and tortuosity of the electrode in order to increase the active material utilization to increase the deliverable capacity. Some approaches to achieve this have incorporated 3 dimensional foams,2,3 aligned a porous matrix to control tortuosity,4–7 and exploited nanotechnology for electrode design8–10 including the use of holey/porous nanoarchitectures.11 Electrode approaches have even added biological components to control the porosity.2,12Insight into function of thick electrodes is valuable to create the information needed for future designs and ultimately commercial implementation. Adoption of thick electrode configurations can increase the overall systems level energy density by minimizing inactive components such as metal foils and separator layers.13–15 However, simply increasing the active material in the electrode does not translate to full utilization and delivery of a stable capacity over extended cycling.16,17 Thus, it is necessary to have understanding of electron transfer and ion transport, ideally with spatial and temporal resolution, to enable the rational design of larger scale systems with high energy density.18–20 To achieve a thorough understanding of design rules in thick electrodes, an integrated approach should be emphasized to accumulate discrete data from fundamental study, advanced characterization, as well as theoretical modelling in battery research.21
In previous studies on thick electrodes, a variety of active materials have been explored including metal phosphates2,12,22–24 and transition metal oxides such as lithium nickel manganese cobalt oxide (NMC),25,26 and lithium cobalt oxide (LCO).3,26 Vanadium oxides have been studied as electrode materials for Li-based batteries due to the possibility of high capacity based on the variable oxidation states accessible for vanadium,27 including V2O5,28–31 NaV6O15,31,32 NaV3O8,33,34 and LiV3O8.32,35–40 Monoclinic lithium vanadium oxide (LiV3O8) is appealing as it provides high theoretical capacity (1C = 362 mA g−1), high rate capability, and is cobalt-free.16,41 Initially the material is a Li-poor α-phase (Li1.1V3O8) in a layered structure, and upon lithiation transitions to a Li-rich α-phase (Li2.5V3O8) at ∼2.5 V.16 The defective rock-salt β-phase (Li3.5V3O8–Li4.0V3O8) transition occurs in the third plateau ∼2.3 V.42 Starting with the composition of Li1.1V3O8 introduces both tetravalent V4+ and an increase in oxygen vacancies into the initial LiV3O8 material.43 This slight change increases both the intrinsic electrical conductivity by an order of magnitude and the lithium-ion diffusion coefficient by approximately two orders of magnitude when compared to LiV3O8 without detectable V4+.43 By incorporating V4+ into the materials initial composition, not only does the electronic conductivity and Li-ion diffusion improve, but the material also exhibits better electrochemical reversibility than LiV3O8.43 Based on this motivation, Li1.1V3O8 was chosen for the active material instead of LiV3O8.
Previously, the differences between LVO (LiV3O8) annealed at 500 °C and 300 °C were elucidated.16,44 Through in situ angle dispersive X-ray diffraction (ADXRD), differences in β-phase formation were determined for different synthesis techniques.34 Both X-ray and neutron refinement were utilized to determine the Li-rich α-phase and the defective rock salt β-phase at Li2.7V3O8 and Li4.8V3O8, respectively, for chemically lithiated materials.44 The structural evolution of the materials throughout electrochemical (dis)charge processes has been determined through in situ XRD and DFT calculations.42
Operando energy dispersive X-ray diffraction (EDXRD) experiments allow for spatially and temporally resolved visualization of the various phase transitions of an active cell.45 Related techniques such as confocal or spectroscopic X-ray diffraction can modify EDXRD by changing the incident beam energy to improve measurement resolution and have been applied to the study of LixNi1/3Co1/3Mn1/3O2 (NCM) type battery electrodes.46 Synchrotron X-ray phase contrast tomography offers the opportunity to image morphological changes of Li electrodes, permitting characterization of evolving microstructures and degradation mechanisms.47 A specific benefit of EDXRD in conjunction with a synchrotron light source is the ability to measure intact stainless-steel housings electrochemical cells, preventing any artifacts due to the use of cell windows, removal of the electrodes, or any post-treatment methods used in the cell disassembly process. Further, the ability to collect X-ray data real time concurrently with the electrochemical activity provides insight into the kinetics of the electrochemistry under usage conditions.
Previous studies have paired continuum modelling with experimental results to rationalize the electrochemistry and the phase changes that occur throughout (de)lithiation for various systems48 including LVO.49,50 Continuum modelling coupled with the results of EDXRD measurements allowed confirmation of the model with experimental data to determine the occurrence of the phase changes over the course of lithiation of a thick dense electrode showing significant phase segregation through the thickness of the electrode. Pairing electrode and crystal scale models allowed the simulation to closely match the experimental discharge voltage profile until reaching discharge of 2.4 V without including consideration of β-phase formation.50
For this study, a thick porous electrode (TPE) fabrication technique was utilized to obtain a high areal active mass loading of dispersed LVO particles within a conductive CNT architecture that facilitates ion and electron transport.1 The objective was to study the electrode utilization of this architecture under high rate cycling using EDXRD methodology. Using operando EDXRD experimental results, the continuum model for the LVO system was expanded to consider the 2.0 V limit including the transformation to the defective rock salt β-phase. The extended continuum simulation was able to rationalize transport properties as well as capacity decrease over ∼100 cycles.
2. Experimental
Lithium vanadium oxide synthesis
Li1.1V3O8 (LVO) was synthesized via a sol–gel approach as previously reported.42 Briefly, V2O5 and LiOH were used as precursor materials in a stoichiometric ratio of Li![[thin space (1/6-em)]](https://www.rsc.org/images/entities/char_2009.gif) :
:![[thin space (1/6-em)]](https://www.rsc.org/images/entities/char_2009.gif) V = 1.1
V = 1.1![[thin space (1/6-em)]](https://www.rsc.org/images/entities/char_2009.gif) :
:![[thin space (1/6-em)]](https://www.rsc.org/images/entities/char_2009.gif) 3 and stirred in an aqueous solution under nitrogen for 24 hours at 50 °C. The solid was recovered and annealed at 500 °C.
3 and stirred in an aqueous solution under nitrogen for 24 hours at 50 °C. The solid was recovered and annealed at 500 °C.
Material and electrode characterization
Inductively coupled plasma-optical emission spectroscopy (ICP-OES) was performed to determine the elemental compositions of LVO using a Thermofisher iCAP 6300 series instrument. X-ray diffraction (XRD) was performed using a Rigaku Smartlab Diffractometer using Cu Kα radiation. The morphology of materials and electrodes was determined using an analytical high-resolution scanning electron microscope (SEM) (JEOL 7600F). Thermogravimetric analysis (TGA) was acquired to confirm the mass loading of the electrodes using a TGA Q500 instrument over a temperature range spanning 25 °C to 750 °C. Raman data were recorded using a Horiba Scientific XploRA instrument with a 532 nm laser. Wavelength and intensity calibrations were completed by using a silicon standard. Raman 3D mapped volume (x = 60 μm, y = 60 μm, and z = 8 μm, with z direction being perpendicular to the electrodes) contained 4805 Raman spectra ranging from 100–1800 cm−1, and the step size of the map was 2 μm.Electrochemical characterization
The thick porous electrodes (TPE) were prepared using carbon nanotubes (CNTs) and LVO at a mass ratio of 1![[thin space (1/6-em)]](https://www.rsc.org/images/entities/char_2009.gif) :
:![[thin space (1/6-em)]](https://www.rsc.org/images/entities/char_2009.gif) 1 where they were dispersed and filtered to prepare 12.7 mm diameter electrodes with a thickness of 741 μm. Dense pelletized electrodes with similar active mass loading as the TPE were prepared using LVO and CNTs with the same weight ratio, which were mixed as solids and pressed at 4000 psi to form the dense electrode with a thickness of 357 μm. Coin type cells were assembled using Li metal anodes, polypropylene separators and 1 M LiPF6 in ethylene carbonate/dimethyl carbonate (volume ratio of 3
1 where they were dispersed and filtered to prepare 12.7 mm diameter electrodes with a thickness of 741 μm. Dense pelletized electrodes with similar active mass loading as the TPE were prepared using LVO and CNTs with the same weight ratio, which were mixed as solids and pressed at 4000 psi to form the dense electrode with a thickness of 357 μm. Coin type cells were assembled using Li metal anodes, polypropylene separators and 1 M LiPF6 in ethylene carbonate/dimethyl carbonate (volume ratio of 3![[thin space (1/6-em)]](https://www.rsc.org/images/entities/char_2009.gif) :
:![[thin space (1/6-em)]](https://www.rsc.org/images/entities/char_2009.gif) 7) electrolyte in an argon-filled glove box. Rate capability tests were performed at currents ranging from C/10–1C (1C = 362 mA g−1). Operando energy dispersive X-ray diffraction (EDXRD) measurements were conducted at the Advanced Photon Light Source at Argonne National Laboratory on Beamline 6-BM-B while cycling cells at 1C rate on a Maccor cycler. For ex situ measurements, the cathodes were recovered in an argon filled glove box.
7) electrolyte in an argon-filled glove box. Rate capability tests were performed at currents ranging from C/10–1C (1C = 362 mA g−1). Operando energy dispersive X-ray diffraction (EDXRD) measurements were conducted at the Advanced Photon Light Source at Argonne National Laboratory on Beamline 6-BM-B while cycling cells at 1C rate on a Maccor cycler. For ex situ measurements, the cathodes were recovered in an argon filled glove box.
3. Results and discussion
Material and electrode characterization
The XRD pattern was indexed to the Li0.97V3O8 reference pattern (PDF#01-073-8145), consistent with materials from a prior study (Fig. S1, ESI†).16 ICP-OES confirmed the elemental compositions of LVO to be Li1.1V3O8. Through Rietveld refinement the crystallite size was determined to be 169 nm ± 6 nm. The detailed refinement results are included in Table S1 (ESI†). The active material was used to fabricate thick porous electrodes (TPE) where thermogravimetric (TGA) results confirmed a mass ratio of 50% LVO by weight in the electrode (Fig. S2, ESI†). SEM images and EDS elemental maps were used to investigate the distribution of LVO in the porous electrodes (Fig. S3A–E, ESI†). LVO exhibits a blade-like particle shape (Fig. S3A, ESI†) and is visible in the SEM of the electrodes as smooth blades in Fig. S3B (ESI†). Fig. S3C–E (ESI†) show elemental maps of carbon (red), vanadium (green), and oxygen (blue), respectively. The EDS maps indicated that the LVO particles are dispersed throughout the electrode surrounded by multiwall carbon nanotubes (CNTs).
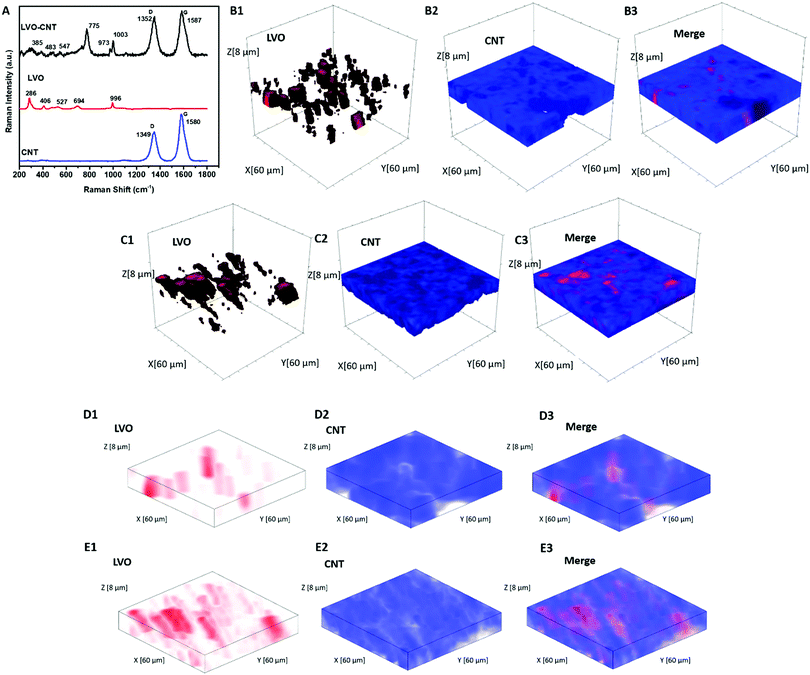
Fig. 1A displays the Raman spectra of the TPE containing LVO and CNT, and the corresponding spectra for each component. The peaks at 694, 775, and 996 cm−1 are assigned to the stretching vibrations of VO5.51,52 The band at 527 cm−1 corresponds to the V–O–V vibration stretching, while the bands located at 406 cm−1 and 286 cm−1 are assigned to the bending vibrations of V–O bonds.51 In the pristine CNT spectrum, the bands located at 1349 cm−1 and 1580 cm−1 can be assigned to the D and G band, respectively.53 An increase in the ID/IG ratio was noted in the LVO–CNT TPE, which can typically be attributed to expected distortion of the intrinsic conjugated sp2 carbon lattice, due to the interaction with LVO. In addition, upshifts were noted in the D and G bands of CNTs and the V–O vibration bands of LVO materials in the composite LVO–CNT TPE (i.e. 775 cm−1 for the LVO–CNT composite, 694 for the pristine LVO), which further confirmed strong interactions between the two components that affected the electronic structure of VO6 and VO5 units, as well as the C![[double bond, length as m-dash]](https://www.rsc.org/images/entities/char_e001.gif) C/C–C framework.54
C/C–C framework.54
Raman 3D mapping was used to determine the dispersion of LVO and CNTs within the as-prepared TPEs and the dense electrode. The multivariate Classical Least Squares (CLS) fitting rendered Raman 3D maps (mapping volume: 60 × 60 × 8 μm) of the LVO and CNTs were depicted in red and blue respectively, in Fig. 1B for the TPE, where the maps were created using individual spectra of pristine LVO and CNT as reference component spectra. The merged map clearly demonstrated the presence of pores with overall diameters ∼10–20 μm in the TPE, as indicated by the dark area in Fig. 1B(3). In contrast, the CLS maps of the dense electrode depicted in Fig. 1C showed more aggregated LVO particles and smaller pores. The porosity of the TPE and dense electrode was calculated to be 77% and 48%, respectively, in the mapped volume based on the CLS fitting results, which agrees well with the values of 78% and 49% estimated based on the true density of each material and the electrode volume. To provide direct visualization of pore and material distribution throughout the mapped electrode volume, 2D merge CLS maps at different electrode depths were displayed in Fig. S4 (ESI†), where large and deep pores were clearly identified in the TPE.
Additionally, a non-negative matrix factorization (NMF) machine learning algorithm was utilized to process the Raman maps collected for both TPE and dense electrode to significantly increase the signal-to-noise ratio of each spectrum (Fig. S5, ESI†) and to allow each chemical component represented in the dataset to be analyzed independently. Different from the CLS rendered the maps, the NMF method does not require the external standards to be applied. The NMF reconstructed 3D maps of the TPE and dense electrode (Fig. 1D and E) showed clear agreement with CLS figures, further confirming the highly dispersed LVO active materials with no apparent large aggregates, throughout our judiciously designed TPEs.
Comparing electrode designs
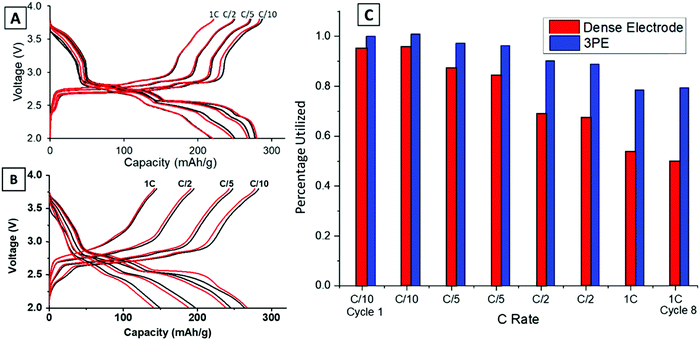
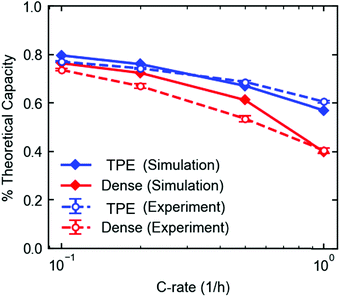
Previous work reported the phase evolution of LVO in a high loading pellet electrode through operando EDXRD at a C/18 rate.16 Voltage profiles of all the rates tested (C/10–1C) were compared for the dense and TPE configurations shown in Fig. 2. Three distinct regions are noted in the voltage profile, with plateaus at about 2.8 V, 2.5 V and 2.3 V.42 The voltage response is consistent with the transformation of the Li-poor α-phase (Li1.1V3O8) to a Li-rich α-phase (Li2.5V3O8) at around 2.5 V,16 followed by formation of the defective rock-salt β-phase (Li3.5V3O8–Li4.0V3O8) around 2.3 V.42 The TPE (Fig. 2A) cell shows a 79% capacity retention from C/10 to 1C rate after 8 cycles. The final plateau around 2.3 V starts to shorten or disappear at higher rates because it corresponds to a slower kinetic insertion process.43 Although this peak disappears at faster rates, it only results in a small decrease in capacity, enabling the cells to continue to perform relatively well at fast rates. In contrast, the dense electrode (Fig. 2B) shows a more significant capacity decrease with only 50% capacity retention from C/10 to 1C rate after 8 cycles. Upon increasing the discharge/charge rates, both plateaus at 2.5 V and 2.3 V shorten or disappear, indicative of slower kinetic processes at higher rates in the dense pellet electrode. The capacity for the two electrode types (TPE thickness: 0.741 mm and dense electrode thickness: 0.357 mm) was normalized by assuming the highest achieved capacity of 280 mA h g−1 in TPE corresponds to a 100% electrode utilization. The comparison at each rate between these two electrode designs is summarized in Fig. 2C. The TPE cell maintains a high deliverable capacity at all rates: 280 mA h g−1 at C/10, 270 mA h g−1 at C/5, 250 mA h g−1 at C/2 rate, and 220 mA h g−1 at 1C rate. In contrast, the dense electrode delivered 264, 245, 197, and 149 mA h g−1 at the corresponding rates illustrating the transport limitations of the dense electrode, consistent with the lower electrode porosity as shown in Fig. 1C and E.Operando EDXRD
Operando energy dispersive X-ray diffraction (EDXRD) allows for spatial and temporal resolution of phases throughout an electrode while operating within a stainless-steel coin cell. The voltage profiles for the cell cycled at 1C rate for the operando EDXRD scans at cycles 1 and 95 are shown in Fig. 3A. The first cycle shows the cell lithiated to ∼3.5 Li equivalents (Li3.5V3O8) while the 95th cycle lithiated to 2.2 Li equivalents with shorter, less distinct plateaus compared to the initial cycle. Fig. 3B shows the extended cycling results where the operando scans were recorded for the 1st and 95th cycle. The cell displayed significant capacity decrease maintaining ∼44% capacity for the 95th cycle.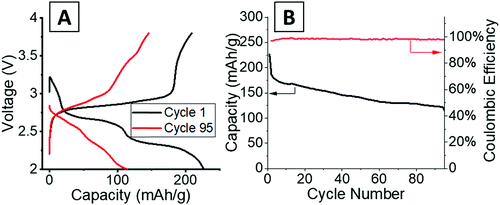 | ||
| Fig. 3 (A) Voltage profiles of the cells at 1C rate while EDXRD spectra was being collected during the first and 95th cycle. (B) Cycling test at 1C rate between the EDXRD scans. | ||
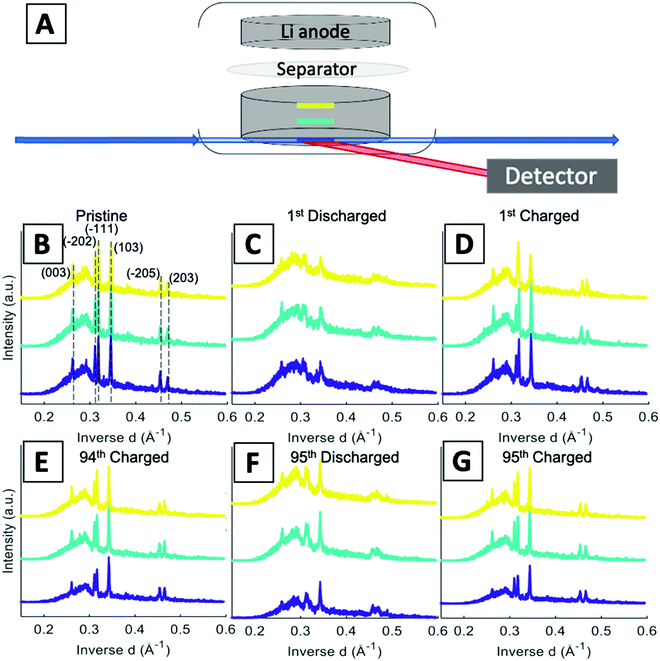
A schematic of the operando EDXRD experimental setup is shown in Fig. 4A. The diffraction patterns were collected in 20 μm thick increments (gauge volume = 2 × 4 × 0.02 mm) in three locations along the cathode thickness. Three locations were scanned (the colored bars along the electrode in Fig. 4A) to enable visualization of the phase evolution throughout the electrode at the high rate of 1C.
Stacked plots of representative diffraction scans from the first cycle operando EDXRD are shown in Fig. 4B–D. The pristine scan was taken before the discharge started, while the discharged and charged scans for the initial cycle were taken during the cycling of the cell near the fully discharged and fully charged states. Fig. 4E–G display the selected operando scans for the 95th or final cycle. The EDXRD scans for the 95th cycle were taken before (94th cycle charged state), during (95th cycle discharge state), and after (95th cycle charged state) the electrochemical cycling processes. Overall, among the three locations probed, anode side (yellow), middle (teal), and stainless-steel side (blue), a homogeneous phase transformation is visible across the whole electrode at these points in the electrochemistry. Previous studies showed a reaction front, beginning on the anode side of the electrode, which failed to propagate throughout the entire cathode at faster rates due to an ion transport limitation in a dense electrode configuration.16 The porous electrode design used in this study allows for easier pathways through the pores to facilitate ion transfer and a network of conductive CNTs helps maintain the strong electrical transport.
For both cycle 1 and 95, the material under discharge become more amorphous with some peaks becoming indistinguishable from the baseline. In contrast, the charged scan profiles return to similar peak positions and intensities as the pristine state. These operando scans were selected to demonstrate the consistency throughout the electrode by focusing on the 3 locations, the stacked plots of each scan throughout the entire (dis)charge process are shown in Fig. 4B–G. The left most peak around 0.26 Å−1, indexed as the (003) peak, remains present throughout all of the scans. The α phase peaks (−202), (−111), and (103) are initially the most intense peaks for both cycles, upon discharging decrease in intensity and shift to beta phase peaks in the first cycle. Upon charging these peaks return to similar intensity levels of their original scans. In the 95th cycle, however, there are more distinct peaks in the discharged phase. The α phase peaks (−202) and (−111) appear to merge into a double peak corresponding with the α (−202) shift to higher inverse d spacing and α (−111) shift to lower inverse d spacing upon lithiation, effectively ‘crossing over’ each other. At the same time, the α (103) peak retains similar intensity relative to the pristine scan and no indication of a shift towards the β (103) at a higher inverse d spacing value. Similar to the initial scan, in the 95th cycle, the charge scans show a reversible system with the peaks returning to their initial pristine locations and relative intensities.
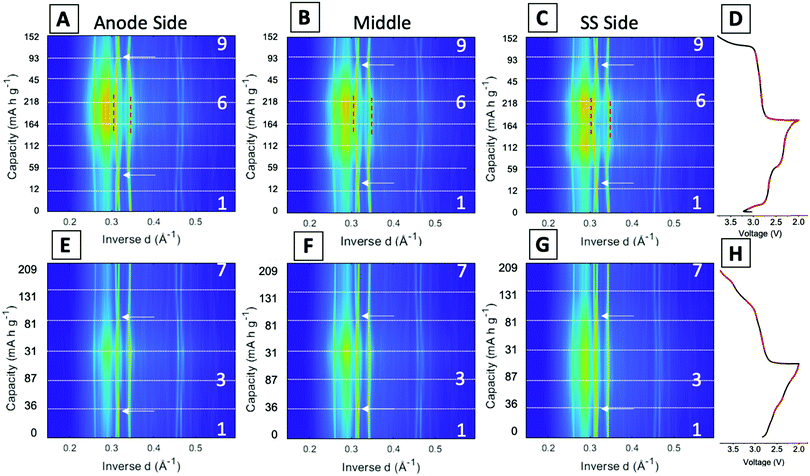
Fig. 5 displays the spatial phase evolution over the duration of the two cycles at each of the locations probed with the corresponding voltage profiles. This normalized contour plot readily visualizes the peak shift over time, but does not show the change in intensity throughout cycling as shown in the stacked plots. The three locations probed display almost identical contour plots over both the 1st and 95th cycles, indicating a homogeneous phase transformation throughout the entire cathode at both stages of cycling. The dashed lines correspond to the start of each new EDXRD scan. The numbers on the right-hand side of the contour plot correspond to the scan numbers of the major points in the voltage profile, the state prior to the cycle, fully discharged, and fully charged state. The arrows on each of the contour plots indicate where the α phase peaks (−202) and (−111) appear to cross over each other. During the discharge process, the α (−202) peak shifts to a higher inverse d spacing (contracts), while the α (−111) peak shifts to a lower inverse d space (expands), indicated by the red dashed lines. This structural rearrangement occurs to accommodate Li ions inserting into the structure.16,42 The opposite process occurs upon charging and the peaks return to their initial locations at the top arrow for each plot.
In the first cycle, upon discharge these two α peaks, (−111) and (−202), disappear and the β peak (−111) appears, indicated by the left red dashed line. The peak around 0.345 Å−1 can be ascribed to both the α (103) peak and the β (103) peak. The locations are similar, thus it is difficult to discern where one phase ends and the other begins, but the change visualized in the contour plot suggests a transition in the 5th and 6th scans which correspond to discharged material in the electrochemistry consistent with the presence of the beta phase peak. The right red dashed line highlights this shift from α (103) to β (103). In the first scan in the charging process (just after #2 on the plot), the beta phase peaks disappear and a shift to the initial peak locations starts to occur. At the fully charged state all of the peaks return to their initial pristine locations, indicating a reversible process in the first cycle at 1C rate.
For the 95th cycle, the crossover of the two α peaks, (−111) and (−202) remains, i.e. the (−111) peak shifts to a lower inverse d spacing and the (−202) peak shifts to a higher inverse d spacing as the material is lithiated, but the beta phases do not appear as prominently as in the first cycle, indicating less lithiation. This is partially due to the amorphization apparent in the diffraction profile in the discharge stage of the process, where the differentiation between the peaks and background is hard to distinguish. The peaks at higher inverse d, between 0.45 and 0.47 Å−1, correspond to α (−205) and α (203) in the pristine phase. In the first cycle, the appearance of these peaks is very distinct with a clear shift of α (−205) to β (205) in discharge and then shift back upon charge. The shifts in the 95th cycle are less prominent than the first cycle, but a shift is still discernable.
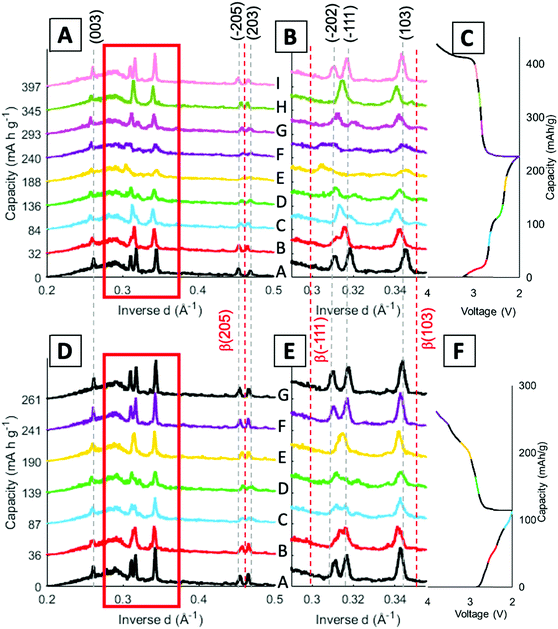
Stack plots were generated to visualize the peak shifts along with any change in intensity throughout the cycling process. Fig. 6 displays stack plots of scans at the middle location, since a homogenous phase change throughout the electrode was determined through the previous stack and contour plots. Fig. 6B and E show an expanded view of the region from 0.29–0.35 Å−1 to feature the peak locations more clearly. The α phase peak locations are indicated by the grey dashed lines across the scans and the β peak locations are given by the red dashed lines throughout the scans. The voltage profile is included with the different scans color coded to match the stacked profiles taken at that point in the cycle.
The α (003) peak remains present throughout the entirety of both cycles probed. In cycle 1, α peaks (−205) and (203) are present in the pristine scan (Fig. 6A). As the cell discharges, α peak (−205) shifts to higher inverse d spacing aligning closer to β-phase (205) peak which occurs at 0.463 Å−1, as shown in profiles labeled E (yellow) and F (purple). Upon charging the peak shifts back to its original position. When looking at the same peaks in the 95th cycle the α peak (−205) starts off at a higher inverse d spacing initially, showing that the peak has no longer recovered fully to the pristine phase after extended cycling (Fig. 6D). Through cycling there is still a shift towards the beta phase in scans C and D followed by a recovery upon charge, although still not to the pristine location.
As discussed in the contour plots, the two α peaks (−111) and (−202) at 0.318 Å−1 and 0.311 Å−1 inverse d spacings respectively, crossover to 0.313 Å−1 and 0.318 Å−1 and the introduction of β (−111) is visible in Fig. 6B. The β-phase (−111) peak becomes visible in scans E and F, but the peak does not index to its expected inverse d spacing of 0.299 Å−1. When compared with the 95th cycle, there is not a β peak that arises around the full discharge locations, but the profile does lose intensity and becomes more amorphous similar to the first cycle. Cycle 1 has a shift, mostly in scan E (yellow), for the β (103) peak, while in the 95th cycle the peaks stay aligned with the α (103) peak. Overall, the 95th cycle does not indicate the β-phase transitions seen in the first cycle and some of the peak shifts are not as reversible. This finding has also been observed in a study with LVO in another porous electrode structure, where the β-phase plateau decreases over extended cycling, but this is the first time seeing this irreversibility in operando EDXRD.55 However, previous studies of LVO as a thin film electrode noted the β-phase plateau at 2.3 V extend over extended cycling,40 indicating that this finding may be specifically applicable to LVO in a three-dimensional, porous structure.
Ex situ XRD and SEM
To probe the crystal structure of LVO as it cycles in a lithium coin cell, electrodes were fabricated and cycled either once or 100 times both ending on a charge step (Fig. S6, ESI†) and XRD was collected (Fig. S7, ESI†). For the pristine sample, all peaks could be assigned to α-LVO (P21/m, a = 6.636(2) Å, b = 3.5941(4) Å, c = 12.012(4) Å, β = 107.886(7)°) with a broad peak at ∼26° from the highly nanocrystalline CNTs (Table S2 and Fig. S8, ESI†). The material was highly crystalline and only minimally strained consistent with the bulk LVO material. A significant amount of preferred orientation along the (110) axis was noted and likely comes from the electrode fabrication process. After cycling once, there is no significant change in the lattice or phase composition suggesting that the delithiation is highly reversible (Fig. S9, ESI†). After 100 cycles (Fig. S10, ESI†) the phase and lattice are preserved showing that the structural changes that occur upon lithiation are reversed upon delithiation. An increase in microstrain upon cycling is noted suggesting that the (de)lithiation process causes the structure to become more strained and adopt additional defects as cycling progresses. These results support the operando EDXRD results which noted that the α-LVO phase reforms upon charging over 95 cycles.SEM images were acquired of the electrodes used in the ex situ XRD study. A fresh electrode shows a large smooth particle of LVO500 entangled with CNTs (Fig. 7A). After one cycle the LVO particle appeared in smaller pieces with sharper edges (Fig. 7B). Fig. 7C shows additional smaller broken pieces with rounded edges over extended cycling (100 cycles). The combination of the LVO particle fracture, loss of contact with the CNT, contribute to the capacity fade over 100 cycles due to a decrease in accessible active material consistent with prior reports.44,56 This continuous cracking and disintegration of LVO materials upon cycling can induce some increase in the porosity of the thick electrodes.
Dense and thick porous electrode simulations
The electrodes used for results shown in Fig. 2A and B were modeled using a coupled electrode and crystal scale model based on a previously published model.49 The crystal-scale model recently published50 was extended to include insertion of lithium ions into the β-phase, such that the lithiation of LVO crystals could be described to 2.0 V.The TPE model was fit to the discharge profiles of the eight cycles in the rate capability experiment in Fig. 2A. Both models show good agreement with the discharge profiles and fractional capacity utilization over the range of discharge rates (Fig. S11, ESI† and Fig. 8). For the dense electrode, the electrolyte diffusion coefficient Deff was fit to the 1C discharge, which was determined to be between 4.3 × 10⁻⁷ cm2 s−1 and 5.0 × 10⁻⁷ cm2 s−1. The corresponding tortuosity τ ranges from 3 to 3.5, assuming a bulk diffusivity D0 of 3 × 10⁻⁶ cm2 s−1.57 For the porous electrode, the model-predicted discharge curves were not sensitive to the electrolyte diffusion coefficient and tortuosity, so these parameters could not be estimated. The model overpredicts the discharge capacity of the dense electrode at the lower discharge rates. This discrepancy is likely due to the fact that only Deff was allowed to vary to achieve agreement, and only the 1C discharge rate was used, since the model was insensitive to Deff at the lower rates. Model parameters that describe other physical processes (e.g. lithium insertion kinetics, phase change, crystal-scale diffusion) were fit previously to different electrodes that were prepared with carbon, graphite, and PVDF in much smaller weight ratios50 and were fit to low rate experimental data.20 The physical phenomena governed by these parameters are more dominant than ion transport at the lower rates, so some discrepancies can be expected at the lower rates when fitting one parameter to only high rate experiments. Still, the simulated absolute capacity delivered at each rate (mA h) is well within expectation compared to the experiments.
Closer examination of the simulated spatial variation of the material utilization is shown in Fig. 9. The TPE shows uniform distribution of lithium across the length (thickness) of the electrode at the end of discharge, in agreement with the observed uniformity by EDXRD at a 1C rate. However, due to the higher mass transport resistances in the dense electrode, only a portion of the electrode near the separator is used, resulting in poor utilization at the higher rate of 1C.
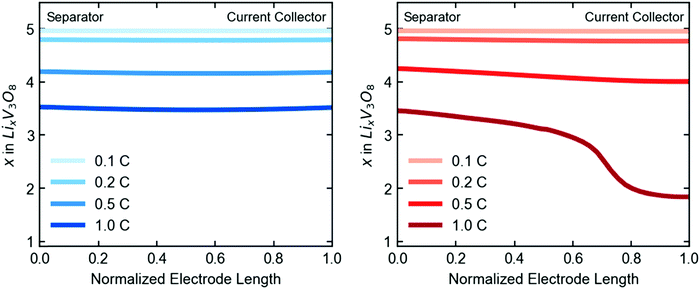 | ||
| Fig. 9 Simulated spatial variation of lithiation state across the length of the electrode at end of discharge, given in electron equivalents for the TPE (left) and dense electrode (right). | ||
EDXRD extended cycling simulations
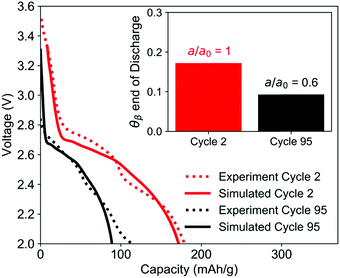
Simulation of the electrode used in the EDXRD experiment, discharged at a 1C rate, shows good agreement with the second cycle of the experiment. For the TPE with minimal ionic transport resistance and uniform electrode utilization, the simulations predict that approximately 17% of the electrode undergoes phase transformation by the time the cutoff voltage is reached.Between the second and 95th cycle, there is a 40% loss in capacity. To simulate this, the electrochemically active surface area a [cm2 cm−3] was reduced by 40%, the equivalent of 40% of the material not being utilized in the electrode. This model showed good agreement with the cycle 95 discharge profile and predicts that the crystals only undergo phase change to the extent that the volume fraction of the β-phase is only 9% at the end of discharge (Fig. 10). The reduction in extent of phase transformation is observed because as the amount of usable active material is reduced, the specific current (A g−1) passing through the remaining crystals is higher. When the specific current is higher, the rate of insertion of lithium ions into the crystal is faster than the rate of phase change, which does not involve charge transfer. The increased charge transfer losses therefore cause the cell to reach the cutoff voltage more quickly, leaving less time for the crystals to undergo phase change. These results are qualitatively consistent with the EDXRD findings, where no β-phase peak is readily observable in cycle 95. Note that the electrode at the beginning of discharge for cycle 95 was modeled in its initial state and all model parameters except a were assumed to be the same for the early cycle and extended cycle simulations.
4. Summary
Operando energy dispersive X-ray diffraction (EDXRD) was used to investigate the homogeneity of phase transition in a thick porous electrode (TPE) over extended high rate cycling. Three locations probed showed a homogeneous phase transition throughout the entirety of the TPE. Continuum modelling indicated homogenous lithiation across the electrode upon discharge at 1C consistent with the EDXRD results. Based on the experimental and modeling results from the 1st and 95th cycles, the capacity fade mechanism can be attributed to a combination of LVO particle fracture and loss of contact with the CNT. The absence of the beta phase peaks in the EDXRD over extended cycling are consistent with electrochemical accessibility of only part of the active material. The operando measurements along with continuum modeling results offer significant insights into the transport properties and capacity loss mechanism of LVO material in a highly porous matrix.Conflicts of interest
There are no conflicts to declare.Acknowledgements
The work described in these studies was funded as a part of the Center for Mesoscale Transport Properties, an Energy Frontier Research Center supported by the U.S. Department of Energy, Office of Science, Basic Energy Sciences, under award #DE-SC0012673. This research used resources of the Advanced Photon Source beamline 6-BM, a U.S. Department of Energy (DOE) Office of Science User Facility operated for the DOE Office of Science by Argonne National Laboratory under Contract No. DE-AC02-06CH113. Additionally, the electron microscopy measurements used resources of the Center for Functional Nanomaterials, which is a U.S. DOE Office of Science Facility, at Brookhaven National Laboratory under Contract No. DE-SC0012704. We acknowledge computing resources from Columbia University's Shared Research Computing Facility project, which is supported by NIH Research Facility Improvement grant 1G20RR030893-01, and associated funds from the New York State Empire State Development, Division of Science Technology and Innovation (NYSTAR) Contract C090171. A. H. M. and M. R. D. acknowledge the Graduate Assistance in Areas of National Need Fellowship (GAANN). E. S. T. acknowledges the William and Jane Knapp Chair in Energy and the Environment.References
- A. M. Bruck, L. Wang, A. B. Brady, D. M. Lutz, B. L. Hoff, K. Li, N. Stavinski, D. C. Bock, K. J. Takeuchi, E. S. Takeuchi and A. C. Marschilok, J. Phys. Chem. C, 2019, 123, 18834–18843 CrossRef CAS.
- Y. Zhou, X. Rui, W. Sun, Z. Xu, Y. Zhou, W. J. Ng, Q. Yan and E. Fong, ACS Nano, 2015, 9, 4628–4635 CrossRef CAS.
- J. Zheng, Q. Zhao, X. Liu, T. Tang, D. C. Bock, A. M. Bruck, K. R. Tallman, L. M. Housel, A. M. Kiss, A. C. Marschilok, E. S. Takeuchi, K. J. Takeuchi and L. A. Archer, ACS Energy Lett., 2019, 4, 271–275 CrossRef CAS.
- C.-J. Bae, C. K. Erdonmez, J. W. Halloran and Y.-M. Chiang, Adv. Mater., 2013, 25, 1254–1258 CrossRef CAS.
- Y. Zhu, Z. Ju, X. Zhang, D. M. Lutz, L. M. Housel, Y. Zhou, K. J. Takeuchi, E. S. Takeuchi, A. C. Marschilok and G. Yu, Adv. Mater., 2020, 32, 1907941 CrossRef CAS.
- X. Zhang, Z. Ju, L. M. Housel, L. Wang, Y. Zhu, G. Singh, N. Sadique, K. J. Takeuchi, E. S. Takeuchi, A. C. Marschilok and G. Yu, Nano Lett., 2019, 19, 8255–8261 CrossRef CAS.
- Z. Ju, Y. Zhu, X. Zhang, D. M. Lutz, Z. Fang, K. J. Takeuchi, E. S. Takeuchi, A. C. Marschilok and G. Yu, Chem. Mater., 2020, 32, 1684–1692 CrossRef CAS.
- L. Peng, Y. Zhu, X. Peng, Z. Fang, W. Chu, Y. Wang, Y. Xie, Y. Li, J. J. Cha and G. Yu, Nano Lett., 2017, 17, 6273–6279 CrossRef CAS.
- C. Yan, Y. Zhu, Z. Fang, C. Lv, X. Zhou, G. Chen and G. Yu, Adv. Energy Mater., 2018, 8, 1800762 CrossRef.
- C. Yan, Z. Fang, C. Lv, X. Zhou, G. Chen and G. Yu, ACS Nano, 2018, 12, 8670–8677 CrossRef CAS.
- L. Peng, Z. Fang, Y. Zhu, C. Yan and G. Yu, Adv. Energy Mater., 2018, 8, 1702179 CrossRef.
- Y. J. Lee, H. Yi, W.-J. Kim, K. Kang, D. S. Yun, M. S. Strano, G. Ceder and A. M. Belcher, Science, 2009, 324, 1051 CAS.
- Y. Kuang, C. Chen, D. Kirsch and L. Hu, Adv. Energy Mater., 2019, 9, 1901457 CrossRef.
- M. Singh, J. Kaiser and H. Hahn, J. Electrochem. Soc., 2015, 162, A1196–A1201 CrossRef CAS.
- A. Kwade, W. Haselrieder, R. Leithoff, A. Modlinger, F. Dietrich and K. Droeder, Nat. Energy, 2018, 3, 290–300 CrossRef.
- Q. Zhang, A. M. Bruck, D. C. Bock, J. Li, V. Sarbada, R. Hull, E. A. Stach, K. J. Takeuchi, E. S. Takeuchi and A. C. Marschilok, Phys. Chem. Chem. Phys., 2017, 19, 14160–14169 RSC.
- A. M. Bruck, N. W. Brady, C. N. Lininger, D. C. Bock, A. B. Brady, K. R. Tallman, C. D. Quilty, K. J. Takeuchi, E. S. Takeuchi, A. C. West and A. C. Marschilok, ACS Appl. Energy Mater., 2019, 2, 2561–2569 CrossRef CAS.
- P. F. Smith, K. J. Takeuchi, A. C. Marschilok and E. S. Takeuchi, Acc. Chem. Res., 2017, 50, 544–548 CrossRef CAS.
- C. Zhu, R. E. Usiskin, Y. Yu and J. Maier, Science, 2017, 358, eaao2808 CrossRef.
- K. Mayilvahanan, N. Brady, A. H. McCarthy, L. Wang, A. C. Marschilok, K. Takeuchi, E. Takeuchi and A. C. West, J. Electrochem. Soc., 2020, 167, 100503 CrossRef CAS.
- X. Zhang, Z. Ju, Y. Zhu, K. J. Takeuchi, E. S. Takeuchi, A. C. Marschilok and G. Yu, Adv. Energy Mater., 2020, 2000808 CrossRef.
- X.-L. Wu, L.-Y. Jiang, F.-F. Cao, Y.-G. Guo and L.-J. Wan, Adv. Mater., 2009, 21, 2710–2714 CrossRef CAS.
- L. Wang, L.-C. Zhang, I. Lieberwirth, H.-W. Xu and C.-H. Chen, Electrochem. Commun., 2010, 12, 52–55 CrossRef CAS.
- Y. H. Jung, C. H. Lim and D. K. Kim, J. Mater. Chem. A, 2013, 1, 11350–11354 RSC.
- K. Kang, Y. S. Meng, J. Bréger, C. P. Grey and G. Ceder, Science, 2006, 311, 977 CrossRef CAS.
- M. Ebner, D.-W. Chung, R. E. García and V. Wood, Adv. Energy Mater., 2014, 4, 1301278 CrossRef.
- X. Xu, F. Xiong, J. Meng, Q. An and L. Mai, Mater. Today Nano, 2020, 100073 CrossRef.
- M. S. Whittingham, J. Electrochem. Soc., 1976, 123, 315 CrossRef CAS.
- Y. Yang, L. Li, H. Fei, Z. Peng, G. Ruan and J. M. Tour, ACS Appl. Mater. Interfaces, 2014, 6, 9590–9594 CrossRef CAS.
- A. Marschilok, C.-Y. Lee, A. Subramanian, K. J. Takeuchi and E. S. Takeuchi, Energy Environ. Mater., 2011, 4, 2943–2951 CAS.
- C. Niu, X. Liu, J. Meng, L. Xu, M. Yan, X. Wang, G. Zhang, Z. Liu, X. Xu and L. Mai, Nano Energy, 2016, 27, 147–156 CrossRef CAS.
- D. Sun, G. Jin, H. Wang, P. Liu, Y. Ren, Y. Jiang, Y. Tang and X. Huang, J. Mater. Chem. A, 2014, 2, 12999–13005 RSC.
- S. Liang, J. Zhou, G. Fang, J. Liu, Y. Tang, X. Li and A. Pan, ACS Appl. Mater. Interfaces, 2013, 5, 8704–8709 CrossRef CAS.
- F. Hu, D. Xie, F. Cui, D. Zhang and G. Song, RSC Adv., 2019, 9, 20549–20556 RSC.
- L. Cao, L. Chen, Z. Huang, Y. Kuang, H. Zhou and Z. Chen, ChemElectroChem, 2016, 3, 122–129 CrossRef CAS.
- Z. Chen, F. Xu, S. Cao, Z. Li, H. Yang, X. Ai and Y. Cao, Small, 2017, 13, 1603148 CrossRef.
- Q. Shi, J. Liu, R. Hu, M. Zeng, M. Dai and M. Zhu, RSC Adv., 2012, 2, 7273–7278 RSC.
- A. Pan, J.-G. Zhang, G. Cao, S. Liang, C. Wang, Z. Nie, B. W. Arey, W. Xu, D. Liu, J. Xiao, G. Li and J. Liu, J. Mater. Chem., 2011, 21, 10077–10084 RSC.
- L. Zhu, L. Xie and X. Cao, ACS Appl. Mater. Interfaces, 2018, 10, 10909–10917 CrossRef CAS.
- Y. Zhang, A. C. Marschilok, K. J. Takeuchi, A. K. Kercher, E. S. Takeuchi and N. J. Dudney, Chem. Mater., 2019, 31, 6135–6144 CrossRef CAS.
- G. Pistoia, S. Panero, M. Tocci, R. V. Moshtev and V. Manev, Solid State Ionics, 1984, 13, 311–318 CrossRef CAS.
- Q. Zhang, A. B. Brady, C. J. Pelliccione, D. C. Bock, A. M. Bruck, J. Li, V. Sarbada, R. Hull, E. A. Stach, K. J. Takeuchi, E. S. Takeuchi, P. Liu and A. C. Marschilok, Chem. Mater., 2017, 29, 2364–2373 CrossRef CAS.
- H. Song, M. Luo and A. Wang, ACS Appl. Mater. Interfaces, 2017, 9, 2875–2882 CrossRef CAS.
- S. Jouanneau, A. Verbaere and D. Guyomard, J. Solid State Chem., 2005, 178, 22–27 CrossRef CAS.
- A. C. Marschilok, A. M. Bruck, A. Abraham, C. A. Stackhouse, K. J. Takeuchi, E. S. Takeuchi, M. Croft and J. W. Gallaway, Phys. Chem. Chem. Phys., 2020, 22, 20972–20989 RSC.
- H. Murayama, K. Kitada, K. Fukuda, A. Mitsui, K. Ohara, H. Arai, Y. Uchimoto, Z. Ogumi and E. Matsubara, J. Phys. Chem. C, 2014, 118, 20750–20755 CrossRef CAS.
- F. Sun, M. Osenberg, K. Dong, D. Zhou, A. Hilger, C. J. Jafta, S. Risse, Y. Lu, H. Markötter and I. Manke, ACS Energy Lett., 2018, 3, 356–365 CrossRef CAS.
- C. N. Lininger, A. M. Bruck, D. M. Lutz, L. M. Housel, K. J. Takeuchi, E. S. Takeuchi, A. Huq, A. C. Marschilok and A. C. West, Adv. Funct. Mater., 2019, 1907337 Search PubMed.
- N. W. Brady, Q. Zhang, A. Bruck, D. C. Bock, C. A. Gould, A. C. Marschilok, K. Takeuchi, E. Takeuchi and A. C. West, J. Electrochem. Soc., 2018, 165, A371–A379 CrossRef CAS.
- N. W. Brady, Q. Zhang, K. W. Knehr, P. Liu, A. C. Marschilok, K. J. Takeuchi, E. S. Takeuchi and A. C. West, J. Electrochem. Soc., 2016, 163, A2890–A2898 CrossRef CAS.
- R. Ramaraghavulu, K. Sivaiah and S. Buddhudu, Ferroelectrics, 2012, 432, 55–64 CrossRef CAS.
- R.-Z. Zhang, J.-Z. Luo, P.-J. Lu, K.-J. Zhu, T. Xie, P.-C. Wang, C.-B. Sun, F.-Y. Yang, Z.-Y. Xing, Y.-X. Wang and J. Liu, Ceram. Int., 2019, 45, 2968–2976 CrossRef CAS.
- L. Wang, J. Han, B. Sundahl, S. Thornton, Y. Zhu, R. Zhou, C. Jaye, H. Liu, Z.-Q. Li, G. T. Taylor, D. A. Fischer, J. Appenzeller, R. J. Harrison and S. S. Wong, Nanoscale, 2016, 8, 15553–15570 RSC.
- H. Murphy, P. Papakonstantinou and T. I. T. Okpalugo, J. Vac. Sci. Technol., B, 2006, 24, 715–720 CrossRef CAS.
- K. Y. Bae, G. D. Park, B. H. Kim, S. H. Cho, Y. C. Kang, K. D. Lee and W. Y. Yoon, J. Electrochem. Soc., 2018, 165, A2919–A2924 CrossRef CAS.
- Q. Zhang, A. K. Kercher, G. M. Veith, V. Sarbada, A. B. Brady, J. Li, E. A. Stach, R. Hull, K. J. Takeuchi, E. S. Takeuchi, N. J. Dudney and A. C. Marschilok, J. Electrochem. Soc., 2017, 164, A1503–A1513 CrossRef CAS.
- L. O. Valøen and J. N. Reimers, J. Electrochem. Soc., 2005, 152, A882 CrossRef.
Footnote |
| † Electronic supplementary information (ESI) available. See DOI: 10.1039/d0cp04622a |
| This journal is © the Owner Societies 2021 |

