 Open Access Article
Tracer diffusion coefficients of Li+ ions in c-axis oriented LixCoO2 thin films measured by secondary ion mass spectrometry
Gen
Hasegawa
ab,
Naoaki
Kuwata
 *ab,
Yoshinori
Tanaka
a,
Takamichi
Miyazaki
c,
Norikazu
Ishigaki†
b,
Kazunori
Takada
 a and
Junichi
Kawamura‡
 b
b
aNational Institute for Materials Science (NIMS), 1-1 Namiki, Tsukuba 305-0044, Japan. E-mail: KUWATA.Naoaki@nims.go.jp
bInstitute of Multidisciplinary Research for Advanced Materials, Tohoku University, 2-1-1 Katahira, Aobaku, Sendai 980-8577, Japan
cSchool of Engineering, Tohoku University, 6-6-11 Aramaki-aza Aoba, Aoba-ku, Sendai, 980-8579, Japan
First published on 19th January 2021
Abstract
Lithium diffusion is a key factor in determining the charge/discharge rate of Li-ion batteries. Herein, we study the tracer diffusion coefficient (D*) of lithium ions in the c-axis oriented LiCoO2 thin film using secondary ion mass spectrometry (SIMS). We applied a step-isotope-exchange method to determine D* in the Li-extracted LixCoO2. The observed values of D* ranged from 2 × 10⁻¹² to 3 × 10⁻¹⁷ cm2 s−1 depending on the compositions in the range of 0.4 < x < 1.0. Approaching the stoichiometric composition (x = 1.0), D* decreases steeply to the minimum, which can be explained by the vacancy diffusion mechanism. Electrochemically determined diffusion coefficients corrected by thermodynamic factors are found to be in good agreement with D* determined by our method, over a wide range of compositions. The c-axis diffusion was explained by the migration of Li+ ions from one layer to another through additional diffusion channels, such as antiphase boundaries and a pair of Li antisite and oxygen vacancies in cobalt oxide layers.
Introduction
The knowledge of the diffusion behaviour of Li+ ions in Li-insertion electrodes is essential for understanding the charge–discharge mechanism of the electrodes, which enables us to improve the performance of Li-ion batteries (LIBs). The layered structure of LiCoO2 (LCO), the best-known cathode material for LIBs, exhibits high rate capability and excellent cycle stability.5,6 LCO has shown excellent performance in solid-state batteries,7–9 making it attractive for a wide range of applications, including microelectronics and electric vehicles.10,11LCO has a two-dimensional diffusion path parallel to the ab-plane. The vacancy diffusion mechanism has been predicted by the density functional theory (DFT) calculations, and formation of divacancies has been found to reduce the activation energy (Ea) of Li+ ion migration.12–14 The calculations show that the diffusion coefficient in the ab-plane of Li0.6CoO2 is about 10−9 cm2 s−1,12,13 although there is some uncertainty in the absolute value. In the ideal LCO structure, there is no diffusion path in the c-axis direction. However, experimentally, Li ions can be extracted and inserted along the c-axis direction,9,15 which has been confirmed in the all-solid-state batteries based on c-axis oriented thin films4,7–9 and epitaxial thin films.16 Grain boundaries as a pathway for Li diffusion has been proposed by DFT calculations.17,18 Nanoscale atomic force microscopy also suggests fast Li diffusion near the grain boundaries.19–21 However, no direct measurement of the diffusion coefficient of lithium ions along the c-axis of LiCoO2 has been reported.
Diffusion coefficients of LCO have been reported so far by many authors, which were measured by electrochemical techniques as the chemical diffusion coefficients (![[D with combining tilde]](https://www.rsc.org/images/entities/i_char_0044_0303.gif) ). Table 1 summarizes the reported values of
). Table 1 summarizes the reported values of ![[D with combining tilde]](https://www.rsc.org/images/entities/i_char_0044_0303.gif) of LCO. The values of
of LCO. The values of ![[D with combining tilde]](https://www.rsc.org/images/entities/i_char_0044_0303.gif) reported in the literature vary from 10−13 to 10−8 cm2 s−1 for powders and 10−14 to 10−9 cm2 s−1 for thin films. The large discrepancies are attributed to the intrinsic uncertainty involved in the experiments.22 The electrochemical system involves multiple bulk and interfacial processes (e.g., ohmic resistances in the electrolyte, interfacial charge transfer resistance and side reactions23–26), which often make the analysis difficult. In addition, self-diffusion coefficients were measured by NMR and muon-spin relaxation techniques.27,28 These techniques estimate the jump rate of Li+ ions from the relaxation phenomena.
reported in the literature vary from 10−13 to 10−8 cm2 s−1 for powders and 10−14 to 10−9 cm2 s−1 for thin films. The large discrepancies are attributed to the intrinsic uncertainty involved in the experiments.22 The electrochemical system involves multiple bulk and interfacial processes (e.g., ohmic resistances in the electrolyte, interfacial charge transfer resistance and side reactions23–26), which often make the analysis difficult. In addition, self-diffusion coefficients were measured by NMR and muon-spin relaxation techniques.27,28 These techniques estimate the jump rate of Li+ ions from the relaxation phenomena.
| Sample | Technique |
![[D with combining tilde]](https://www.rsc.org/images/entities/i_char_0044_0303.gif) (cm2 s−1) (cm2 s−1) |
Li composition (potential) | Ref. |
|---|---|---|---|---|
| Powder | PITT | 5 × 10⁻⁹ | 0.2 < x < 0.8 | Mizushima5 |
| Powder | GITT, PITT | 2 × 10⁻⁹–4 × 10⁻⁸ | 0.10 < x < 1 | Honders39 |
| Powder | EIS | 5 × 10⁻⁸ | x = 0.65 | Thomas40 |
| Powder | GITT | 4 × 10⁻⁹–1 × 10⁻⁸ | 0.5 < x < 0.75 | Choi41 |
| Powder | PITT | 1 × 10⁻¹⁰–2 × 10⁻⁹ | 0.35 < x < 0.85 | Barker42 |
| Powder | PITT | 5 × 10⁻¹²–1 × 10⁻¹⁰ | 3.8–4.4 V | Aurbach43,44 |
| Powder | PITT | 10−13–10−12 | 0.5 < x < 0.95 | Okubo45 |
| Single particle | PITT, EIS | 10−10–10−7 | 3.8–4.2 V | Dokko24 |
| ESD film | GITT | 10−13–10−12 | N/A | Chen46 |
| PLD film | GITT | 1 × 10⁻¹⁰ | 4.0–4.04 V | Striebel47 |
| RF sp. film | GITT | 10−11 | N/A | Birke48 |
| Oxidation film | EIS, PITT | 10−12–10−8 | 0.7 < x < 1.0 | Sato49 |
| PLD film | PITT | 1 × 10⁻¹²–4 × 10⁻¹¹ | 0.5 < x < 0.95 | McGraw50 |
| RF sp. film | PITT | 10−11–10−10 | 0.45 < x < 0.7 | Jang51 |
| PLD film | EIS | 1 × 10⁻¹¹–5 × 10⁻¹⁰ | x = 0.7 | Iriyama52 |
| RF sp., PLD film | GITT, EIS | 10−14–10−4 | 0.5 < x < 1.0 | Bouwman53 |
| PLD film | EIS, PITT | 2 × 10⁻¹²–1 × 10⁻¹¹ | 0.47 < x < 0.71 | Xia15,54 |
| RF sp. film | PITT, EIS, GITT | 10−12–10−10 | 0.45 < x < 0.98 | Xie55 |
| PLD film | PITT, EIS | 6 × 10⁻¹³–8 × 10⁻¹² | 3.85–4.20 V | Tang56 |
| PLD epitaxial film | PITT | 1 × 10⁻¹⁴–2 × 10⁻¹² | 3.84–4.18 V | Shiraki57 |
| PLD film | PITT | 5 × 10⁻¹²–2 × 10⁻¹⁰ | 3.5–4.4 V | Matsuda9 |
We have developed a new technique to observe Li diffusion coefficients in electrode materials and solid electrolytes by combining isotope exchange and secondary ion mass spectrometry (SIMS).29–32 The tracer diffusion coefficient (D*) has been determined by analysing the distribution of Li isotopes. In particular, SIMS diffusion measurements have the following advantages: (1) application to electron–ion mixed conductors,33 (2) determination of interfacial exchange rates and bulk diffusion coefficients,34,35 and (3) application to grain boundary diffusion.36,37 To the best of our knowledge, this is the first report of a SIMS based study of tracer diffusion in LixCoO2.
In this study, we have conducted a detailed measurement on the composition dependence of D* and ![[D with combining tilde]](https://www.rsc.org/images/entities/i_char_0044_0303.gif) in c-axis oriented LixCoO2 thin films. We used a technique called the ‘step-isotope-exchange method’,32 which enables the tracer diffusion measurements on thin-film electrodes even at room temperature. Instead of the space profile measurement used so far,29,30 the time-dependence of the 6Li isotope concentration in the LixCoO2 thin film, which comes into contact with a 6Li-enriched electrolyte to exchange Li ions, was measured. Furthermore,
in c-axis oriented LixCoO2 thin films. We used a technique called the ‘step-isotope-exchange method’,32 which enables the tracer diffusion measurements on thin-film electrodes even at room temperature. Instead of the space profile measurement used so far,29,30 the time-dependence of the 6Li isotope concentration in the LixCoO2 thin film, which comes into contact with a 6Li-enriched electrolyte to exchange Li ions, was measured. Furthermore, ![[D with combining tilde]](https://www.rsc.org/images/entities/i_char_0044_0303.gif) was obtained using an electrochemical method. The diffusion kinetics of c-axis oriented LCO thin films will be discussed by comparing
was obtained using an electrochemical method. The diffusion kinetics of c-axis oriented LCO thin films will be discussed by comparing ![[D with combining tilde]](https://www.rsc.org/images/entities/i_char_0044_0303.gif) and D* and considering the effect of thermodynamic factors.
and D* and considering the effect of thermodynamic factors.
Methods
Sample preparation
Thin films of LCO were grown by pulsed laser deposition (PLD) as described in our previous papers.4,7,9 The LCO thin films were deposited on Pt (200 nm)/Cr (10 nm) coated SiO2 glass substrates using a Li1.2CoO2 pellet (TOSHIMA Manufacturing Co., Ltd) as a target in an oxygen atmosphere of 20 Pa with a substrate temperature of 500 °C. An ArF excimer laser (Coherent, COMPexPro 205) with a wavelength of 193 nm, a pulse energy of 200 mJ, a repetition rate of 15 Hz, and a fluence of 2 J cm−2 was used. The deposition time was 2.5 h. The thickness of the films was measured using a surface profilometer (Kosaka Laboratory, SE3000).The thin films were characterized by X-ray diffraction (XRD), micro Raman spectroscopy, and inductively coupled plasma atomic emission spectroscopy (ICP-AES) composition analysis. The XRD patterns of LixCoO2 thin films were recorded using an X-ray diffractometer (Rigaku, RINT-2100V) using CuKα radiation. The 2θ scan range was 10°–90° at a scan rate of 2.0° min−1. The Raman spectra of the LixCoO2 thin films were obtained using a micro-Raman spectrometer (Tokyo Instruments, Nanofinder30). A semiconductor laser, with a wavelength of 532 nm, was used for excitation at 2 μW output power. The composition of the LiCoO2 thin film was analysed by ICP-AES (PerkinElmer, Optima 3300XL) by dissolving the thin films into aqua regia. The composition of the film was found to be Co![[thin space (1/6-em)]](https://www.rsc.org/images/entities/char_2009.gif) :
:![[thin space (1/6-em)]](https://www.rsc.org/images/entities/char_2009.gif) Li = 1
Li = 1![[thin space (1/6-em)]](https://www.rsc.org/images/entities/char_2009.gif) :
:![[thin space (1/6-em)]](https://www.rsc.org/images/entities/char_2009.gif) 1.03 ± 0.02. The chemical composition was found to be close to the stoichiometry of LiCoO2.
1.03 ± 0.02. The chemical composition was found to be close to the stoichiometry of LiCoO2.
The lithium composition (x) in the LixCoO2 thin film was controlled electrochemically using a three-electrode beaker cell.30,38 Metallic lithium was used as the counter and reference electrodes. The electrolyte used was 1 mol L−1 LiClO4 in propylene carbonate (PC) (Tomiyama Pure Chemical Industries). The electrochemical measurements were performed using a potentiostat/galvanostat (Bio-Logic, VMP3). The potentiostatic intermittent titration technique (PITT) measurements were also performed using the three-electrode beaker cell. The applied potential step was 10 mV. The electric current as a function of time was measured for 1000 s.
The Li isotope ratio of the starting materials of LCO, Li and LiClO4 was the natural abundance (natLi: 92.4% 7Li and 7.6% 6Li). For the isotope ion-exchange, 6Li-enriched LiClO4 was synthesized according to a previously reported procedure.32,58 An aqueous solution of HClO4 (Wako Pure Chemical) was added dropwise to 6Li2CO3 (95% 6Li, 5% 7Li, Cambridge Isotope Laboratories. Inc.) until the white solid dissolved. The resultant 6LiClO4 powder was vacuum dried at 200 °C. 6LiClO4 was dissolved in PC (Kishida Chemical) in a glove box to obtain 1 mol L−1 6LiClO4/PC solution.23
Step-isotope-exchange method
A recently developed ‘step-isotope-exchange method’32 was used to measure the tracer diffusion coefficient. Fig. 1 shows an illustration of the step-isotope-exchange method. First, a part of the thin film was immersed in the solution for a time step, Δt. Then, an additional 0.5 mm of the sample was immersed for time, Δt. Repeating this procedure, the sample was divided into several regions with different ion exchange times. The isotope ratio, 6Li/(6Li + 7Li), was determined by SIMS line analysis. A double focusing-type SIMS (CAMECA, IMS 7f) was used. The primary ion beam was composed of Cs+ ions with a current of 1 nA and a voltage of 15 keV; the spot size of the focused ion beam was 1 μm. Point spacing of the line analysis was 100 μm and the analysis area was 10 × 10 μm2. The isotope ratio was determined from the ratio of the intensities of 6Li and 7Li whose ionization efficiencies are the same.The principles of the step-isotope-exchange method have been explained in detail in a previous paper,32 so we will briefly describe them here. The isotope ratio in the LixCoO2 thin film depends on the distance z from the surface and the time t.23,59 Assuming the diffusion-controlled process, the isotope ratio in the film is described by the diffusion equation,
 | (1) |
 | (2) |
In general, the interfacial exchange-rate between the LixCoO2 thin film and the electrolyte needs to be considered. The boundary condition of the diffusion equation is modified by including both the diffusion and the exchange-rate effects and the following solution is derived:23,59
 | (3) |
 | (4) |
![[thin space (1/6-em)]](https://www.rsc.org/images/entities/char_2009.gif) tan
tan![[thin space (1/6-em)]](https://www.rsc.org/images/entities/char_2009.gif) b = Λ. The large values of Λ are characteristic of the diffusion-controlled process. In contrast, in the case of the exchange-rate-controlled limit, it follows that
b = Λ. The large values of Λ are characteristic of the diffusion-controlled process. In contrast, in the case of the exchange-rate-controlled limit, it follows that | (5) |
PITT measurements
The chemical diffusion coefficient (![[D with combining tilde]](https://www.rsc.org/images/entities/i_char_0044_0303.gif) ) was measured by PITT.60,61 In the case of the diffusion-controlled process, under the assumptions required for PITT,60,61 the time-dependent electric current I(t) is found to be
) was measured by PITT.60,61 In the case of the diffusion-controlled process, under the assumptions required for PITT,60,61 the time-dependent electric current I(t) is found to be | (6) |
Considering the exchange-controlled case, the following equation is given as:23
 | (7) |
![[k with combining tilde]](https://www.rsc.org/images/entities/i_char_006b_0303.gif) is the chemical exchange rate. In this extreme case, only the chemical exchange rate
is the chemical exchange rate. In this extreme case, only the chemical exchange rate ![[k with combining tilde]](https://www.rsc.org/images/entities/i_char_006b_0303.gif) can be obtained.
can be obtained.
DFT calculations
To consider the probability of Li diffusion in LCO through the grain boundaries, we carried out DFT calculations using the Vienna Ab initio Simulation package (VASP).62 The interaction between ions and electrons was described using the projector augmented wave (PAW) method. The wave function was expanded in plane waves using a 400 eV cut off and the Brillouin zone was sampled at the Γ point. Exchange and correlation effects were incorporated within the generalized gradient approximation (GGA), using a Perdew–Burke–Ernzerhof gradient-corrected functional.63 The aspherical contribution to the gradient corrections inside the PAW spheres was taken into account.64 In all calculations, self-consistency was achieved with a tolerance of 10−3 eV Å−1 and 10−7 eV for the ionic and electronic loops, respectively. The migration of selected defects in LCO was studied using the climbing-image nudged elastic-band (NEB) method65,66 with 5 images. A periodic supercell approach was used to model the antiphase boundaries (APBs). The (100) boundary was modelled in a 4 × 4 × 1 (4a, 4b, c) supercell of bulk LCO and the boundary is prepared by shifting the atoms in the half of the cell (2 × 4 × 1) to [0 0 0.5]. Here, a, b, and c are the lattice vectors of bulk LCO respectively.67 All the calculated inner coordinates were optimized in the experimental lattice parameters. The (110) boundary was modelled in a 2 × 4 × 1 supercell of new basis vector of (a − b, a + b, c) and the boundary was prepared by shifting half of the cell (2 × 2 × 1) to [0 0 0.5].Results and discussion
Characterization of the LixCoO2 thin films
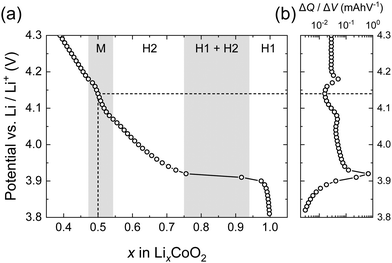
Fig. 2 shows the electrochemical properties of the LCO thin films obtained by PITT. The characteristic features of LCO thin films obtained were found to be consistent with previous reports.4,9 The potential vs. composition plot (coulometric titration curve) was obtained by integrating the incremental capacities (ΔQ/ΔV). The method of obtaining the potential vs. Li composition plot from the PITT experiment was performed according to that of Jang et al.51 The data are normalized so that the minimum of ΔQ/ΔV falls at x = 0.5 corresponding to V = 4.14 V and x = 1.0 corresponding to V = 3.82 V, based on the phase diagram of LixCoO2.1 The incremental capacitance indicates a large peak at 3.9 V corresponding to the first-order transition between the two hexagonal phases (H1 and H2). Above 4 V, the incremental capacitance shows two small peaks associated with the order/disorder transition at compositions close to Li0.5CoO2.1,51Fig. 3(a) shows ex situ XRD patterns of the LCO thin films. Highly (003) oriented XRD patterns were observed, which confirm the c-axis orientation of the LCO thin films. As the maintained potential increased, the c-axis lattice parameter of the LixCoO2 thin films increased. The c-axis lattice constant of the as-prepared LCO film was 14.04 Å, which then increases up to 14.37 Å at 4.15 V. The variation of the lattice parameter was in good agreement with values of the bulk LCO reported in the literature,1,2 as shown in Fig. 3(b).
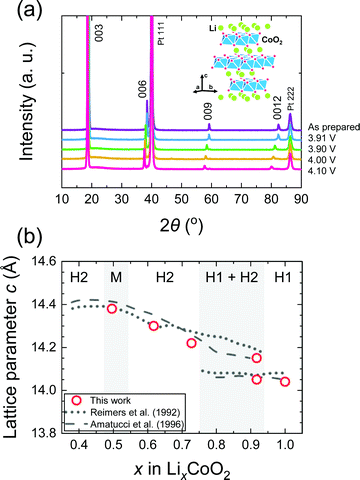 | ||
| Fig. 3 (a) Ex situ XRD pattern of LixCoO2 thin films with a schematic of the crystal structure of LiCoO2 and (b) the c-axis lattice parameter compared with literature data. The samples were prepared at 3.91, 3.93, 4.00 and 4.15 V, respectively. As the potential increases, the c-axis lattice parameter increases. The change in the lattice parameters is in good agreement with values of the bulk LCO reported in the literature.1–4 | ||
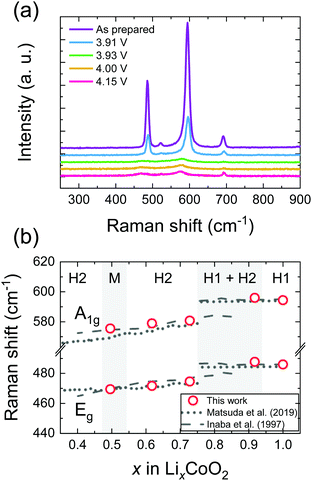
Fig. 4(a) shows the ex situ Raman spectra of LixCoO2 thin films. The Raman active modes of LCO were observed at 595 cm−1 (A1g) and 486 cm−1 (Eg), respectively. As the potential increases, the Raman peaks shift to lower wave numbers and decrease in intensity. These results are in good agreement with previous reports for LixCoO2 by ex situ3 and in situ4 Raman spectroscopy as shown in Fig. 4(b). In addition, small peaks due to Co3O4 were identified at 520 cm−1 (T2g) and 690 cm−1 (A1g), which was attributed to the trace amount of cobalt oxide near the substrates.4
Tracer diffusion coefficient of the LixCoO2 thin films
Fig. 5 shows the SIMS line profile of the Li0.84CoO2 thin film prepared by the step-isotope-exchange method. The Li composition x = 0.84 was determined from the potential–composition plot at 3.915 V. A stepwise change in the isotope ratio after 0.5 mm intervals is observed. At each step position, the isotope exchange time varies by Δt = 360 s. The position was converted to the ion-exchange time, and eqn (2) was used to fit the experimental data. The theoretical curve assuming the diffusion control was in good agreement with the experiment, which gives the tracer diffusion coefficient of Li to be D* = 4.9 × 10⁻¹³ cm2 s−1 at x = 0.84.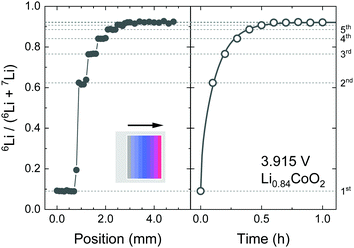 | ||
| Fig. 5 SIMS analysis of the Li0.84CoO2 thin film prepared by the step-isotope-exchange method; (left) isotope profile measured by line analysis, and (right) time evolution of the isotope ratio. The solid line shows the fitting curve using eqn (2). The parameters for fitting were as follows; C0 = 0.08, Cs = 0.95, D* = 4.9 × 10⁻¹³ cm2 s−1, and L = 240 nm. | ||
Fig. 6 shows the results of the step-isotope-exchange method for different compositions. The results were analysed for both diffusion-controlled and exchange-rate-controlled cases. For compositions 0.98 > x > 0.92, the data were fitted better by the diffusion-controlled form of eqn (2). For fast diffusion cases (0.72 > x > 0.50), both eqn (2) and (5) agree with the experimental data.
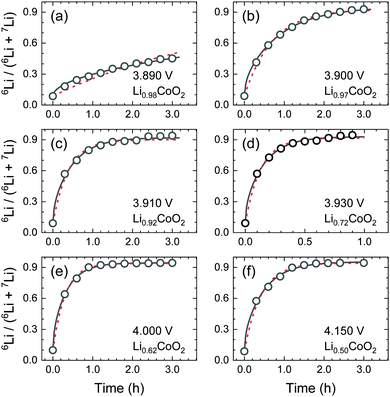 | ||
| Fig. 6 Ion-exchange time dependence of the 6Li/(6Li + 7Li) isotope ratio in the LixCoO2 thin films: (a–f) correspond to x = 0.98, 0.97, 0.92, 0.73, 0.62, and 0.50, respectively. The black solid lines show fitting curves for the diffusion-controlled case using eqn (2). The red broken lines indicate the exchange-rate controlled case using eqn (5). | ||
As discussed in the next paragraph, k is estimated to be fast. Therefore, the diffusion-controlled condition is also valid for the composition of 0.72 > x > 0.50. Hence, the diffusion coefficients can be determined from the step-isotope-exchange experiments and eqn (2). Table 2 summarizes the D* values determined from these experiments.
| Potential (V) | x in LixCoO2 | Phase | Thickness (nm) | D* (cm2 s−1) |
|---|---|---|---|---|
| 4.230 | 0.437 | H2 | 320 | 7.2 × 10⁻¹³ |
| 4.151 | 0.496 | M | 690 | 1.0 × 10⁻¹² |
| 4.050 | 0.566 | H2 | 430 | 1.7 × 10⁻¹² |
| 4.002 | 0.616 | H2 | 690 | 1.5 × 10⁻¹² |
| 3.970 | 0.656 | H2 | 280 | 7.0 × 10⁻¹³ |
| 3.931 | 0.725 | H2 | 290 | 5.7 × 10⁻¹³ |
| 3.930 | 0.726 | H2 | 660 | 1.1 × 10⁻¹² |
| 3.915 | 0.834 | H1 + H2 | 420 | 3.5 × 10⁻¹³ |
| 3.915 | 0.843 | H1 + H2 | 240 | 4.9 × 10⁻¹³ |
| 3.910 | 0.917 | H1 | 560 | 6.9 × 10⁻¹³ |
| 3.905 | 0.945 | H1 | 460 | 4.7 × 10⁻¹³ |
| 3.905 | 0.944 | H1 | 470 | 2.3 × 10⁻¹³ |
| 3.900 | 0.973 | H1 | 460 | 2.5 × 10⁻¹³ |
| 3.890 | 0.984 | H1 | 350 | 1.6 × 10⁻¹⁴ |
Here, we estimate the parameter Λ to evaluate the dominant process. The isotope exchange rate k is related to the exchange current density i0 by i0 = FC0k,23,34 where C0 is the molar concentration of Li in LCO, which is 0.055 mol cm−3 at stoichiometry. The value of i0 can be estimated from the charge-transfer resistance (Rct) via the Butler–Volmer equation. In the literature, the values of Rct = 7–14 Ω cm2 have been reported for LixCoO2 thin films at 4.0 V,52 where the Li composition x is 0.6. The exchange rate k is, therefore, estimated to be 0.6–1 × 10⁻⁶ cm s−1. If the thickness L is 500 nm and D* is 1 × 10⁻¹² cm2 s−1, then the parameter Λ is calculated to be 30–60. Thus, the diffusion-controlled condition (Λ > 10) is satisfied. The assumption of diffusion control is found to be more plausible.
In the vicinity of the stoichiometric composition, the values of D* become significantly low. In this case, the conventional depth profile analysis68,69 can be applied. Fig. 7 shows the SIMS depth profile of LixCoO2 thin films (x = 0.995 and 0.999). We analysed the depth profile by assuming a semi-infinite solution of the diffusion equation considering both diffusion and exchange:59
 | (8) |
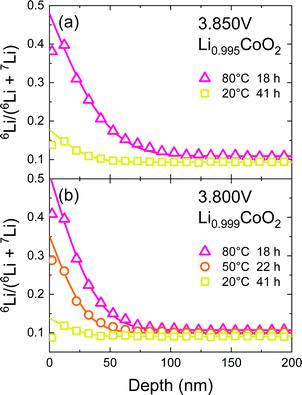 | ||
| Fig. 7 SIMS depth profile of the LixCoO2 thin film (x = 0.995 and 0.999). The potential of the sample was kept at 3.85 or 3.80 V for 12 h. Then, isotope ion-exchange was carried out in 6LiClO4/PC solution. Solid lines show the fitting curve based on eqn (8). | ||
| Potential (V) | x in LixCoO2 | Temp. (°C) | Diff. time (h) | D* (cm2 s−1) | k (cm s−1) |
|---|---|---|---|---|---|
| 3.85 | 0.995 | 80 | 18 | 1.6 × 10⁻¹⁶ | 3.3 × 10⁻¹¹ |
| 3.85 | 0.995 | 20 | 41 | 3.0 × 10⁻¹⁷ | 1.5 × 10⁻¹² |
| 3.80 | 0.999 | 80 | 18 | 9.7 × 10⁻¹⁷ | 3.1 × 10⁻¹¹ |
| 3.80 | 0.999 | 40 | 22 | 5.1 × 10⁻¹⁷ | 9.8 × 10⁻¹² |
| 3.80 | 0.999 | 20 | 41 | 3.0 × 10⁻¹⁷ | 7.5 × 10⁻¹³ |
Fig. 8 shows D* as a function of x in the LixCoO2 thin films. For the composition near stoichiometry (0.94 < x < 1.0), the value of D* drastically changes from 10−17 to 10−13 cm2 s−1. This behaviour can be explained by the vacancy diffusion mechanism. In the vacancy diffusion mechanism, the Li+ ions can jump only when the neighbouring site is vacant. Then, D* is proportional to the probability of the vacant Li site, i.e. (1 − x). Therefore, D* can be written as,14,32
| D* = (1 − x)ρd2Γ = D0(1 − x), | (9) |
![[D with combining tilde]](https://www.rsc.org/images/entities/i_char_0044_0303.gif) , which determines Li deintercalation rate, is almost unchanged. This is because the vacancy blocking factor is cancelled by the thermodynamic factor due to the effect of entropy.
, which determines Li deintercalation rate, is almost unchanged. This is because the vacancy blocking factor is cancelled by the thermodynamic factor due to the effect of entropy.
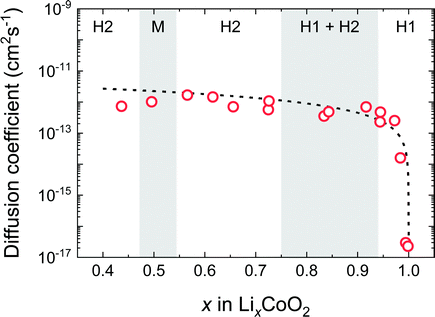 | ||
| Fig. 8 Composition dependence of the tracer diffusion coefficient D* of LixCoO2 thin films. Open red circles correspond to D* in the c-axis direction. The broken line shows the curve of eqn (9) based on the vacancy diffusion mechanism. | ||
Model of c-axis diffusion in the LixCoO2 thin film
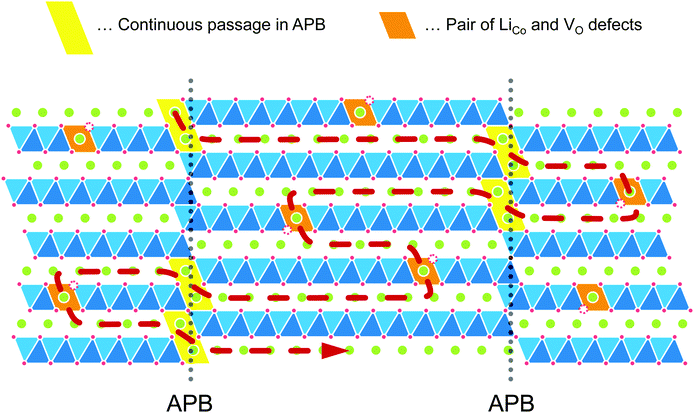
In the layered LCO, in-plane diffusion is expected to be fast, but diffusion through the layers is unlikely to occur. Direct penetration through the CoO2 sheet has a significantly high energy barrier (6.8 eV).21 Therefore, we propose a model to explain the Li+ ion diffusion in the c-axis, as shown in Fig. 9. This model assumes that Li+ ions can diffuse through the possible antiphase boundaries (APBs) or the defects in the CoO2 layer. Continuous diffusion through the same APB is prevented because the APB will be periodically blocked by the CoO2 layer. For the long-range c-axis transport, the Li+ ions need to move from one APB to another APB through diffusion parallel to the ab-plane. Even in the case of anti-site defects in the CoO2 layer, the Li+ ions would move from one defect to another through ab-plane diffusion. As a result, Li+ ions diffuse along the c-axis through the CoO2 layer. Here, the length of the Li+ ion diffusion is much longer than the c-axis distance. Hence, the diffusion coefficient will be much smaller than the direct penetration. This model can explain the behaviour of observed D* proportional to the vacancy concentration because the c-axis diffusion (D*) depends on the ab-plane diffusion (Dab). The model also explains the small Ea, despite the low value of D*, because the Ea reflects the migration barrier in the ab plane.To validate the models mentioned above, we performed DFT calculations for the diffusion of Li+ ions in the possible defects. First, the diffusion along the ab-plane direction was calculated. The results show that the migration energy barrier is 0.7 eV for the single vacancy and 0.3 eV for the divacancy models. These values are in good agreement with previous reports.12,13
Next, the diffusion through the APB was calculated. The APB structure is understood as a stacking fault with a relative displacement of a 1/2 unit cell along the [001] direction. Fig. 10(a) shows a schematic of the (100) boundary. The calculation results show that the (100) and (110) boundaries are stable with a low formation energy of 0.08 eV Å−2, and 0.05 eV Å−2, respectively (consistent with the literature21). The continuous downward passage in the (100) boundary shows a relatively low energy barrier, which is 0.9 eV for single vacancy and 0.6 eV for divacancy models. However, it should be noted that the diffusion in the (100) boundary is interrupted by the CoO2 block, which periodically appears in the (100) boundary. The migration energy barrier for (110) boundary is 0.9 eV for the single vacancy model. The divacancy model cannot function in the (110) boundary.
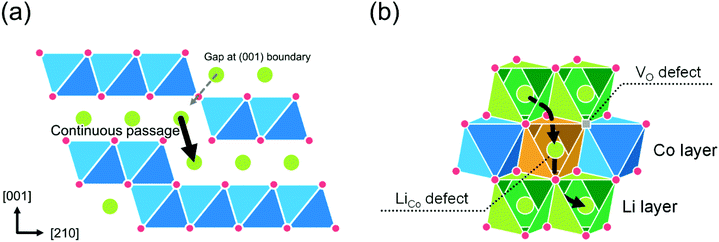 | ||
| Fig. 10 Schematic models of defects for c-axis diffusion in the LCO thin films: (a) a model of the APB along (100) plane and (b) a model for the pair of LiCo and VO defects in the CoO2 layer. | ||
Finally, the diffusion through defects in the CoO2 layer was calculated. The defect model was proposed by Levasseur et al.70 for the lithium overstoichiometric samples, where the excess Li replace the cobalt ions (antisite defects, LiCo), and the charge is compensated by oxygen vacancies (VO). Fig. 10(b) shows a schematic of the pair of LiCo and VO defects in the CoO2 layer. The calculated energy barriers through the pair of defects are 1.0 eV for single vacancy, 0.5 eV for divacancy, and 0.4 eV for triple vacancy models, respectively. The diffusion energy barrier through a pair of LiCo and VO defects shows a sharp decrease in the energy for Li+ ions to cross the CoO2 sheet.
The DFT calculations show that Li+ ions can penetrate the CoO2 layer through these defects. However, due to the small number of defects, the probability is low. Therefore, Li+ ions will diffuse longer distances, resulting in the lower diffusion coefficient. These models explain well the values of D* along the c-axis obtained by the tracer diffusion experiments.
Comparison of tracer and chemical diffusion coefficients
Fig. 11 shows the chemical diffusion coefficient![[D with combining tilde]](https://www.rsc.org/images/entities/i_char_0044_0303.gif) of the LixCoO2 thin film obtained by PITT. The composition dependence of
of the LixCoO2 thin film obtained by PITT. The composition dependence of ![[D with combining tilde]](https://www.rsc.org/images/entities/i_char_0044_0303.gif) is different from that of D* because of the following reasons: (1) the decrease in the
is different from that of D* because of the following reasons: (1) the decrease in the ![[D with combining tilde]](https://www.rsc.org/images/entities/i_char_0044_0303.gif) near the stoichiometric composition (x = 1) is small, (2) the
near the stoichiometric composition (x = 1) is small, (2) the ![[D with combining tilde]](https://www.rsc.org/images/entities/i_char_0044_0303.gif) shows a maximum value at the M phase (x = 0.5), and (3) the value of
shows a maximum value at the M phase (x = 0.5), and (3) the value of ![[D with combining tilde]](https://www.rsc.org/images/entities/i_char_0044_0303.gif) shows two local minima at x = 0.53 and 0.48, which are associated with the order/disorder transitions near Li0.5CoO2. These behaviours are in good agreement with previous studies.9,51 Note that in the two-phase coexistence region, the measurement of
shows two local minima at x = 0.53 and 0.48, which are associated with the order/disorder transitions near Li0.5CoO2. These behaviours are in good agreement with previous studies.9,51 Note that in the two-phase coexistence region, the measurement of ![[D with combining tilde]](https://www.rsc.org/images/entities/i_char_0044_0303.gif) by PITT is difficult because of the transient behaviour in the two different phases.
by PITT is difficult because of the transient behaviour in the two different phases.
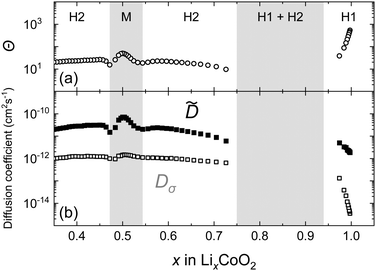 | ||
Fig. 11 Li composition x dependence of the thermodynamic factors (Θ), chemical diffusion coefficients (![[D with combining tilde]](https://www.rsc.org/images/entities/i_char_0044_0303.gif) ), and conductivity diffusion coefficients (Dσ) for LixCoO2 thin films measured by PITT. ), and conductivity diffusion coefficients (Dσ) for LixCoO2 thin films measured by PITT. | ||
Since the driving force for diffusion is the chemical potential of Li (μLi), ![[D with combining tilde]](https://www.rsc.org/images/entities/i_char_0044_0303.gif) is enhanced by a thermodynamic factor Θ. According to the theory for the mixed conductors,60 the following relationship holds for:
is enhanced by a thermodynamic factor Θ. According to the theory for the mixed conductors,60 the following relationship holds for:
![[D with combining tilde]](https://www.rsc.org/images/entities/i_char_0044_0303.gif) = ΘDσ, = ΘDσ, | (10) |
 | (11) |
 | (12) |
The composition dependence of Θ in the LixCoO2 thin films is also shown in Fig. 11. Θ shows a large value where the slope of the composition-OCV curve is large. Near the stoichiometric composition, Θ increases significantly up to 103. Thus, ![[D with combining tilde]](https://www.rsc.org/images/entities/i_char_0044_0303.gif) is greatly enhanced near the stoichiometry. In an ideal intercalation compound (i.e., a lattice gas model with non-interacting particles72), the thermodynamic factor is represented as Θ = 1/(1 − x),72,73 which is derived from the entropy term. Therefore, the large value of Θ near stoichiometric composition is reasonable. The constant values of
is greatly enhanced near the stoichiometry. In an ideal intercalation compound (i.e., a lattice gas model with non-interacting particles72), the thermodynamic factor is represented as Θ = 1/(1 − x),72,73 which is derived from the entropy term. Therefore, the large value of Θ near stoichiometric composition is reasonable. The constant values of ![[D with combining tilde]](https://www.rsc.org/images/entities/i_char_0044_0303.gif) in the H1 phase are attributed to the cancellation of the thermodynamic and the vacancy blocking factors.
in the H1 phase are attributed to the cancellation of the thermodynamic and the vacancy blocking factors.
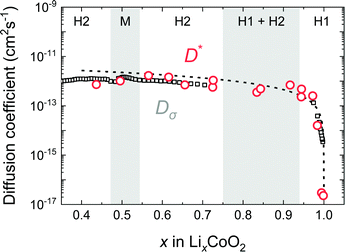
Fig. 12 shows the composition dependence of Dσ obtained from PITT using eqn (10) and that of D* obtained from SIMS experiments. The values of D* and Dσ agree well in the compositional range of 0.45 < x < 1.0. The composition dependence of Dσ is also consistent with the vacancy diffusion mechanism shown by the solid dashed line. In the c-axis diffusion coefficient of LixCoO2, Dσ ≈ D* is clearly demonstrated.
Finally, we discuss the large discrepancy in the reported ![[D with combining tilde]](https://www.rsc.org/images/entities/i_char_0044_0303.gif) in Table 1 obtained by the electrochemical methods. There are two main reasons for this: (1) the influence of the surface exchange rates and (2) the effect of the anisotropy of the diffusion coefficient characteristic in LCO. If the interfacial resistance is too large, the index Λ in eqn (4) is dominated by k. Then, the I–t curve in the PITT experiment shows the exponential decay as eqn (7), which is indistinguishable from the long-time domain of the diffusion-controlled case. As a result, small apparent D would be observed. In addition, considerably fast diffusion is also challenging to be measured. Assuming L of 1 μm and k of 10−6 cm s−1, D should be less than 10−11 cm2 s−1 to satisfy the conditions for Λ > 10. To measure faster D, L needs to be further increased. Another reason is the anisotropic diffusion in LCO. The
in Table 1 obtained by the electrochemical methods. There are two main reasons for this: (1) the influence of the surface exchange rates and (2) the effect of the anisotropy of the diffusion coefficient characteristic in LCO. If the interfacial resistance is too large, the index Λ in eqn (4) is dominated by k. Then, the I–t curve in the PITT experiment shows the exponential decay as eqn (7), which is indistinguishable from the long-time domain of the diffusion-controlled case. As a result, small apparent D would be observed. In addition, considerably fast diffusion is also challenging to be measured. Assuming L of 1 μm and k of 10−6 cm s−1, D should be less than 10−11 cm2 s−1 to satisfy the conditions for Λ > 10. To measure faster D, L needs to be further increased. Another reason is the anisotropic diffusion in LCO. The ![[D with combining tilde]](https://www.rsc.org/images/entities/i_char_0044_0303.gif) values reported for the powder samples (10−10–10−8 cm2 s−1)5,39–42 are several orders of magnitude higher than those for the c-axis oriented thin films (10−14–10−10 cm2 s−1),9,15,50,52,54,56,57 which must be the effect of ab-plane diffusion. However, in the case of powder electrodes, the diffusion length may be misidentified due to solution immersion, and the value of
values reported for the powder samples (10−10–10−8 cm2 s−1)5,39–42 are several orders of magnitude higher than those for the c-axis oriented thin films (10−14–10−10 cm2 s−1),9,15,50,52,54,56,57 which must be the effect of ab-plane diffusion. However, in the case of powder electrodes, the diffusion length may be misidentified due to solution immersion, and the value of ![[D with combining tilde]](https://www.rsc.org/images/entities/i_char_0044_0303.gif) will be overestimated. Single-crystal electrodes will provide a well-defined geometry, though they are not easily available. If suitable sized single crystals are available, direct evidence of ab-plane diffusion in LixCoO2 can be obtained by the tracer diffusion technique. We are currently studying ab-plane diffusion using LCO single crystals, which will be published in the near future.
will be overestimated. Single-crystal electrodes will provide a well-defined geometry, though they are not easily available. If suitable sized single crystals are available, direct evidence of ab-plane diffusion in LixCoO2 can be obtained by the tracer diffusion technique. We are currently studying ab-plane diffusion using LCO single crystals, which will be published in the near future.
Conclusions
The tracer diffusion coefficient D* of the c-axis oriented LixCoO2 thin films was investigated by the step-isotope-exchange method in conjunction with SIMS analysis. The isotope exchange method has enabled us to investigate the tracer diffusion and interfacial exchange rate in the cathode materials of Li-ion batteries. The D* values for the c-axis direction ranged from 10−17 to 10−12 cm2 s−1 for the c-axis oriented LixCoO2 thin films (0.4 < x < 1.0). DFT calculations showed the low migration energy barrier for diffusion of Li+ ions through the APBs or defects in the CoO2 layer. The c-axis diffusion of Li+ ions occurs from one layer to another layer through these defects in the LCO thin films. The composition dependence of D* is explained by the vacancy diffusion mechanism. The conductivity diffusion coefficient Dσ obtained by PITT experiments was found to be in good agreement with D* over a wide range of compositions. The ion-exchange SIMS technique is suitable for studying lithium-ion battery materials, especially electron–ion mixed conductors.Conflicts of interest
There are no conflicts to declare.Acknowledgements
This work was supported by JSPS KAKENHI, Grant Numbers 17K19134 and 19H05814. For the SIMS experiment, we thank the ‘Center for Fusion Research of Nano-Interface Devices, Tohoku University’ of ‘Low-Carbon Research Network’ funded by MEXT (Ministry of Education, Culture, Sports, Science and Technology), Japan. The SIMS measurements were also performed at the National Institute for Materials Science (NIMS) Battery Research Platform. The computation in this study was performed on Numerical Materials Simulator at NIMS. This study was also supported by the JST ALCA-SPRING (Specially Promoted Research for Innovative Next Generation Batteries) Project, Grant Number JPMJAL1301.Notes and references
- J. N. Reimers and J. R. Dahn, J. Electrochem. Soc., 1992, 139, 2091–2097 CrossRef CAS.
- G. G. Amatucci, J. Electrochem. Soc., 1996, 143, 1114 CrossRef CAS.
- M. Inaba, Y. Iriyama, Z. Ogumi, Y. Todzuka and A. Tasaka, J. Raman Spectrosc., 1997, 28, 613–617 CrossRef CAS.
- Y. Matsuda, N. Kuwata, T. Okawa, A. Dorai, O. Kamishima and J. Kawamura, Solid State Ionics, 2019, 335, 7–14 CrossRef CAS.
- K. Mizushima, P. C. Jones, P. J. Wiseman and J. B. Goodenough, Mater. Res. Bull., 1980, 15, 783–789 CrossRef CAS.
- J. M. Tarascon and M. Armand, Nature, 2001, 414, 359–367 CrossRef CAS.
- N. Kuwata, N. Iwagami, Y. Tanji, Y. Matsuda and J. Kawamura, J. Electrochem. Soc., 2010, 157, A521–A527 CrossRef CAS.
- N. Kuwata, J. Kawamura, K. Toribami, T. Hattori and N. Sata, Electrochem. Commun., 2004, 6, 417–421 CrossRef CAS.
- Y. Matsuda, N. Kuwata and J. Kawamura, Solid State Ionics, 2018, 320, 38–44 CrossRef CAS.
- J. Bates, Solid State Ionics, 2000, 135, 33–45 CrossRef CAS.
- K. Takada, Acta Mater., 2013, 61, 759–770 CrossRef CAS.
- A. Van der Ven and G. Ceder, Electrochem. Solid-State Lett., 2000, 3, 301–304 CrossRef CAS.
- A. Van der Ven, G. Ceder, M. Asta and P. D. Tepesch, Phys. Rev. B: Condens. Matter Mater. Phys., 2001, 64, 184307 CrossRef.
- A. Van der Ven, J. Bhattacharya and A. A. Belak, Acc. Chem. Res., 2013, 46, 1216–1225 CrossRef CAS.
- H. Xia and L. Lu, Electrochim. Acta, 2007, 52, 7014–7021 CrossRef CAS.
- S. Shiraki, T. Shirasawa, T. Suzuki, H. Kawasoko, R. Shimizu and T. Hitosugi, ACS Appl. Mater. Interfaces, 2018, 10, 41732–41737 CrossRef CAS.
- H. Moriwake, A. Kuwabara, C. A. J. Fisher, R. Huang, T. Hitosugi, Y. H. Ikuhara, H. Oki and Y. Ikuhara, Adv. Mater., 2013, 25, 618–622 CrossRef CAS.
- P.-V. Ong, Z. Yang, P. V. Sushko and Y. Du, J. Phys. Chem. Lett., 2018, 9, 5515–5520 CrossRef CAS.
- N. Balke, S. Jesse, A. N. Morozovska, E. Eliseev, D. W. Chung, Y. Kim, L. Adamczyk, R. E. García, N. Dudney and S. V. Kalinin, Nat. Nanotechnol., 2010, 5, 749–754 CrossRef CAS.
- N. Balke, S. Kalnaus, N. J. Dudney, C. Daniel, S. Jesse and S. V. Kalinin, Nano Lett., 2012, 12, 3399–3403 CrossRef CAS.
- X. Zhu, C. S. Ong, X. Xu, B. Hu, J. Shang, H. Yang, S. Katlakunta, Y. Liu, X. Chen, L. Pan, J. Ding and R.-W. Li, Sci. Rep., 2013, 3, 1084 CrossRef.
- M. Park, X. Zhang, M. Chung, G. B. Less and A. M. Sastry, J. Power Sources, 2010, 195, 7904–7929 CrossRef CAS.
- C. Montella, J. Electroanal. Chem., 2002, 518, 61–83 CrossRef CAS.
- K. Dokko, M. Mohamedi, Y. Fujita, T. Itoh, M. Nishizawa, M. Umeda and I. Uchida, J. Electrochem. Soc., 2001, 148, A422–A426 CrossRef CAS.
- M. Hayashi, M. Takahashi and Y. Sakurai, J. Power Sources, 2007, 174, 990–995 CrossRef CAS.
- T. Hayashi, J. Okada, E. Toda, R. Kuzuo, Y. Matsuda, N. Kuwata and J. Kawamura, J. Power Sources, 2015, 285, 559–567 CrossRef CAS.
- K. Nakamura, H. Ohno, K. Okamura, Y. Michihiro, T. Moriga, I. Nakabayashi and T. Kanashiro, Solid State Ionics, 2006, 177, 821–826 CrossRef CAS.
- J. Sugiyama, K. Mukai, Y. Ikedo, H. Nozaki, M. Månsson and I. Watanabe, Phys. Rev. Lett., 2009, 103, 147601 CrossRef.
- N. Kuwata, X. Lu, T. Miyazaki, Y. Iwai, T. Tanabe and J. Kawamura, Solid State Ionics, 2016, 294, 59–66 CrossRef CAS.
- N. Kuwata, M. Nakane, T. Miyazaki, K. Mitsuishi and J. Kawamura, Solid State Ionics, 2018, 320, 266–271 CrossRef CAS.
- M. Kato, T. Hayashi, G. Hasegawa, X. Lu, T. Miyazaki, Y. Matsuda, N. Kuwata, K. Kurihara and J. Kawamura, Solid State Ionics, 2017, 308, 54–60 CrossRef CAS.
- N. Kuwata, G. Hasegawa, D. Maeda, N. Ishigaki, T. Miyazaki and J. Kawamura, J. Phys. Chem. C, 2020, 124, 22981–22992 CrossRef CAS.
- T. Ishigaki, S. Yamauchi, J. Mizusaki, K. Fueki and H. Tamura, J. Solid State Chem., 1984, 54, 100–107 CrossRef CAS.
- B. Steele, J. Kilner, P. Dennis, A. McHale, M. Vanhemert and A. Burggraaf, Solid State Ionics, 1986, 18-19, 1038–1044 CrossRef CAS.
- R. De Souza, Solid State Ionics, 1998, 106, 175–187 CrossRef CAS.
- A. Berenov, Solid State Ionics, 1999, 122, 41–49 CrossRef CAS.
- K. Watanabe, I. Sakaguchi, S. Hishita, N. Ohashi and H. Haneda, Appl. Phys. Express, 2011, 4, 055801 CrossRef.
- N. Kuwata, R. Kumar, K. Toribami, T. Suzuki, T. Hattori and J. Kawamura, Solid State Ionics, 2006, 177, 2827–2832 CrossRef CAS.
- A. Honders, J. M. der Kinderen, A. H. van Heeren, J. H. W. de Wit and G. H. J. Broers, Solid State Ionics, 1985, 15, 265–276 CrossRef CAS.
- M. G. S. R. Thomas, P. G. Bruce and J. B. Goodenough, Solid State Ionics, 1985, 17, 13–19 CrossRef CAS.
- Y.-M. Choi, S.-I. Pyun, J.-S. Bae and S.-I. Moon, J. Power Sources, 1995, 56, 25–30 CrossRef CAS.
- J. Barker, R. Pynenburg, R. Koksbang and M. Y. Saidi, Electrochim. Acta, 1996, 41, 2481–2488 CrossRef CAS.
- D. Aurbach, M. D. Levi, E. Levi, H. Teller, B. Markovsky, G. Salitra, U. Heider and L. Heider, J. Electrochem. Soc., 1998, 145, 3024–3034 CrossRef CAS.
- M. D. Levi, G. Salitra, B. Markovsky, H. Teller, D. Aurbach, U. Heider and L. Heider, J. Electrochem. Soc., 1999, 146, 1279–1289 CrossRef CAS.
- M. Okubo, Y. Tanaka, H. Zhou, T. Kudo and I. Honma, J. Phys. Chem. B, 2009, 113, 2840–2847 CrossRef CAS.
- C. H. Chen, A. A. J. Buysman, E. M. Kelder and J. Schoonman, Solid State Ionics, 1995, 80, 1–4 CrossRef CAS.
- K. A. Striebel, C. Z. Deng, S. J. Wen and E. J. Cairns, J. Electrochem. Soc., 1996, 143, 1821–1827 CrossRef CAS.
- P. Birke, W. F. Chu and W. Weppner, Solid State Ionics, 1996, 93, 1–15 CrossRef CAS.
- H. Sato, D. Takahashi, T. Nishina and I. Uchida, J. Power Sources, 1997, 68, 540–544 CrossRef CAS.
- J. M. McGraw, C. S. Bahn, P. A. Parilla, J. D. Perkins, D. W. Readey and D. S. Ginley, Electrochim. Acta, 1999, 45, 187–196 CrossRef CAS.
- Y.-I. Jang, B. J. Neudecker and N. J. Dudney, Electrochem. Solid-State Lett., 2001, 4, A74 CrossRef CAS.
- Y. Iriyama, M. Inaba, T. Abe and Z. Ogumi, J. Power Sources, 2001, 94, 175–182 CrossRef CAS.
- P. J. Bouwman, B. A. Boukamp, H. J. M. Bouwmeester and P. H. L. Notten, J. Electrochem. Soc., 2002, 149, A699–A709 CrossRef CAS.
- H. Xia, L. Lu and G. Ceder, J. Power Sources, 2006, 159, 1422–1427 CrossRef CAS.
- J. Xie, N. Imanishi, A. Hirano, M. Matsumura, Y. Takeda and O. Yamamoto, Solid State Ionics, 2007, 178, 1218–1224 CrossRef CAS.
- S. B. Tang, M. O. Lai and L. Lu, J. Alloys Compd., 2008, 449, 300–303 CrossRef CAS.
- S. Shiraki, H. Oki and T. Hitosugi, Surf. Interface Anal., 2016, 48, 1240–1243 CrossRef CAS.
- Y.-H. Wen, E.-B. Yang, S.-J. Xiang, L.-A. Fu and S.-Q. Fang, J. Radioanal. Nucl. Chem., 2001, 247, 199–203 CrossRef CAS.
- J. Crank, The mathematics of diffusion, Oxford University Press, 1979 Search PubMed.
- W. Weppner and R. A. Huggins, J. Electrochem. Soc., 1977, 124, 1569–1578 CrossRef CAS.
- C. J. Wen, B. A. Boukamp, R. A. Huggins and W. Weppner, J. Electrochem. Soc., 1979, 126, 2258–2266 CrossRef CAS.
- G. Kresse and J. Furthmüller, Phys. Rev. B: Condens. Matter Mater. Phys., 1996, 54, 11169–11186 CrossRef CAS.
- J. P. Perdew, K. Burke and M. Ernzerhof, Phys. Rev. Lett., 1996, 77, 3865–3868 CrossRef CAS.
- P. E. Blöchl, Phys. Rev. B: Condens. Matter Mater. Phys., 1994, 50, 17953–17979 CrossRef.
- D. Sheppard, R. Terrell and G. Henkelman, J. Chem. Phys., 2008, 128, 134106 CrossRef.
- G. Henkelman, B. P. Uberuaga and H. Jónsson, J. Chem. Phys., 2000, 113, 9901–9904 CrossRef CAS.
- M. Antaya, K. Cearns, J. S. Preston, J. N. Reimers and J. R. Dahn, J. Appl. Phys., 1994, 76, 2799–2806 CrossRef CAS.
- J. Rahn, E. Huger, L. Dorrer, B. Ruprecht, P. Heitjans and H. Schmidt, Phys. Chem. Chem. Phys., 2012, 14, 2427–2433 RSC.
- J. Rahn, P. Heitjans and H. Schmidt, J. Phys. Chem. C, 2015, 119, 15557–15561 CrossRef CAS.
- S. Levasseur, M. Ménétrier, Y. Shao-Horn, L. Gautier, A. Audemer, G. Demazeau, A. Largeteau and C. Delmas, Chem. Mater., 2003, 15, 348–354 CrossRef CAS.
- S.-W. Kim and S.-I. Pyun, Electrochim. Acta, 2001, 46, 987–997 CrossRef CAS.
- R. Kutner, Phys. Lett. A, 1981, 81, 239–240 CrossRef.
- T. Kudo, M. Hibino and I. Honma, Uchida Rokakuho, Science of lithium-ion battery, Tokyo, 2010, in Japanese.
Footnotes |
| † Present address: National Institute of Advanced Industrial Science and Technology (AIST), 1-1-1 Higashi, Tsukuba 305-8565, Japan. |
| ‡ Present address: University Research Administration (URA) Center, Office of Research Promotion, Tohoku University, 2-1-1 Katahira, Aobaku, Sendai 980-8577, Japan. |
| This journal is © the Owner Societies 2021 |


