Mechanism and kinetics characteristic of self-discharge of FeS2 cathodes for thermal batteries†
Received
30th August 2020
, Accepted 19th October 2020
First published on 27th November 2020
Abstract
The service life of FeS2 thermal batteries is significantly affected by self-discharge of the cathode. Herein, SEM, XRD and XPS were employed to characterize the mechanism of self-discharge of the FeS2 cathode. A novel combined-discharge method, in which a tiny current (5 mA cm−2) was applied to minimize the effect of polarization on discharge capacity, was conducted to study the kinetics characteristic of self-discharge of FeS2 cathode upon discharge. Then, the self-discharge kinetics parameters which are related to the current density (20, 50 and 200 mA cm−2) and temperature (400, 450, 500 and 550 °C) were determined by the Serin–Ellickson model. Characterizations of the cells standing at 500 °C confirm that the decomposition product of the FeS2 cathode is FeS. The quantitative analysis of self-discharge rate constants (SRC) demonstrates that the reaction is a diffusion-controlling process. The kinetics process can conform to the Serin–Ellickson model. Specifically, the values of SRC increase when the cell is carried by a heavier load, since more breakage would form in FeS2 particles at the larger current density. Besides, the SRC increase at a higher temperature, and the relationship of SRC and temperature can be fitted by the Arrhenius equation. Consequently, the apparent activation energy decreases with the increase of current density.
1. Introduction
Thermal batteries are primary batteries widely used as power source devices for guided missiles, torpedoes and extended space flights, which require long storage time, high power density, and high reliability operating in extreme environments.1,2 Generally, thermal batteries are composed of the igniter, fuse strip, pyrotechnic pellets and single cells. Each cell includes the cathode (e.g., FeS2, CoS2), separator (e.g., LiCl–KCl, LiCl–LiBr–KBr), anode (e.g., LiSi, LiB) and current collectors.3–8 One typical characteristic of these batteries is that separators are non-conductive solid materials at ambient temperature. Once activated, the operating temperature reaches 400–550 °C, transforming solid separators into liquid molten salts with high ionic conductivity. However, the high temperature may cause relatively serious self-discharge in the form of decomposing or dissolving of active materials during discharge, which would lead to capacity loss and thermal change for thermal batteries.9,10 As a result, the service life of thermal batteries may be affected significantly.
The pyrite (FeS2) is the most widely used cathode for thermal batteries for its high natural abundance, good chemical stability and stable discharge performance.11,12 Nevertheless, the FeS2 cathode is limited in long-life thermal batteries due to the capacity loss of self-discharge.13,14 The self-discharge of FeS2 cathodes is mainly caused by its decomposition upon discharge, since the solubility of FeS2 in the molten salts is especially low at high temperatures, which was determined to be less than 10−5 mol fraction by a new optical technique.15 Although the self-discharge mechanism of the FeS2 cathode was previously reported by Schoeffert and Masset, and the decomposition reaction was proposed to be FeS2 → Fe1−xS + S2, there has been a different statement that the decomposition product of the FeS2 cathode is FeS or Fe7S8.16,17
To accurately predict the service life of FeS2 thermal batteries in various practical applications, it is necessary to explore the kinetics characteristic of self-discharge systematically. Some effort was made to quantify the effects of material preparation parameters and working conditions on the self-discharge rate for thermal batteries. Guidotti et al.18 reported a feasible method for quantifying the capacity loss for different times at an open circuit. Based on the galvanostatic discharge schemes, the discrepancy of the discharge capacity at the cut-off of 1.25 V was quantified and regulations concerning temperature and electrolyte composition on the capacity loss were discovered. Consequently, the capacity loss would increase almost linearly with the increase of time at the open circuit in one hour. Liu et al.19 referred to the Guidotti’ method with excessive anode in the cells and studied the capacity loss of FeS2 and CoS2 cathodes for different working times. As a result, the constant rate of capacity loss could be obtained for both the cathodes. On the other hand, some reports focused on the decomposition kinetics of FeS2 cathodes for thermal batteries. Masset et al.20 studied the sulfur diffusion kinetics in the mixture of FeS2 and LiCl–KCl, concluding that LiCl–KCl could significantly retard the diffusion process since the molten phase would act as a physical barrier. However, to the best of our knowledge, the present reports have not considered the specific kinetics models and parameters of self-discharge of FeS2 thermal batteries upon discharge, especially at various working conditions (e.g., current density), and then an accurate prediction of the battery service life in practical applications may become difficult.
In fact, the kinetics characteristic of FeS2 decomposition has been studied in many other domains, such as calcination of coal gangue and production of base metal.21–23 The kinetics process of FeS2 decomposition in an inert atmosphere would be mainly controlled by diffusion of sulfur in the product layer, except at the initial stage which is controlled by the chemical reaction or heat conduction.24,25 The relationship of decomposition degree and time could conform to the Serin–Ellickson model when the reaction is diffusion-controlled:26,27
| |  | (1) |
where
α is the decomposition degree which means the proportion of reaction,
R is the particle radius,
D is the diffusion coefficient, and
t is the reaction time. For convenience of expression, the equation above can be simplified as:
where
k is the rate constant of decomposition, which is related to the particle radius and diffusion coefficient.
In terms of the research short-comings mentioned above, the mechanism and kinetics characteristic of self-discharge of the FeS2 cathode for thermal batteries were studied in this paper based on the Serin–Ellickson model, which was introduced from the FeS2 decomposition in an inert atmosphere. First, SEM, XRD and XPS were used to examine the self-discharge product. Then, the rate of capacity loss upon discharge was related to the self-discharge kinetics of the FeS2 cathode. The kinetics was studied by a novel combined-discharge method, with the designed tiny current (5 mA cm−2) to minimize the effect of polarization on discharge capacity. The kinetics parameters based on the combined-discharge method were determined by the Serin–Ellickson model. Finally, the effects of temperature and discharge current on the kinetics characteristic of self-discharge were analyzed.
2. Experimental and methods
2.1 Preparation of single cells
Single cells were assembled by cold pressing at a pressure of 200 kg cm−2 in a drying room, where the dew point temperature is lower than −50 °C to eliminate the influence of moisture in the environment on the active materials. The cathode, separator and anode of 0.6, 0.8 and 1.4 g, respectively, were pressed into pellets of 34 mm in diameter. The composition and weight of each component are summarized in Table 1. The cathode is composed of 76% FeS2, 22% LiCl–KCl and 2% Li2O, in which Li2O is employed to eliminate the voltage peak at the beginning of the operation. The tests were terminated at the plateau around 1.43 V in this paper, which is the cut-off in most practical applications. Therefore, the theoretical capacity of the cathode at the cut-off is 0.207 A h according to Faraday's law. The separator was composed of 50% LiCl–KCl and 50% MgO. As an immobilizing agent, MgO is employed to prevent leakage of molten salts. The anode consisting of 95% LiSi and 5% Ag, in which Ag would enhance the electrode conductivity, corresponds to 0.643 A h for the first half-reaction of Li3.25Si–0.92e− → Li2.33Si + 0.92Li+. In particular, a large excess anode was used to ensure that the anode would work on the first plateau upon discharge. Hence, the discharge voltage curves could be dominated just by the FeS2 cathode.
Table 1 The composition and weight of each component in the cells
| Component |
Weight |
Composition |
Diameter |
| Cathode |
0.6 g |
76% FeS2 + 22% LiCl–KCl + 2% Li2O |
Φ = 34.0 mm |
| Separator |
0.8 g |
50% LiCl–KCl + 50% MgO |
| Anode |
1.4 g |
95% LiSi + 5% Ag |
2.2 Discharge experimental system and characterization
In order not to be affected by moisture and oxygen in the environment, the discharge tests were conducted in a glove box (Mikrouna-Universal) where the moisture and oxygen levels are both lower than 0.1 ppm. The target temperature was maintained by heat conduction among the heat source, fixture and cells in the furnace (DGPS RYL-01), with a constant compact pressure of 60 N to be applied. The discharge procedure and data collection were performed by an electrochemical workstation (Land-CT2001B). The schematic of the discharge experimental system is shown in Fig. 1.
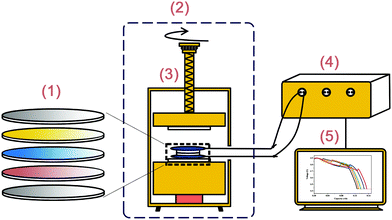 |
| | Fig. 1 Schematic of the discharge experimental system. (1) A cell, which represents the current collector, cathode, separator, anode and current collector from top to bottom, respectively. (2) Glove box. (3) Furnace, including the pressure sensor, fixture and mechanical system. (4) Electrochemical workstation. (5) Computer. | |
For characterizing the mechanism of the self-discharge, single cells standing at a high temperature instead of those discharging were employed as the samples, since discharge products would interfere in the analysis of self-discharge products. The standing temperature was 500 °C. After standing, the samples were scraped from the FeS2 cathode, then they were mixed and preserved in the glove box before the characterization. The microstructure and morphology of the samples were characterized by using a scanning electron microscope (SEM, Phenom Prox). The phases and chemical compositions of the samples were analyzed using X-ray diffraction (XRD, Bruker D8 Advance) with Cu Kα radiation (λ = 1.5418 Å). X-ray photoelectron spectroscopy (XPS) was performed on an Escale 250 XI system with Al Kα radiation (hν = 1486.6 eV).
2.3 Calculation of capacity loss and kinetics of self-discharge
The capacity loss of the FeS2 cathode (Qs) was quantified based on the theoretical capacity and discharge capacity until the 1.43 V plateau:where Qt is the theoretical capacity and Qd is the discharge capacity. However, it is not only self-discharge, but also polarization upon discharge that makes the discharge capacity smaller than the theoretical one, as illustrated in Fig. S1 (ESI†). Hence, a tiny current of 5 mA cm−2 was introduced to follow the discharge at the investigated current density (20, 50 and 200 mA cm−2) to minimize the effect of polarization on capacity loss, which has not been considered before. Fig. 2 illustrates the specific combined-discharge schemes for the analysis of the kinetics characteristic of self-discharge, which is related to the temperature, current density and discharge time.
 |
| | Fig. 2 Schematic of the combined-discharge for the analysis of self-discharge kinetics. (a) A1–A5 means that the discharge is conducted at the investigated current density of 20 mA cm−2 for t0 = 10, 20, 30, 40 and 50 min, respectively, and then it is followed by the tiny current of 5 mA cm−2 discharging to the 1.43 V plateau. (b) B1–B5 means that the discharge at 50 mA cm−2 is conducted for t0 = 4, 8, 12, 16 and 20 min, respectively, then it is followed by the tiny current discharging to the cut-off. (c) C1–C5 means that the investigated current density is 200 mA cm−2 and discharge times t0 are 1, 2, 3, 4 and 5 min, respectively. | |
Since the decomposition product and discharge products can hinder the diffusion of sulfur, which was supposed to be the controlling step of the self-discharge of FeS2 cathode in this paper. The capacity loss due to self-discharge in eqn (3) can therefore correspond to the decomposition degree in the Serin–Ellickson model:
According to
eqn (2)–(4), the self-discharge kinetics parameters (SRC) at 5 mA cm
−2 at different temperatures (400, 450, 500 and 550 °C) should be calculated at first.
Then, the SRC at 20, 50 and 200 mA cm−2 was calculated according to the results at 5 mA cm−2. Based on the combined-discharge method, the total capacity loss equals the capacity loss at the investigated current density plus that at the 5 mA cm−2. Therefore, the modified Serin–Ellickson model can be obtained to calculate the SRC at the investigated current density:
| | | ln(1 − α) = −(k0t0 + k1t1) | (5) |
where
α equals dividing the total capacity loss by the theoretical capacity,
k0 is the SRC at 20, 50 or 200 mA cm
−2,
k1 is the SRC at 5 mA cm
−2, and
t1 is the discharge time at 5 mA cm
−2. After
k0 was calculated by
eqn (5), the validity of the kinetics model was analyzed by the dispersion degree of
k0 for different
t0.
3. Results and discussion
3.1 Mechanism of the decomposition of the FeS2 cathode
The decomposition products of the FeS2 cathode have been characterized by SEM, XRD and XPS, as shown in Fig. 3. Fig. 3(a) presents the SEM image of the raw material of the FeS2 cathode, which has a smooth surface and sharp edge. However, the FeS2 particles standing at 500 °C for 2 h become uneven and approximately spherical compared to the raw material. Also, the particles get smaller after the decomposition, as shown in Fig. 3(b). To identify the decomposition products, XRD analysis was performed. The XRD patterns of samples standing at 500 °C for 5 min and 2 h are shown in Fig. 3(c), and the distinct peaks can be assigned to FeS2 (JCPDS No. 71-0053) and FeS (JCPDS No. 80-1029). With the increase of standing time, the intensity of the FeS peaks gets relatively stronger. The XPS profile in Fig. 3(d) illustrates that the four peaks can be attributed to FeS, FeS2, FeSO4 and Fe2O3, respectively. The existence of FeSO4 and Fe2O3 may be caused by oxidation of the sample as the transient exposure to air would occur before tests. Therefore, it can be demonstrated that FeS is one of the decomposition products of the FeS2 cathode and the proposed decomposition reaction is FeS2 → FeS + S2.
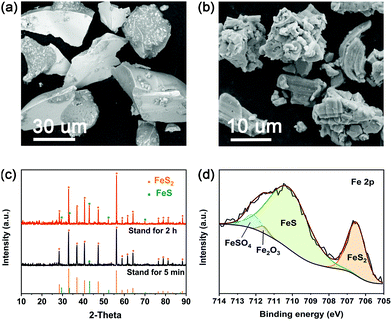 |
| | Fig. 3 Postmortem characterizations of samples standing at 500 °C. (a) SEM image of the raw material. (b) SEM image of the sample standing for 2 h. (c) XRD patterns of samples standing for 5 min and 2 h. (d) XPS profile of the sample standing for 2 h. | |
3.2 Results of SRC at 5 mA cm−2
The SRC at 5 mA cm−2 (k1) was calculated at first. Fig. 4 shows the discharge curves at 5 mA cm−2 at 400, 450, 500 and 550 °C until the 1.43 V plateau. With the increase of temperature, the discharge plateaus are higher and more stable, while the discharge capacity decreases at the cut-off. Table 2 illustrates that the discharge capacity at 400, 450, 500 and 550 °C is 0.159, 0.138, 0.119 and 0.095 A h, respectively. According to the theoretical capacity of 0.207 A h, the capacity loss is 0.048, 0.069, 0.088 and 0.112 A h corresponding to the four conditions, respectively. As a result, k1 can be obtained as 1.01 × 10⁻³, 2.00 × 10⁻³, 2.96 × 10⁻³ and 5.20 × 10⁻³ min−1 at 400, 450, 500 and 550 °C, respectively, as listed in Table 2. These results indicate that high temperatures can accelerate the kinetics process of self-discharge and increase the capacity loss.
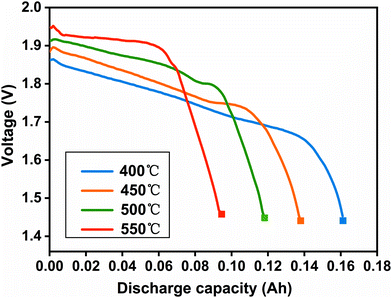 |
| | Fig. 4 Discharge curves at 5 mA cm−2 until the 1.43 V plateau. The solid square (■) represents the cut-off. | |
Table 2 Results of the discharge capacity (Qd), capacity loss (Qs) and SRC (k1) at 5 mA cm−2
| Temperature (°C) |
400 |
450 |
500 |
550 |
|
Q
d (A h) |
0.159 |
0.138 |
0.119 |
0.095 |
|
Q
s (A h) |
0.048 |
0.069 |
0.088 |
0.112 |
|
k
1 × 10³ (min−1) |
1.01 |
2.00 |
2.96 |
5.20 |
3.3 Profiles of the combined-discharge and results of SRC at the investigated current density.
According to the combined-discharge method illustrated in Fig. 2, the discharge profiles can be obtained. Fig. 5 shows the combined-discharge curves at the investigated current density of 20, 50 and 200 mA cm−2 at 500 °C, which is the best working condition among the four temperatures for FeS2 thermal batteries. It can be seen that the discharge voltages increase abruptly when the current density becomes 5 mA cm−2, attributed to the reduced electrochemical and Ohm polarization at the tiny current density. In particular, the voltages of all the combined-discharge cases, in spite of different investigated current densities and discharge times, decline in a similar tendency prior to the 1.43 V plateau. This result indicates that the FeS2 cathode would have almost the same state at the cut-off. Namely, the influence of polarization at the investigated current density can be minimized by the tiny current.
 |
| | Fig. 5 Combined-discharge curves at the investigated current density of (a) 20 mA cm−2, (b) 50 mA cm−2 and (c) 200 mA cm−2 at 500 °C. A1–A5, B1–B5 and C1–C5 represent different discharge schemes illustrated in Fig. 2. The black dotted line represents the 1.43 V plateau, which is the same in Fig. 6–8. | |
Fig. 6 shows the combined-discharge curves at 550 °C. It can be seen that all the discharge plateaus at 20, 50 and 200 mA cm−2 at 550 °C are higher and more stable compared to those at 500 °C, since the higher open circuit voltage and faster ionic mobility would be at a higher temperature, which are the same as those discharging at 5 mA cm−2 (shown in Fig. 4). Furthermore, the influence of polarization on the discharge tends to decrease at 550 °C as the difference of the voltages between the investigated current and the tiny current becomes smaller.
 |
| | Fig. 6 Combined-discharge curves at the investigated current density of (a) 20 mA cm−2, (b) 50 mA cm−2 and (c) 200 mA cm−2 at 550 °C. | |
 |
| | Fig. 7 Combined-discharge curves at the investigated current density of (a) 20 mA cm−2, (b) 50 mA cm−2 and (c) 200 mA cm−2 at 450 °C. | |
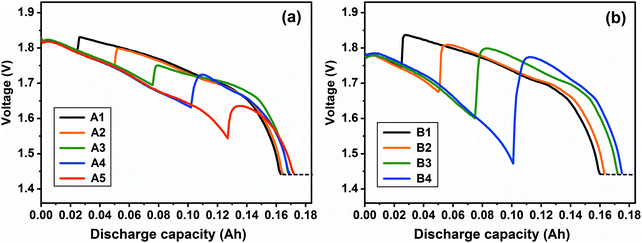 |
| | Fig. 8 Combined-discharge curves at the investigated current density of (a) 20 mA cm−2 and (b) 50 mA cm−2 at 400 °C. | |
The combined-discharge curves at different current densities at 400 and 450 °C are shown in Fig. 7 and 8. Due to decreased ionic mobility and open circuit voltage at relatively low temperatures of 400 and 450 °C, the discharge voltages decrease faster compared to those at 500 and 550 °C. In particular, the discharge voltage at 200 mA cm−2 would decline abruptly to 1.0 V in just one minute at 400 °C. Hence, several cases especially loaded with the relatively large current at 400 or 450 °C have not been investigated in this paper. Besides, the difference of discharge capacity for different t0 becomes smaller at lower temperatures, indicating that the effect of self-discharge on discharge capacity tends to decrease at these conditions.
As a result, the overall calculated SRC (k0), the average of k0 for different t0, standard deviations and coefficients of variation at different discharge conditions are illustrated in Table 3. In order to compare these results more directly, the grouped box charts shown in Fig. 9 exhibit the distribution of k0 and the average. It can be clearly seen that the calculated k0 at a constant current density and temperature almost float around the average, in spite of different t0. Specifically, the overall coefficients of variation are less than 15% (Table 3), indicating that the dispersion degree of SRC is small. Hence, the kinetics parameter SRC can be deemed to remain constant upon discharge for different t0, and then the self-discharge kinetics of the FeS2 cathode can conform to the Serin–Ellickson model validly.
Table 3 Results of SRC at different conditions. k0 is the SRC,  is the average of SRC for different t0, σ is the standard deviation, c is the coefficient of variation which equals dividing σ by
| Temperature (°C) |
Current density (mA cm−2) |
k
0 × 103 (min−1) |

× 103 (min−1) |
σ × 103 (min−1) |
c (%) |
| 550 |
20 |
10 min |
20 min |
30 min |
40 min |
50 min |
|
|
|
| 6.95 |
6.92 |
5.56 |
5.79 |
6.16 |
6.28 |
0.64 |
10.2 |
| 50 |
4 min |
8 min |
12 min |
16 min |
20 min |
|
|
|
| 12.18 |
14.38 |
12.27 |
12.23 |
13.12 |
12.84 |
0.95 |
7.4 |
| 200 |
1 min |
2 min |
3 min |
4 min |
5 min |
|
|
|
| 33.13 |
34.76 |
37.21 |
26.37 |
31.14 |
32.52 |
4.10 |
12.6 |
| 500 |
20 |
10 min |
20 min |
30 min |
40 min |
50 min |
|
|
|
| 4.75 |
4.82 |
4.98 |
4.03 |
3.91 |
4.50 |
0.49 |
10.9 |
| 50 |
4 min |
8 min |
12 min |
16 min |
20 min |
|
|
|
| 10.89 |
9.05 |
10.60 |
8.18 |
8.40 |
9.42 |
1.25 |
13.3 |
| 200 |
1 min |
2 min |
3 min |
4 min |
5 min |
|
|
|
| 26.77 |
30.26 |
33.67 |
28.08 |
24.94 |
28.74 |
3.36 |
11.7 |
| 450 |
20 |
10 min |
20 min |
30 min |
40 min |
50 min |
|
|
|
| 4.11 |
3.85 |
3.63 |
4.19 |
3.44 |
3.84 |
0.32 |
8.3 |
| 50 |
4 min |
8 min |
12 min |
16 min |
20 min |
|
|
|
| 7.10 |
7.75 |
8.73 |
8.89 |
7.06 |
7.91 |
0.87 |
11.0 |
| 200 |
1 min |
2 min |
3 min |
4 min |
5 min |
|
|
|
| 21.96 |
19.75 |
20.59 |
— |
— |
20.77 |
1.12 |
5.4 |
| 400 |
20 |
10 min |
20 min |
30 min |
40 min |
50 min |
|
|
|
| 2.90 |
2.65 |
2.31 |
2.50 |
2.33 |
2.54 |
0.25 |
9.8 |
| 50 |
4 min |
8 min |
12 min |
16 min |
20 min |
|
|
|
| 5.96 |
5.95 |
4.63 |
4.95 |
— |
5.37 |
0.69 |
12.8 |
 |
| | Fig. 9 Distribution of SRC and the average for different t0 at (a) 20 mA cm−2, (b) 50 mA cm−2 and (c) 200 mA cm−2. In each grouped box, five horizontal lines from top to bottom represent values of the maximum, upper quartile, median, lower quartile, minimum, respectively, which correspond to the five SRC for different t0. The solid square (■) represents the average value of SRC for different t0. | |
3.4 Effects of discharge conditions on self-discharge kinetics
According to the Serin–Ellickson model (eqn (2)), the relationship of the self-discharge degree (α) and discharge time can be obtained based on the results of SRC. As shown in Fig. 10, it can be clearly seen that the self-discharge of the FeS2 cathode is a time-dependent process, in which the self-discharge degree increases along with the discharge time within 60 min, since the remaining quantity (1 − α) of the cathode gradually decreases. On the other hand, with the increasing temperature and current density, the self-discharge becomes more serious. Especially, the FeS2 cathode would lose 70–80% of the active material at 200 mA cm−2 at the common temperatures due to the self-discharge, and then FeS2 is limited in long-life thermal batteries.
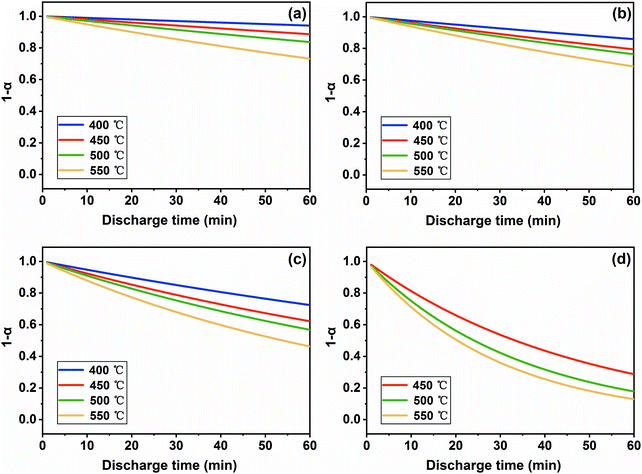 |
| | Fig. 10 Relationship of the self-discharge degree and discharge time at different temperatures at the current density of (a) 5 mA cm−2, (b) 20 mA cm−2, (c) 50 mA cm−2 and (d) 200 mA cm−2. | |
In our argument, it can be illustrated that not only temperature but also the discharge current density affects the self-discharge kinetics of the FeS2 cathode (shown in Fig. 9 and 10). This is probably because the larger current density can accelerate the electrochemical reaction, resulting in greater mechanical stress in particles. Therefore, the breakage in FeS2 particles would become intensified, which can be proved by SEM images shown in Fig. 11. The sample discharging at 50 mA cm−2 (Fig. 11(d)) causes more severe breakage than that at 5 mA cm−2 (Fig. 11(b)), both of which discharge for 0.05 A h and locate at a similar distance to the boundary of the cathode and separator. According to the definition of SRC, which is related to the diffusion coefficient and particle radius (illustrated in eqn (1)), SRC would get larger with the heavier load as the equivalent radius of the particle becomes smaller. Furthermore, the particle breakage can increase the specific surface with more reactive sites, then facilitate the self-discharge reaction and increase the concentration gradient of sulfur. This can also promote the kinetics process of the FeS2 cathode.
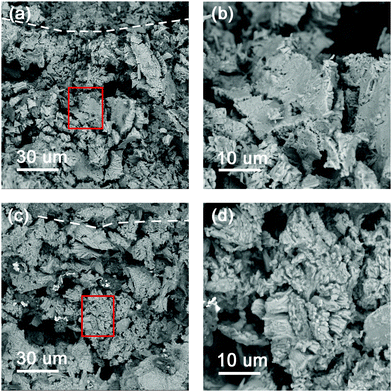 |
| | Fig. 11 SEM images of the cross section of the FeS2 cathode after discharging at 400 °C at (a and b) 5 mA cm−2 and (c and d) 50 mA cm−2 for 0.05 A h. The white dotted line in (a) and (c) represents the boundary of the cathode and separator, where the top region is the separator and the rest is the cathode. The image (b) and (d) are the magnified images of the red rectangular area in (a) and (c). | |
Finally, the relationship of SRC and temperature can be fitted by the Arrhenius equation:
| | k = A![[thin space (1/6-em)]](https://www.rsc.org/images/entities/char_2009.gif) exp(−Ea/RT) exp(−Ea/RT) | (6) |
where
A is the pre-exponential factor,
Ea is the apparent activation energy,
R is the gas constant and
R = 8.314 J mol
−1 K
−1. As shown in
Fig. 12, Arrhenius plots of ln
![[thin space (1/6-em)]](https://www.rsc.org/images/entities/char_2009.gif) k vs.
k vs. 1/
T are almost linear. The intercept corresponds to ln
![[thin space (1/6-em)]](https://www.rsc.org/images/entities/char_2009.gif) A
A and the slope corresponds to −
Ea/
R. As a result, the apparent activation energy at 5, 20, 50, and 200 mA cm
−2 can be calculated as 48.9, 26.5, 25.7, and 22.4 kJ mol
−1, respectively. All the apparent activation energies are smaller than that of about 122 kJ mol
−1 with the decomposition in an inert atmosphere, which does not include the electrochemical process.
28 Interestingly, the apparent activation energy decreases with the increase of current density. It confirms that the high current density can promote the self-discharge kinetics process of the FeS
2 cathode.
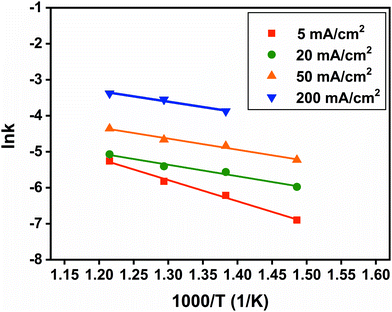 |
| | Fig. 12 Arrhenius plots of SRC at 5, 20, 50 and 200 mA cm−2. | |
4. Conclusion
In this paper, FeS2/LiCl–KCl/LiSi thermal cells with an excess anode have been prepared. A combined-discharge method with the tiny current (5 mA cm−2) to minimize the effect of polarization on discharge capacity has been designed to quantify the self-discharge kinetics of the FeS2 cathode. Then, the self-discharge kinetics parameters which are related to the current density (20, 50 and 200 mA cm−2) and temperature (400, 450, 500 and 550 °C) have been calculated. According to the results of postmortem characterization and quantitative analysis, three main conclusions are summarized: FeS is one of the decomposition products of the FeS2 cathode. The self-discharge is a diffusion-controlling process, and the kinetics of self-discharge can conform to the Serin–Ellickson model. The SRC increase when the cells are carried by a heavier load, which can result in more breakage in FeS2 particles. The SRC increase at higher temperatures, and the apparent activation energy would decrease with the increase of current density.
Conflicts of interest
There are no conflicts of interest to declare.
Acknowledgements
This work was supported by the National Natural Science Foundation of China (No. 51772034, 21703215), NSAF (Grant No. U1930208), Chongqing Research Program of Basic Research and Frontier Technology (No. cstc 2018jcyjAX0026), and the Fundamental Research Funds for the Central Universities (No. 2019CDJGFCL004, 2020CDCGJ016).
Notes and references
- R. A. Guidotti and P. Masset, J. Power Sources, 2006, 161, 1443–1449 CrossRef CAS.
- X. Zheng, Y. Zhu, Y. Sun and Q. Jiao, J. Power Sources, 2018, 395, 318–327 CrossRef CAS.
- J. Ko, S. H. Kang, H. W. Cheong and Y. S. Yoon, J. Korean Ceram. Soc., 2019, 56, 233–255 CrossRef CAS.
- J. L. Payne, J. D. Percival, K. Giagloglou, C. J. Crouch, G. M. Carins, R. I. Smith, R. K. Gover and J. T. Irvine, J. Electrochem. Soc., 2019, 166, A2660–A2664 CrossRef CAS.
- P. Masset and R. A. Guidotti, J. Power Sources, 2007, 164, 397–414 CrossRef CAS.
- X. Huang, J. Liu, M. Zeng, X. Yang and X. Liu, Electrochim. Acta, 2019, 324, 1–7 CrossRef.
- R. A. Guidotti and P. J. Masset, J. Power Sources, 2008, 183, 388–398 CrossRef CAS.
- Y.-S. Choi, H.-R. Yu and H.-W. Cheong, J. Power Sources, 2015, 276, 102–104 CrossRef CAS.
- S. Preto, Z. Tomczuk, S. Von Winbush and M. Roche, J. Electrochem. Soc., 1983, 130, 264–273 CrossRef CAS.
- Y. Xie, Z. Liu, H. Ning, H. Huang and L. Chen, RSC Adv., 2018, 8, 7173–7178 RSC.
- J. Pemsler, R. Lam, J. Litchfield, S. Dallek, B. Larrick and B. Beard, J. Electrochem. Soc., 1990, 137, 1–7 CrossRef CAS.
- H. Ning, Z. Liu, Y. Xie and H. Huang, J. Electrochem. Soc., 2018, 165, A1725–A1733 CrossRef CAS.
-
R. A. Guidotti and F. W. Reinhardt, Proceedings of Ninth International Symposium on Molten Salts, 1994, pp. 820–827 Search PubMed.
- C. Jin, L. Fu, J. Zhu, W. Yang, D. Li and L. Zhou, J. Mater. Chem. A, 2018, 6, 7123–7132 RSC.
- R. A. Sharma and R. N. Seefurth, J. Electrochem. Soc., 1984, 131, 1084–1089 CrossRef CAS.
- S. Schoeffert, J. Power Sources, 2005, 142, 361–369 CrossRef CAS.
- P. J. Masset and R. A. Guidotti, J. Power Sources, 2008, 177, 595–609 CrossRef CAS.
-
R. A. Guidotti, F. W. Reinhardt and J. A. Smaga, Proceedings of the 34th International Power Sources Symposium, 1990, pp. 132–135 Search PubMed.
- B. Liu, X. Zhao, Y. Yue, C. Luo and T. Han, Chin. J. Power Sources, 2017, 41, 1617–1620 Search PubMed.
- P. J. Masset, ECS Trans., 2010, 25, 155–165 CrossRef CAS.
- Y. Zhang, X. Ge, J. Nakano, L. Liu, X. Wang and Z. Zhang, RSC Adv., 2014, 4, 42506–42513 RSC.
- W. Lv, D. Yu, J. Wu, L. Zhang and M. Xu, Proc. Combust. Inst., 2015, 35, 3637–3644 CrossRef CAS.
- Y. Mu, Y. Peng and R. A. Lauten, Electrochim. Acta, 2015, 174, 133–142 CrossRef CAS.
- I. C. Hoare, H. J. Hurst, W. I. Stuart and T. J. White, J. Chem. Soc., Faraday Trans., 1988, 84, 3071–3077 RSC.
- N. Boyabat, A. Özer, S. Bayrakceken and M. Gülaboğlu, Fuel Process. Technol., 2004, 85, 179–188 CrossRef CAS.
- D. Jovanović, J. Therm. Anal. Calorim., 1989, 35, 1483–1492 CrossRef.
- B. Serin and R. Ellickson, J. Chem. Phys., 1941, 9, 742–747 CrossRef CAS.
- Y. Hong and B. Fegley Jr, Phys. Chem., 1997, 101, 1870–1881 CAS.
Footnote |
| † Electronic supplementary information (ESI) available. See DOI: 10.1039/d0cp04576d |
|
| This journal is © the Owner Societies 2021 |
Click here to see how this site uses Cookies. View our privacy policy here.  a,
Chao
Wang
*b,
Peng
Yang
a,
Xu
Zhang
b,
Wei
Chen
b,
Jianqing
Liu
b,
Yixiu
Cui
b,
Xiaojiang
Liu
b and
Xinlu
Li
a,
Chao
Wang
*b,
Peng
Yang
a,
Xu
Zhang
b,
Wei
Chen
b,
Jianqing
Liu
b,
Yixiu
Cui
b,
Xiaojiang
Liu
b and
Xinlu
Li
 *a
*a


 is the average of SRC for different t0, σ is the standard deviation, c is the coefficient of variation which equals dividing σ by

![[thin space (1/6-em)]](https://www.rsc.org/images/entities/char_2009.gif) exp(−Ea/RT)
exp(−Ea/RT)![[thin space (1/6-em)]](https://www.rsc.org/images/entities/char_2009.gif) k vs. 1/T are almost linear. The intercept corresponds to ln
k vs. 1/T are almost linear. The intercept corresponds to ln![[thin space (1/6-em)]](https://www.rsc.org/images/entities/char_2009.gif) A and the slope corresponds to −Ea/R. As a result, the apparent activation energy at 5, 20, 50, and 200 mA cm−2 can be calculated as 48.9, 26.5, 25.7, and 22.4 kJ mol−1, respectively. All the apparent activation energies are smaller than that of about 122 kJ mol−1 with the decomposition in an inert atmosphere, which does not include the electrochemical process.28 Interestingly, the apparent activation energy decreases with the increase of current density. It confirms that the high current density can promote the self-discharge kinetics process of the FeS2 cathode.
A and the slope corresponds to −Ea/R. As a result, the apparent activation energy at 5, 20, 50, and 200 mA cm−2 can be calculated as 48.9, 26.5, 25.7, and 22.4 kJ mol−1, respectively. All the apparent activation energies are smaller than that of about 122 kJ mol−1 with the decomposition in an inert atmosphere, which does not include the electrochemical process.28 Interestingly, the apparent activation energy decreases with the increase of current density. It confirms that the high current density can promote the self-discharge kinetics process of the FeS2 cathode.


