H2-oxidation driven by its behavior of losing an electron over B-doped TiO2 under UV irradiation†
Xiaoxiao
Wang
ab,
Kun
Wang
ab,
Hong
Wang
ab,
Zhongming
Wang
ab,
Xun
Chen
a,
Wenxin
Dai
 *ab and
Xianzhi
Fu
a
aResearch Institute of Photocatalysis, State Key Laboratory of Photocatalysis on Energy and Environment, Fuzhou University, Fuzhou, 350108, China. E-mail: daiwenxin@fzu.edu.cn; Fax: +86-591-22865893; Tel: +86-591-22865893
bKey Laboratory of Eco-materials Advanced Technology (Fuzhou University), Fujian Province University, Fuzhou, 350108, China
First published on 23rd November 2020
Abstract
In this work, TiO2 was modified by doping the electron-deficient B element, and then the gas-sensing response of B-TiO2 to H2 under UV irradiation at room temperature in a N2 atmosphere and the oxidation of H2 over B-TiO2 under corresponding conditions were tested. It was found that H2 would accept an electron when adsorbed on the TiO2 surface, while H2 would donate an electron when adsorbed on the B-TiO2 surface. Correspondingly, H2 could not be oxidized over TiO2, but could be oxidized over B-TiO2. This indicated that the oxidation of H2 was dependent on the electron-transfer behavior between H2 and the surface of TiO2 or B-TiO2. Based on the relevant characterization results, it was proposed that H2 could accept an electron from TiO2 due to the higher Fermi level of TiO2, while H2 could donate an electron to B-TiO2 due to the lower Fermi level of B-TiO2 induced by doping B. This indicated that the electron-transfer behavior between H2 and TiO2 could be changed by adjusting the Fermi level of TiO2, while the electron-transfer behavior would further affect the photocatalytic activity of oxidizing H2. This result shows that the doable H2 photocatalytic oxidation in thermodynamics can be controlled by a kinetics factor (H2 losing-an-electron behavior). This work can be applied to provide an understanding of the photocatalytic oxidation behavior of other reactants over semiconductor materials.
1. Introduction
Heterogeneous catalytic reactions are always accompanied by the adsorption of reactants, wherein the adsorption of reactants sometimes plays a decisive role in the subsequent reaction process.1 Therefore, studying the adsorption behavior of reactants is very essential to explore the heterogeneous catalytic reaction process. As the reaction gas is adsorbed on the surface of semiconductor catalysts (e.g., TiO2, ZnO), a corresponding electron-transfer behavior will be apparent between the semiconductor and adsorbate, which can be explained by the boundary layer theory.2 When a gas is adsorbed on the surface of an n-type semiconductor, if the adsorption energy level of the gas is higher than the Fermi level of the semiconductor, electrons will transfer from the adsorbed gas to the conduction band of the semiconductor, which makes the conductivity of the semiconductor increase. In contrast, if the adsorption energy level of the gas is lower than the Fermi level of the semiconductor, electrons will transfer from the conduction band of the semiconductor to the adsorbed gas, resulting in a decrease of the conductivity of the semiconductor. Gas-sensor detection of the target gas is mainly through testing the change in the sensor’ conductivity when the gas is adsorbed on the sensor,3,4 so we can use such a gas sensor to characterize the conductivity change value when the semiconductor adsorbs the gas, which can reflect the chemisorption strength of the adsorbed gas.5 That is to say, it is beneficial to understand the chemisorption behavior (mainly electron-transfer behavior) of the adsorbed gas on a semiconductor surface by studying the gas-sensing property of the semiconductor.Metal–oxide semiconductors, such as TiO2, ZnO, SnO2, and WO3, usually exhibit good gas sensitivity.6–11 Since semiconductors exhibit the characteristics of light absorption and photoconductivity, it is a novel idea to improve their gas sensitivity by light excitation. Kumar et al.12 found that the introduction of UV light could remarkably enhance the H2-response sensitivity of a nanostructured Au/ZnO thin film. Wang et al.13 reported that UV irradiation also could improve the gas response of TiO2 at room temperature. These results show that illumination can improve the semiconductors’ gas-sensing performance. Considering that TiO2 semiconductors usually exhibit photocatalytic behavior under UV irradiation, may be such photo-assisted gas sensitivity will also play a role in the photocatalytic performance.
In recent years, our group has made some progress in exploring the relation between the photo-assisted gas sensitivity and photocatalytic activity of catalysts. The study of the photocatalytic oxidation of CO over TiO2 under H2-rich conditions showed that only CO could be oxidized under UV irradiation at room temperature, while H2 could not be oxidized.14,15 However, according to the convention of semiconductor photocatalysis, the photocatalytic oxidation reaction that is feasible in thermodynamics can occur if the reduction potential of the reductant is higher than the valence band of the semiconductor.16 As the reduction potential of H+/H2 is higher than the valence band of TiO2,17 H2 should undergo photocatalytic oxidation over TiO2. To explain this unconventional phenomenon, We explored the electron-transfer behaviors of CO and H2 over TiO2 and their oxidation over TiO2 under UV irradiation at room temperature, respectively.18 The results showed that CO could be oxidized because it would donate electrons to TiO2 when CO was adsorbed on the surface of TiO2, whereas H2 could not be oxidized because it would accept electrons from TiO2 when H2 was adsorbed on the surface of TiO2. This result indicated that the photocatalytic oxidation of a reactant over TiO2 is indeed related to the electron-transfer behavior between the reactant and TiO2. Furthermore, we also found that adjusting the Fermi level of TiO2 was likely to change the electron-transfer behavior of the adsorbed H2 on TiO2, and then would change the photocatalytic oxidation behavior of H2.19 As compared to the above TiO2 sample, as-prepared TiO2 (in situ) with surface defects prepared by an in situ method could accept electrons from the adsorbed H2 and could catalytically oxidize H2 under UV irradiation. This was because the TiO2 (in situ) with surface defects had a lower Fermi level, resulting in electrons transferring from the adsorbed H2 to TiO2. Moreover, introducing impurity defects into TiO2 by doping N could further lower the Fermi level of TiO2, resulting in the adsorbed H2 on N-TiO2 losing electrons more easily and being easier oxidized. This study not only showed that H2 photocatalytic oxidation over TiO2 would be dependent on the electron-transfer behavior between the adsorbed H2 and TiO2, but also showed that the introduction of surface defects could adjust the Fermi level of TiO2 and then change the electron-transfer behavior.
The doping of non-metallic elements (e.g., N, C, B) is an effective method to adjust a semiconductor's band gap structure and Fermi level, and it is also conducive to promoting the catalytic reaction efficiency of semiconductors.20–22 In non-metal-doped TiO2 catalysts, B-doping is very efficient in narrowing the band gap and reducing the recombination of charges.23 Geng et al.24 obtained the geometry and electronic structure of B-doped TiO2 by theoretical calculation, and found that the photocatalytic performance of B-doped TiO2 was better than that of simple TiO2. Moon et al.25 found that TiO2 modified by boron oxide had better activity in degrading water under ultraviolet light. Grey and co-workers reported that B-modified rutile TiO2 could convert part of Ti4+ to Ti3+, and as the capture sites of photogenerated electrons, Ti3+ could improve the separation efficiency and consequently the photocatalytic activity.26 A large number of studies have shown that B modification can effectively improve the photocatalytic efficiency of catalysts. Considering that B is an electron-deficient element, doping it into TiO2 may also adjust the Femi level of TiO2, which would cause a change in the electron-transfer behavior of the adsorbed H2 and consequently the photocatalytic efficiency.
Therefore, in this study, the non-metallic element B was doped into TiO2 to prepare B-TiO2, while naked TiO2 acted as the contrast sample. The electron-transfer behaviors of H2 over the two samples were characterized by assessing the photo-assisted gas sensitivity to H2. After comparing the electron-transfer behaviors and photocatalytic H2 oxidation over the two samples, respectively, the correlation between the electron-transfer behavior of H2 and its photocatalytic oxidation over B-TiO2 was explored.
2. Experimental
2.1 Synthesis of TiO2 and B-TiO2
B-TiO2 catalyst was prepared according to the method in the literature.27 First, 1.24 g boric acid powder was dissolved in 50 mL deionized water and then 6.90 mL tetrabutyl titanate was added dropwise to the H3BO3 solution under vigorous stirring at room temperature. After stirring for 12 h, the sample was dried at 100 °C and calcined in air at 500 °C for 1 h. The atomic ratio of B to Ti of the obtained B-TiO2 catalyst was 1. The simple TiO2 catalyst was prepared with the same procedure without H3BO3.2.2. Preparation of the gas sensors
TiO2 and B-TiO2 gas sensors were fabricated by the drop-coating method reported in our previous work.28 First, 30 mg of the as-prepared TiO2 was uniformly dispersed in 1 mL ethanediol solvent by sonicating to obtain a TiO2 suspension. Second, an interdigitated Au electrode (15 mm × 10 mm) was used as the substrate for the gas sensor. Before using it, the electrode was pretreated with acetone, ethanol, and deionized water successively and then dried at 80 °C in an oven. Finally, a 50 μL TiO2 suspension was dropped onto the clean surface of the Au electrode. The coated electrode was then dried at 100 °C and calcined in air at 500 °C for 1 h (heating rate 2 °C min−1). After cooling down to room temperature, a TiO2 gas-sensor device was obtained. Using the same process to replace TiO2 with B-TiO2, a B-TiO2 gas-sensor device was obtained.2.3 Characteristics
The phase and crystal structure of the TiO2 and B-TiO2 powder samples were characterized by X-ray diffraction (XRD, D8 Advance, Brucker, Germany) with Cu Kα radiation (2θ: 10°–80°, data analyzed by X’Pert HighScore). The lattice fringes and selected area diffraction of the samples were tested by TEM (Tecnai G2 F20 S-TWIN). The Raman spectra of the samples were analyzed by using a Renishaw 2000 inVia confocal Raman spectrometer, with the excitation wavelength from a 532 nm Ar+ laser and a scanning range of 100–1000 nm. UV-vis diffuse reflectance spectra (UV-vis DRS) of the samples were recorded with a UV-vis spectrophotometer (Cary-5000, Varian Co.). X-ray photoelectron spectrometry (XPS) was performed with Mg Kα radiation after monochromatic treatment on the ESCALB mk-ii X-ray photoelectron spectrometer. The Fourier-transform infrared (FT-IR) spectra were recorded on a Thermo Scientific Nicolet iS50 FT-IR spectrometer under the transmission scheme using the KBr pellet technique.Electrochemical testing was performed on the Metrohm-Autolab AUT302N Electrochemical workstation, and was conducted in a 3-electrode glass cell setup using the TiO2 film as the working electrode, Ag/AgCl (1 M KCl) as the reference electrode, and Pt wire as the counter electrode. The frequency and amplitude were set to 500, 1000, and 1500 Hz and 5 mV, respectively. Mott–Schottky curves were measured in 0.02 mol L−1 Na2SO4 solution and tested in the dark and in UV light, respectively. Photocurrent tests were also carried out in 0.02 mol L−1 Na2SO4 solution and electrochemical impedance spectroscopy (EIS) was executed in 0.5 M KCl electrolyte containing 0.01 M K3[Fe(CN)6]/K4[Fe(CN)6] (1![[thin space (1/6-em)]](https://www.rsc.org/images/entities/char_2009.gif) :
:![[thin space (1/6-em)]](https://www.rsc.org/images/entities/char_2009.gif) 1) under open-circuit potential conditions. The UV light was supplied by a 500 W Xe lamp (also used as the light source in the other experiments in this work; its spectrogram can be seen in Fig. S1 in the ESI†).
1) under open-circuit potential conditions. The UV light was supplied by a 500 W Xe lamp (also used as the light source in the other experiments in this work; its spectrogram can be seen in Fig. S1 in the ESI†).
Electron paramagnetic resonance (EPR) spectra were registered at a microwave frequency of 9.8 GHz and power of 6.36 Mw by using a Bruker EPR A300 spectrometer and all the EPR spectra were obtained at room temperature.
2.4. Gas-sensing testing
The gas-sensing properties of the films were investigated in a 100 mL chamber, which was made of stainless steel. During the tests, four UV lamps with a wavelength centered at 365 nm (4 W, Philips TL/05) were used as the irradiation source and the total light intensity on the surface of the sensing film was 7.3 mW cm−2, with high-purity N2 introduced into the chamber as the background atmosphere and H2 (balanced against the high-purity N2) used as the probe gas, and the total flow rate was kept at 250 mL min−1. The film-sensor sample was maintained at 200 °C for 1 h in the high-purity N2 before testing (to remove the water and the other gas adsorbates), and was then cooled down to room temperature. In addition, the applied voltage was controlled at 8.5 V in the testing process. The response of the film sensor to the gas was described by the variation of its impedance, and the resistance of the film sensor was measured by using a JF02E gas-sensing test system (Kunming Gui Yan Jin Feng Tech. Corp. Ltd.). The relative gas sensitivity (S) of the sensor sample was defined as| S = |R0 − Rgas|/R0 | (1) |
2.5. Photocatalytic performances
The catalytic oxidation of H2 over the catalyst sample was conducted in a 50 mL quartz reaction tube. First, 0.1 g catalyst with a grain size of 0.2–0.3 mm was loaded on to the bottom of the batch. The reaction gas (including 5 mL high-purity O2, 2.5 mL high-purity H2, and 42.5 mL He) was injected after first vacuuming the tube (to let the reaction gases spread more easily). The tube was then placed in the dark for 10 min to reach a balance, and then 1 mL gas in the tube was extracted for analyzing the contents. Then, the tube was kept in the dark for 50 min, and the H2 and O2 contents were tested. Finally, the reaction tube was illuminated with UV light for 1 h, and the reactants contents were tested again. The reacted gas contents were analyzed using an offline gas chromatograph system equipped with a thermal conductivity detector and a flame ionization detector (Agilent 7890A, Porapark R). Here, since the formed H2O by the H2 oxidation product may be adsorbed at the sample surface, the catalytic activity was evaluated by the decrease in the H2 content.3. Results and discussion
3.1. Characteristics of TiO2 and B-TiO2 samples
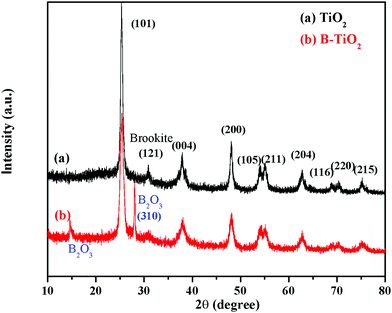
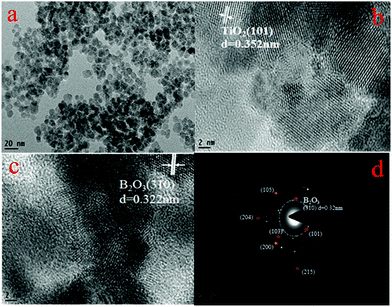
Fig. 1 shows the XRD patterns of the TiO2 and B-TiO2 samples. X’Pert HighScore software was used to analyze the XRD patterns. The diffraction peaks of TiO2 and B-TiO2 were mainly located at 2θ = 25.31°, 37.79°, 48.04°, 53.89°, 55.07°, 62.67°, 68.76°, 70.30°, and 75.05°, which corresponded to the (101), (004), (200), (105), (211), (204), (116), (220), and (215) crystal planes of anatase TiO2. For TiO2, a characteristic diffraction peak appeared at 30.81°, which was the (121) crystal plane of brookite TiO2. Regarding B-TiO2, it showed two characteristic diffraction peaks of B2O3 at 14.56° and 27.77° (310) while the diffraction peak of brookite was reduced. These results demonstrated that the crystal phase of TiO2 was consistent with anatase and a small amount of brookite. After doping B, the crystal phase of B2O3 appeared and the main crystal phase of TiO2 did not change significantly.The TEM and SEAD images of B-TiO2 in Fig. 2 showed that B-TiO2 grain was mainly divided between 4–15 nm by particle-size analysis. The lattice fringes corresponding to each crystal plane were obtained according to the results from the XRD analysis. The (101) crystal plane and (310) crystal plane of B2O3 are shown in the figure, and the main crystal plane was analyzed in the SEAD image.
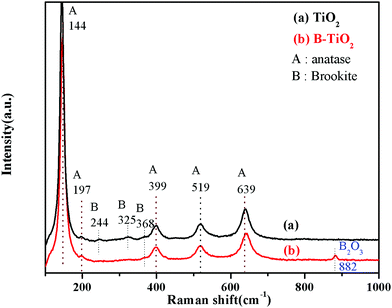
The Raman spectra of TiO2 and B-TiO2 are shown in Fig. 3. TiO2 and B-TiO2 exhibited strong adsorption peaks at 144, 399, 519, and 639 cm−1. These peaks could be assigned to the characteristic vibration peaks of the different positions of anatase TiO2, which were Eg, B1g, B1g, and Eg, respectively.29 A weak characteristic vibration peak of anatase at 197 cm−1 (Eg) and a weak peak of brookite at 368 cm−1 (B2g) were also exhibited, indicating that the sample still contained a small amount of brookite after B modification, which was consistent with the XRD results. For simple TiO2, the vibration peak of brookite appeared at 244 cm−1 (A1g) and 325 cm−1 (B2g). For B-TiO2, the peak at 639 cm−1 was shifted to 643 cm−1, while the characteristic vibration peak that appeared at 882 cm−1 belonged to B2O3,30 indicating that after B-doping, part of the B entered the lattice as ions, and another part remained on the TiO2 surface as B2O3.
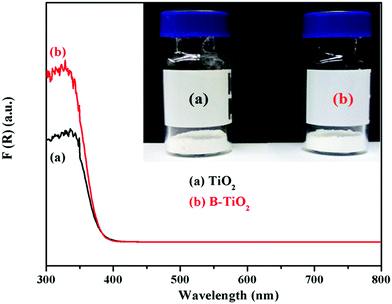
Fig. 4 shows the UV-vis diffuse reflectance spectra of the TiO2 and B-TiO2 samples. As can be seen, both TiO2 and B-TiO2 were white powders, but the UV adsorption of B-TiO2 was stronger than that of TiO2 at 300–370 nm. It could be seen from Fig. 4 that B-doping enhanced the absorption intensity of ultraviolet light, but the absorption band edge did not shift significantly. The values in the absorption band edges of TiO2 and B-TiO2 were 379 and 380 nm, while the corresponding values of the band gap widths of the two samples were calculated to be 3.27 and 3.26 eV, respectively.
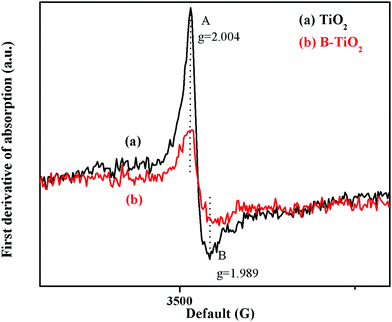
Fig. 5 shows the EPR spectra of the TiO2 and B-TiO2 samples at room temperature in the dark (the EPR signal intensity of each sample was not enhanced when exposed to UV light, so the spectra are not shown here). As can be seen, the EPR signal peak intensity of the material was weakened after B-doping. Here, the peak at g = 2.004 could be assigned to the paramagnetic oxygen species O− or O2−, while the peak at g = 1.989 could be assigned to the surface defects (Ti3+) of anatase.31 Due to B being an electron-deficient element, the 2s orbit of B3+ would overlap with the O2− energy band in TiO2 after B-doping, causing the density of holes to increase, which could capture electrons, so the signal peak of EPR was weakened.
3.2. Surface structures of TiO2 and B-TiO2 characterized by XPS and FT-IR
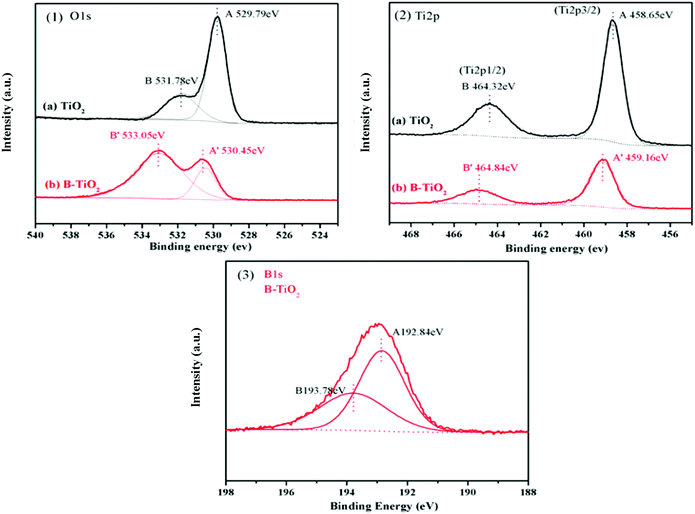
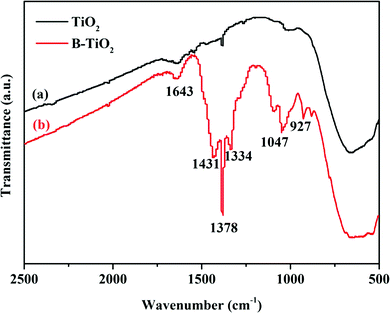
XPS analyses were conducted to elucidate the surface compositions and chemical states of the TiO2 and B-TiO2 samples. As shown in Fig. 6-(1), the two peaks at 529.79 and 531.78 eV in the O1s spectra of TiO2 could be assigned to the lattice oxygen (Ti–O) and the oxygen of the surface hydroxyl (Ti–O–H), respectively. For the O1s spectra of B-TiO2, the peak at 530.45 eV was assigned to the lattice oxygen, while the peak at 533.05 eV was assigned to the oxygen in the B–O bond and surface hydroxyl.32,33 Compared with TiO2, after B-doping, the lattice oxygen exhibited an increased electron-binding energy (from 529.79 to 530.45 eV) but a decreased proportion, while the surface hydroxyl exhibited an increased electron-binding energy (from 531.78 to 533.05 eV) and an increased proportion, indicating that the presence of the B–O bond could cause some lattice oxygen to change to surface hydroxyl. Here, boron doped into the TiO2 lattice as B3+ ions to form Ti–O–B bonds, and as B is an electron-deficient element, doping B could enhance the Lewis acidity on the B-TiO2 surface, which would lead to an increase in the surface hydroxyl groups, so that the amount of adsorbed species would increase.34–36 For the Ti 2p spectra shown in Fig. 6-(2), the peaks at 458.65 and 464.32 eV, respectively, were related to Ti 2p3/2 and Ti 2p1/2 of TiO2, while the corresponding peaks of B-TiO2 were shifted to 459.16 and 464.84 eV, respectively, indicating that doping B reduced the electron density of Ti 2p. For the B 1s spectra in Fig. 6-(3), the peaks at 192.84 and 193.78 eV could be assigned to the Ti–O–B bond and the B–O–B bond, respectively.37The FT-IR spectra of TiO2 and B-TiO2 were obtained to further explain the existing forms of the various bonds in B-TiO2. As shown in Fig. 7, both TiO2 and B-TiO2 showed a vibrational band at 1643 cm−1, which may be assigned to the surface-adsorbed water and hydroxyl groups,27 while the band at 1378 cm−1 corresponded to the C–H bending vibrations, and the broad peak at 656 cm−1 corresponded to the Ti–O bond in TiO2.38 After doping B, the characteristic peaks related to B appeared. The peak at 1431 cm−1 may be attributed to the Ti–O–B bond, whereas the peak at 1334 cm−1 may be ascribed to the stretching vibrations of the B–O bond of BO3 units,27,39 and the peaks observed at 1047 and 927 cm−1 may be attributed to the valence vibrations of the B–O bonds in BO4 units.40 These results were consistent with the XPS analysis results.
3.3. Mott–Schottky plots of the TiO2 and B-TiO2 samples
The conduction band position of an n-type semiconductor is very close to the position of its Fermi level,41,42 and so the flat-band potential could approximately be regarded as the Fermi level. Here, a series of Mott–Schottky plots of the TiO2 and B-TiO2 samples were performed to further investigate the influence of B-doping on the Fermi level of TiO2.Fig. 8 displays the Mott–Schottky plots of the TiO2 and B-TiO2 samples in the dark or under UV irradiation, respectively. The flat-band potential (corresponding to EF) with respect to the Ag/AgCl (1M KCl) electrode could be measured at different frequencies (500, 1000, and 1500 Hz) of the Mott–Schottky plots. In the dark condition, the flat-band potentials of TiO2 and B-TiO2 were −1.18 and −0.88 V, respectively. Under UV irradiation, the flat-band potentials of TiO2 and B-TiO2 were −1.31 and −0.92 V, respectively. This phenomenon indicated that doping B could reduce the Fermi level of TiO2. However, the Fermi level of B-TiO2 only had a slight change under UV irradiation, which was due to the electron accumulation in the semiconductor determining the position of the Fermi level, and as more electrons accumulated, the more negative the Fermi level became.43,44 After doping an electron-deficient element, the density of holes increased, which could capture the photogenerated electrons; this phenomenon could also be observed in the transient photocurrent response results and the electrochemical impedance spectra (see Fig. S2 and S3 in the ESI†). The positions of the conduction band (vs. RHE) of TiO2 and B-TiO2 were −0.53 and −0.23 V in the dark, and −0.66 and −0.27 V under UV irradiation, respectively (see Table 1).
ERHE = EAg/AgCl + 0.059![[thin space (1/6-em)]](https://www.rsc.org/images/entities/char_2009.gif) pH + EθAg/AgCl (1 MKCl) pH + EθAg/AgCl (1 MKCl) | (2) |
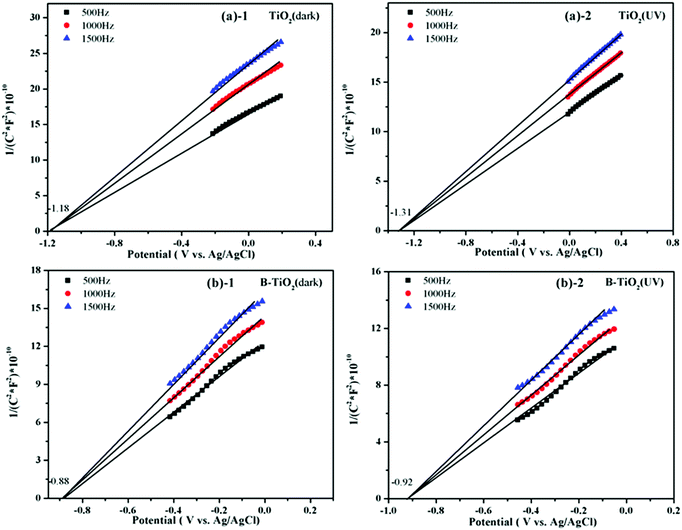 | ||
| Fig. 8 Mott–Schottky plots (the graph is from the point of taking the same number dots of straight lines.): (a)-1 TiO2 (in dark), (a)-2 TiO2 (UV); (b)-1 B-TiO2 (in dark), (b)-2 B-TiO2 (UV). | ||
| Samples | Fermi level value in the dark (EF), V | Fermi level value under UV irradiation (EF*), V | ||
|---|---|---|---|---|
| vs. Ag/AgCl | vs. RHE | vs. Ag/AgCl | vs. RHE | |
| TiO2 | −1.18 | −0.53 | −1.31 | −0.66 |
| B-TiO2 | −0.88 | −0.23 | −0.92 | −0.27 |
3.4. Gas-sensing responses of the sensor samples
Fig. 9 shows the gas-sensing responses of the TiO2 and B-TiO2 sensor samples to H2 under UV light irradiation at room temperature in a N2 atmosphere. It was found that the impedances of the TiO2 and B-TiO2 sensor samples decreased rapidly when the UV light was introduced, which could be attributed to the production of photogenerated electrons. With the recombination of the photogenerated electrons and holes, the impedances picked up gradually. For the TiO2 sample, when H2 was just introduced, there was a sudden change in the impedance because the surface state of TiO2 changed after H2 adsorption. Afterwards, the impedance presented an upward trend, indicating that the adsorbed H2 would accept electrons from TiO2. In the cycle test, it was found that the impedance value tended to reach a stable state with the extension of the H2 introduction time, indicating that the adsorption of H2 on the surface of TiO2 gradually reached saturation. For the B-TiO2 sample, the impedance decreased continuously after passing through H2, which indicated an increase in electron density on the B-TiO2 surface, i.e., the adsorbed H2 would donate an electron to B-TiO2. Moreover, as H2 gas was continuously introduced, the impedance decreased and then slowly rose to reach equilibrium, indicating that H2 adsorption on the B-TiO2 surface reached saturation. That is, the B-doping into TiO2 changed the electron-transfer direction between H2 and TiO2. Here, B-TiO2 was conducive to obtaining an electron from H2, which may be ascribed to the change in the Fermi level of TiO2 induced by doping B.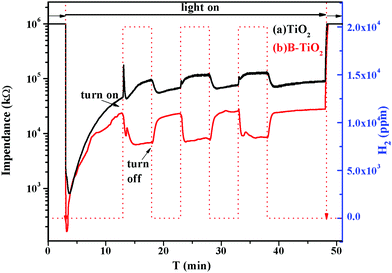 | ||
| Fig. 9 Gas-sensing responses to H2 under UV light irradiation at room temperature in N2 atmosphere over the TiO2 (a) and B-TiO2 (b) sensor samples. | ||
The above gas–sensitivity values (S) of the TiO2 and B-TiO2 sensor samples (the selected data were from the second cycle experimental data) from Fig. 9 are also shown in Table 2. According to formula (1), the gas-sensitivity value of TiO2 was calculated as 1.55 and that of B-TiO2 was 2.91. These results suggested that doping B could not only facilitate H2 to provide electrons to the B-TiO2 surface, but also improved the sensitivity of the H2 gas response.
| Sensor samples | R 0 (KΩ) | R gas (KΩ) | S | Electron-transfer direction |
|---|---|---|---|---|
| R 0 was assigned to the last impedance value prior to introducing H2; Rgas was assigned to the lowest value after introducing H2; S was assigned to the gas–sensitive response value. | ||||
| TiO2 | 73786.50 | 114992.97 | 1.55 | From TiO2 to H2 |
| B-TiO2 | 22308.08 | 7661.13 | 2.91 | From H2 to B-TiO2 |
3.5. Photocatalytic activities of the TiO2 and B-TiO2 samples
The results from the gas-sensitivity tests showed that H2 could accept electrons when adsorbed on TiO2, but it would donate electrons when adsorbed on B-TiO2. According to our previous work,18 the adsorbed H2 over B-TiO2 (H2 losing electrons) under UV irradiation should be oxidized over B-TiO2, but that of H2 (accepting electrons) could be not oxidized over TiO2. To further prove the relationship between the electron-transfer behavior and photocatalytic activity, the photocatalytic performances of oxidizing H2 over TiO2 and B-TiO2 were tested under UV irradiation at room temperature. Table 3 shows the experimental results for the TiO2 and B-TiO2 photocatalytic oxidation of H2. After reacting for 1 h in the dark, it was found that the concentration of H2 over both TiO2 and B-TiO2 was reduced slightly because of the adsorption of H2. However, after reacting for a further 1 h under UV irradiation, the concentration of H2 over TiO2 only had a tiny decrease while the concentration of H2 over B-TiO2 was decreased obviously, indicating that H2 adsorption on TiO2 involved only physical adsorption, but involved chemical adsorption on B-TiO2, and thus further reacted with O2. Hence, B-TiO2 could catalytically oxidize H2 under UV irradiation, but TiO2 hardly did. These results confirmed that there indeed was a certain relationship between the electron-transfer behavior (photo-assisted gas sensitivity) and photocatalytic activity.| Samples | Initial concentration of H2 (ppm) | Concentration of H2 in the dark for 1 h (ppm) | Concentration of H2 under UV light for 1 h (ppm) | Characteristic |
|---|---|---|---|---|
| a The concentration decrease value of H2 in the dark or under UV light for 1 h (ppm). b O2 contents (not shown here) also decreased, indicating that H2 was oxidized by O2. | ||||
| TiO2 | 67670.95 | 60491.94(−7179.01)a | 56961.28(−3530.66)a | H2 not oxidized |
| B-TiO2 | 58185.24 | 52830.41(−5354.83)a | 41073.32(−11757.09)a | H2 oxidized |
3.6. Proposed process of electron transfer over TiO2 and B-TiO2 absorbing H2
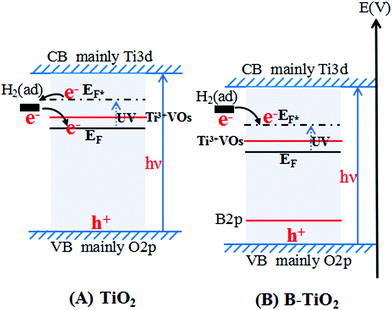
Based on the above series of experimental studies and our previous work,19 we summarized the correlation between the H2 sensing response and the oxidation of H2 over TiO2 and B-TiO2 under UV irradiation (see Table 4), and then proposed the process of electron transfer over TiO2 and B-TiO2 absorbing H2, as shown in Fig. 10. For TiO2 (Fig. 10-(A)), from a thermodynamic point of view, H2 could be oxidized by TiO2, but the photocatalytic experiment results showed that H2 could not be oxidized by TiO2, which was related to the surface adsorption energy level of H2 (H2 (ad)) and the position of the Fermi level of TiO2 (i.e., EF). Generally, the H2 (ad) was higher than the Fermi level of TiO2, so H2 could provide electrons to TiO2. Under UV irradiation, the Fermi level of TiO2 (i.e., EF*) rose, even higher than the energy level of H2 (ad), resulting in H2 accepting electrons from TiO2 and then H2 could not undergo photocatalytic oxidation. For B-TiO2 (Fig. 10-(B)), doping B introduced an impurity energy level B2p, which effectively reduced the position of the Fermi level of TiO2 (i.e., EF). Under UV irradiation, the Fermi level of B-TiO2 (i.e., EF*) was lower than the energy level of H2 (ad), and thus H2 could donate electrons to B-TiO2 and could undergo photocatalytic oxidation over B-TiO2.| Samples | Fermi level value (V) under UV irradiation | Electron-transfer direction | H2 oxidation under UV irradiation |
|---|---|---|---|
| TiO2 | −1.31 | From TiO2 to H2 | No |
| B-TiO2 | −0.92 | From H2 to B-TiO2 | Yes |
The above results further showed that the oxidation of H2 would be actually dependent on the electron-transfer behaviors of the adsorbed H2 induced by the Fermi level of TiO2 and B-TiO2, suggesting that the photocatalytic oxidation of H2 over a semiconductor was controlled by both the thermodynamics and kinetics. Here, the behavior of H2 of losing an electron, as a kinetics factor, would play a key role in its photocatalytic oxidation. Moreover, doping some elements into TiO2 could adjust the Fermi level of TiO2-based semiconductors. This viewpoint may provide a greater applicable understanding for studying the photocatalytic oxidation behaviors of other reactants over other semiconductor materials.
4. Conclusions
In this study, TiO2 was modified by doping the electron-deficient B element to obtain a B-TiO2 sample. After investigating the photo-assisted gas sensitivity (electron-transfer behavior), the photocatalytic activity, and performing other characterizations of B-TiO2, the following conclusions could be obtained:(I) Compared with the simple TiO2, the B-doped TiO2 formed a Ti-O-B bond, which reduced the Fermi level of B-TiO2.
(II) The photo-assisted gas sensitivity to H2 in N2 atmosphere indicated that H2 would act as an electron acceptor when adsorbed on the TiO2 surface, while it acted as an electron donor when adsorbed on the B-TiO2 surface.
(III) H2 could not be oxidized over TiO2 by O2, but it could be oxidized over B-TiO2, indicating a losing-an-electron behavior of the adsorbed H2 to drive H2 oxidation over B-TiO2.
(IV) The change in the Fermi level altered the electron-transfer behavior of H2 over TiO2, which further affected the photocatalytic performances.
Overall, H2 photocatalytic oxidation over a semiconductor would be controlled not only by the thermodynamics but also by the kinetics, and the losing-an-electron behavior of H2, as a kinetics factor, could play a key role in its photocatalytic oxidation. This conclusion may be applicable for other semiconductors.
Conflicts of interest
There are no conflicts to declare.Acknowledgements
This work was financially supported by the National Key R & D Program of China (No. 2018YFE0208500) and the National Natural Science Foundation of China (No. 21872030).References
- B. Yang, R. Burch, C. Hardacre, G. Headdock and P. Hu, Understanding the optimal adsorption energies for catalyst screening in heterogeneous catalysis, ACS Catal., 2014, 4, 182–186 CrossRef CAS.
- S. R. Morrison, The Chemical Physics of Surface, Plenum Press, New York, 1977 Search PubMed.
- A. Mirzaei, S. S. Kim and H. W. Kim, Resistance-based H2S gas sensors using metal oxide nanostructures: a review of recent advances, J. Hazard. Mater., 2018, 357, 314–331 CrossRef CAS PubMed.
- E. Lee, A. VahidMohammadi, B. C. Prorok, Y. S. Yoon, M. Beidaghi and D. J. Kim, Room temperature gas-sensing of two-dimensional titanium carbide (MXene), ACS Appl. Mater. Interfaces, 2017, 9, 37184–37190 CrossRef CAS PubMed.
- W. Göpel and G. Rocker, Phys. Rev. B: Solid State, 1983, 28, 3427–3438 CrossRef.
- I. Cho, Y. C. Sim, M. Cho, Y. H. Cho and I. Park, Monolithic micro light-emitting diode/metal oxide nanowire gas sensor with microwatt-level power consumption, ACS Sens., 2020, 5, 563–570 CrossRef CAS PubMed.
- A. V. Raghu, K. K. Karuppanan, J. Nampoothiri and B. Pullithadathil, Wearable, flexible ethanol gas sensor based on TiO2 nanoparticles-grafted 2D-titanium carbide nanosheets, ACS Appl. Nano Mater., 2019, 2, 1152–1163 CrossRef CAS.
- R. K. Sonker, S. R. Sabhajeet, S. Singh and B. C. Yadav, Synthesis of ZnO nanopetals and its application as NO2 gas sensor, Mater. Lett., 2015, 152, 189–191 CrossRef CAS.
- X. Y. Kou, F. Q. Meng, K. Chen, T. S. Wang, P. Sun, F. M. Liu, X. Yan, Y. F. Sun, F. M. Liu, K. Shimanoe and G. Lu, High-performance acetone gas sensor based on Ru-doped SnO2 nanofibers, Sens. Actuators, B, 2020, 320, 128292–128299 CrossRef CAS.
- G. Jung, Y. Jeong, Y. Hong, M. Wu, S. Hong, W. Shin, J. Park, D. Jang and J. H. Lee, SO2 gas sensing characteristics of FET- and resistor-type gas sensors having WO3 as sensing material, Solid State Electronics, 2019, 165, 107747–107753 CrossRef.
- A. Nikfarjam, S. Hosseini and N. Salehifar, Fabrication of a highly sensitive single aligned TiO2 and gold nanoparticle embedded TiO2 nano-fiber gas sensor, ACS Appl. Mater. Interfaces, 2017, 9, 15662–15671 CrossRef CAS PubMed.
- G. S. Kumar, X. J. Li, Y. Du, Y. F. Geng and X. M. Hong, UV-light enhanced high sensitive hydrogen (H2) sensor based on spherical Au nanoparticles on ZnO nano-structured thin films, J. Alloys Compd., 2019, 798, 467–477 CrossRef CAS.
- P. Wang, T. F. Xie, L. Peng, H. Y. Li, T. S. Wu, S. Pang and D. G. Wang, Water-assisted synthesis of anatase TiO2 nanocrystals:
![[thin space (1/6-em)]](https://www.rsc.org/images/entities/char_2009.gif) Mechanism and sensing properties to oxygen at room temperature, J. Phys. Chem. C, 2008, 112, 6648–6652 CrossRef CAS.
Mechanism and sensing properties to oxygen at room temperature, J. Phys. Chem. C, 2008, 112, 6648–6652 CrossRef CAS. - W. X. Dai, X. Chen, X. X. Wang, P. Liu, D. Z. Li, G. S. Li and X. Z. Fu, CO preferential oxidation promoted by UV irradiation in the presence of H2 over Au/TiO2, Phys. Chem. Chem. Phys., 2008, 10, 3256–3262 RSC.
- W. X. Dai, X. Chen, X. P. Zheng, Z. X. Ding, X. X. Wang, P. Liu and X. Z. Fu, Photocatalytic oxidation of CO on TiO2: Chemisorption of O2, CO, and H2, ChemPhysChem, 2009, 10, 411–419 CrossRef CAS PubMed.
- S. Y. Chen and L. W. Wang, Thermodynamic oxidation and reduction potentials of photocatalytic semiconductors in aqueous solution, Chem. Mater., 2012, 24, 3659–3666 CrossRef CAS.
- J. G. Yu, Y. Hai and B. Cheng, Enhanced photocatalytic H2-production activity of TiO2 by Ni(OH)2 cluster modification, J. Phys. Chem. C, 2011, 115, 4953–4958 CrossRef CAS.
- X. Y. Peng, Z. J. He, K. Yang, X. Chen, X. X. Wang, W. X. Dai and X. Z. Fu, Correlation between donating or accepting electron behavior of the adsorbed CO or H2 and its oxidation over TiO2 under ultraviolet light irradiation, Appl. Surf. Sci., 2016, 360, 698–706 CrossRef CAS.
- K. Wang, T. Peng, Z. M. Wang, H. Wang, X. Chen, W. X. Dai and X. Z. Fu, Correlation between the H2 response and its oxidation over TiO2 and N doped TiO2 under UV irradiation induced by Fermi level, Appl. Catal., B, 2019, 250, 89–98 CrossRef CAS.
- W. Qian, P. A. Greaney, S. Fowler, S. K. Chiu, A. M. Goforth and J. Jiao, Low-temperature nitrogen doping in ammonia solution for production of N-doped TiO2-hybridized graphene as a highly efficient photocatalyst for water treatment, ACS Sustainable Chem. Eng., 2014, 2, 1802–1810 CrossRef CAS.
- R. Borah, R. Borah and S. Paria, Carbon-doped mesoporous anatase TiO2 multi-tubes nanostructures for highly improved visible light photocatalytic activity, Inorg. Chem., 2017, 56, 10107–10116 CrossRef PubMed.
- N. D. Feng, A. M. Zheng, Q. Wang, P. P. Ren, X. Z. Gao, S. B. Liu, Z. R. Shen, T. H. Chen and F. Deng, Boron environments in B-doped and (B, N)-codoped TiO2 photocatalysts: A combined solid-State NMR and theoretical calculation Study, J. Phys. Chem. C, 2011, 115, 2709–2719 CrossRef CAS.
- N. Patel, A. Dashora, R. Jaiswal, R. Fernandes, M. Yadav, D. C. Kothari, B. L. Ahuja and A. Miotello, Experimental and theoretical investigations on the activity and stability of substitutional and interstitial boron in TiO2 photocatalyst, J. Phys. Chem. C, 2015, 119, 18581–18590 CrossRef CAS.
- H. Geng, S. W. Yin, X. Yang, Z. G. Shuai and B. G. Liu, Geometric and electronic structures of the boron-doped photocatalyst TiO2, J. Phys.: Condens. Matter., 2006, 18, 87–96 CrossRef CAS.
- S. C. Moon, H. Mametsuka, S. Tabata and E. Suzuki, Photocatalytic production of hydrogen fromwater using TiO2 and B/TiO2, Catal. Today, 2000, 58, 125–132 CrossRef CAS.
- I. E. Grey, C. Li, C. M. MacRae and L. A. Bursill, Boron incorporation into rutile. Phase equilibria and structure considerations, J. Solid State Chem., 1996, 127, 240–247 CrossRef CAS.
- D. M. Chen, D. Yang, Q. Wang and Z. Y. Jiang, Effects of boron doping on photocatalytic activity and microstructure of titanium dioxide nanoparticles, Ind. Eng. Chem. Res., 2006, 45, 4110–4116 CrossRef CAS.
- X. Y. Peng, Z. M. Wang, P. Huang, X. Chen, X. Z. Fu and W. X. Dai, Comparative study of two different TiO2 film sensors on response to H2 under UV Light and room temperature, Sensors, 2016, 16, 1249 CrossRef PubMed.
- C. P. Kumar, N. O. Gopal, T. C. Wang, M. S. Wong and S. C. Ke, EPR investigation of TiO2 nanoparticles with temperature dependent properties, J. Phys. Chem. B, 2006, 110, 5223–5229 CrossRef CAS PubMed.
- Z. Wang, Q. F. Shu and K. C. Chou, Study on structure characteristics of B2O3 and TiO2-bearing F-free mold flux by Raman spectroscopy, High Temp. Mater. Processes, 2013, 32, 265–273 CAS.
- K. Y. Jung, S. B. Park and S. K. Ihm, Local structure and photocatalytic activity of B2O3-SiO2/TiO2 ternary mixed oxides prepared by sol-gel method, Appl. Catal., B, 2004, 51, 239–245 CrossRef CAS.
- A. Zaleska, J. W. Sobczak, E. Grabowska and J. Hupka, Preparation and photocatalytic activity of boron-modified TiO2 under UV and visible light, Appl. Catal., B, 2008, 78, 92–100 CrossRef CAS.
- H. Yang, Y. Z. Wang and X. X. Xue, Influences of glycerol as an efficient doping agent on crystal structure and antibacterial activity of B-TiO2 nano-materials, Colloids Surf., B, 2014, 122, 701–708 CrossRef CAS PubMed.
- A. Ansón-Casaos, M. J. Sampaio, C. Jarauta-Córdoba, M. T. Martínez, C. G. Silva, J. L. Faria and A. M. T. Silva, Evaluation of sol-gel TiO2 photocatalysts modified with carbon or boron compounds and crystallized in nitrogen or air atmospheres, Chem. Eng. J., 2015, 277, 11–20 CrossRef.
- Y. Wang, K. Jia, Q. Pan, Y. D. Xu, Q. Liu, G. W. Cui, X. D. Guo and X. P. Sun, Boron-doped TiO2 for efficient electrocatalytic N2 fixation to NH3 at ambient conditions, ACS Sustainable Chem. Eng., 2019, 7, 117–122 CrossRef CAS.
- M. Quesada-González, N. D. Boscher, C. J. Carmalt and I. P. Parkin, Interstitial boron-doped TiO2 thin films: the significant effect of boron on TiO2 coatings grown by atmospheric pressure chemical vapor deposition, ACS Appl. Mater. Interfaces, 2016, 8, 25024–25029 CrossRef PubMed.
- Y. N. Huo, X. Y. Zhang, Y. Jin, J. Zhu and H. X. Li, Highly active La2O3/Ti1−xBxO2 visible light photocatalysts prepared under supercritical conditions, Appl. Catal., B, 2008, 83, 78–84 CrossRef CAS.
- Y. Zhang, A. Barber, J. Maxted, C. Lowe, R. Smith and T. Z. Li, The depth profiling of TiO2 pigmented coil coatings using step scan phase modulation photoacoustic FTIR, Prog. Org. Coat., 2013, 76, 131–136 CrossRef CAS.
- N. D. Feng, A. M. Zheng, Q. Wang, P. P. Ren, X. Z. Gao, S. B. Liu, Z. R. Shen, T. H. Chen and F. Deng, Boron environments in B-doped and (B, N)-codoped TiO2 photocatalysts: A combined solid-state NMR and theoretical calculation study, J. Phys. Chem. C, 2011, 115, 2709–2719 CrossRef CAS.
- S. Kabi and A. Ghosh, Correlation of structure and electrical conductivity of CdI2 doped silver borophosphate glass and nanocomposite, J. Phys. Chem. C, 2011, 115, 9760–9766 CrossRef CAS.
- J. Yu, Y. L. Yang, R. Q. Fan, D. Q. Liu, L. G. Wei, S. Chen, L. Li, B. Yang and W. W. Cao, Enhanced near-infrared to visible upconversion nanoparticles of Ho3+-Yb3+-F– tri-doped TiO2 and its application in dye-sensitized solar cells with 37% improvement in power conversion efficiency, Inorg. Chem., 2014, 53, 8045–8053 CrossRef CAS PubMed.
- S. Burnside, J. E. Moser, K. Brooks, M. Grätzel and D. Cahen, Nanocrystalline mesoporous strontium titanate as photoelectrode material for photosensitized solar devices: increasing photovoltage through flatband potential engineering, J. Phys. Chem. B, 1999, 103, 9328–9332 CrossRef CAS.
- M. Jakob, H. Levanon and P. V. Kamat, Charge distribution between UV-irradiated TiO2 and gold nanoparticles: determination of shift in the Fermi Level, Nano Lett., 2003, 3, 353–358 CrossRef CAS.
- V. Subramanian, E. E. Wolf and P. V. Kamat, Catalysis with TiO2/Gold nanocomposites. Effect of metal particle size on the Fermi Level equilibration, J. Am. Chem. Soc., 2004, 126, 4943–4950 CrossRef CAS PubMed.
- A. J. E. Rettie, K. C. Klavetter, J. F. Lin, A. Dolocan, H. Celio, A. Ishiekwene, H. L. Bolton, K. N. Pearson, N. T. Hahn and C. B. Mullins, Improved visible light harvesting of WO3 by incorporation of sulfuror iodine: a tale of two impurities, Chem. Mater., 2014, 26, 1670–1677 CrossRef CAS.
Footnote |
| † Electronic supplementary information (ESI) available. See DOI: 10.1039/d0cp04039h |
| This journal is © the Owner Societies 2021 |

