Filament dynamics in planar chemical gardens
Received
9th July 2020
, Accepted 6th February 2021
First published on 8th February 2021
Abstract
Filaments in a planar chemical garden grow following tortuous, erratic paths. We show from statistical mechanics that this scaling results from a self-organized dispersion mechanism. Effective diffusivities as high as 10−5 m2 s−1 are measured in 2D laboratory experiments. This efficient transport is four orders of magnitude larger than molecular diffusion in a liquid, and ensures widespread contact and exchange between fluids in the chemical-garden structure and its surrounding environment.
1 Introduction
Chemical gardens are classical examples of non-equilibrium systems, which self-organise to produce precipitate structures.1,2 They are often grown by immersing a solid ‘seed’ of a metal salt into a solution of an anion such as silicate, carbonate, or hexacyanoferrate. The reaction precipitates a semipermeable membrane, which ruptures under osmotic pressure to discharge a plume or jet of reactive solution. These plumes act as fluid templates around which a sheath of material precipitates, leading to the growth of tubes looking somewhat like the stalks of plants; hence ‘chemical garden’. In many instances these tubes display a complex directional growth behaviour. This is true both in experiments on Earth and those performed in the microgravity environment of space.3 In order to simplify the physical system, controlled injection of the metal salt solution has been used. Steinbock et al.4 identified ‘jetting’, ‘popping’ and ‘budding’ regimes of tube growth with decreasing buoyancy of the injected metal-salt solution. Whilst in the first regime straight tubes are formed, these become wavy in the second, and have balloon-like structures in the last.4,5
With the aim of being better able to perform quantitative analyses, chemical gardens have been grown in confined geometries.6–8 Within a quasi-2D geometry, a wealth of modes of growth can be observed, ranging from flower, to spiral, and worm-like structures for increasing cobalt-chloride concentration injected into a sodium silicate solution. Haudin et al.6 characterised the spiral-shaped precipitates and showed that they are logarithmic. Filaments – analogous structures to the tubes in 3D – are prominent at high concentration of both reactants and sufficiently large injection flowrate. These are not due to Saffman–Taylor instability9 and likewise display tortuous trajectories in a similar manner to their 3D counterparts. Recently, Brau et al.10 quantified the erratic motion of filaments formed from the injection of the metal salt solution in a two-dimensional configuration. They identified the superposition of a linear growth term associated with advection of the injected fluid and a sublinear dispersive term.
Ding et al.11 observed the formation of a wavy precipitate surface in a one-dimensional chemical garden. They showed that ion transport towards this surface was enhanced by the interaction of the advective vertical flow and the wavy surface. This rich variety of growth regimes and tubular structures described above arises owing to the complex dynamics of the flow, chemical reaction, and flow-structure interactions present in a chemical garden. Different patterns can thus be observed by changing the chemical system12–14 or the injection flow rate5,12,15–18 in a chemical garden experiment. A key factor affecting the appearance of different patterns is the properties of the membrane formed during the reaction. The thickness of this membrane is time dependent19,20 and will continually influence the interactions between the two reactants. The prediction and quantitative description of the spatio-temporal dynamics of these systems remains one of the fundamental challenges.
In the present work, we contribute to this programme with an analysis of the dynamics of filaments in planar chemical gardens.
2 Experimental methods
Experiments were performed in a Hele-Shaw cell consisting of two circular perspex plates with a diameter of 30 cm separated by a gap of 0.5 or 1.0 mm, as shown in Fig. 1. The procedure consisted in initially filling the cell with a host solution, and then pumping an injected solution with a syringe pump. Sodium silicate was used as the host solution, with concentrations of 6.25 or 3.13 M. These were prepared by dilution of a commercial solution of sodium silicate. Three different metal salts, cobalt chloride, copper sulfate and manganese chloride were used as the injected solutions. These solutions were prepared by dissolution of the powder in water. The different chemical systems and the ranges of experimental conditions tested in this work are presented in Table 1. In order to study the pressure dynamics of the experiments, a relative pressure gauge (PS-2114 PASCO Scientific) was connected to the tubing between the cell and the syringe in the pump. The cell was placed on top of a light pad for illumination, and pictures of the flow and precipitation pattern were taken from above with a Nikon D300s digital single-lens reflex camera (DSLR, 4288 × 2848 pixels) with a Hoya circular polarizing lens filter. The pictures covered an area of 146 × 97 mm2 and were captured at a rate of 1/2 Hz.
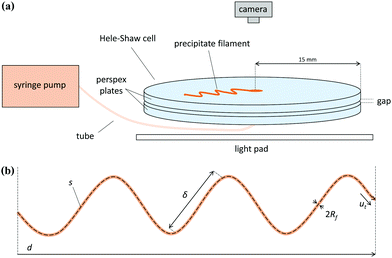 |
| | Fig. 1 (a) Schematic of the Hele-Shaw cell set-up. (b) Generic shape of a precipitate filament, with the different variables that characterize it: arc length s, euclidean distance d, typical distance between turns δ, width 2Rf and speed of the tip ut. | |
Table 1 Regimes observed for the different chemical systems studied in this work. Blank squares, filled squares and blank triangles represent the regimes with no filaments, one filament and multiple filaments, respectively. The last column presents a condensed reference for each experiment. Most figures present data as a function of flow rate or a variable proportional to flow rate, so the experiment reference will have an “X” as shown in this table. When the data in a figure refers to an experiment performed at a specific flow rate, the respective legend will indicate the flow rate value after Q
|
Q (mL min−1) |
|
H (mm) |
Chemical system |
0.1 |
0.5 |
1.0 |
1.5 |
2.0 |
3.0 |
6.0 |
Experiment name |
| 0.5 |
Na2SiO3 3.13 M |
|
□ |
■ |
|
■ |
■ |
Δ |
SS3.13 CC0.63 QX H0.5 |
| CoCl2 0.63 M |
| Na2SiO3 6.25 M |
□ |
■ |
■ |
|
■ |
Δ |
Δ |
SS6.25 CC0.63 QX H0.5 |
| CoCl2 0.63 M |
| Na2SiO3 3.13 M |
□ |
■ |
■ |
■ |
Δ |
|
|
SS3.13 CC1.00 QX H0.5 |
| CoCl2 1.00 M |
| Na2SiO3 6.25 M |
|
□ |
■ |
■ |
Δ |
Δ |
|
SS6.25 CS0.30 QX H0.5 |
| CuSO4 0.30 M |
| Na2SiO3 6.25 M |
□ |
■ |
■ |
|
■ |
Δ |
|
SS6.25 MC1.00 QX H0.5 |
| MnCl2 1.00 M |
|
|
| 1.0 |
Na2SiO3 3.13 M |
|
□ |
■ |
|
■ |
■ |
Δ |
SS3.13 CC0.63 QX H1.0 |
| CoCl2 0.63 M |
| Na2SiO3 6.25 M |
|
|
■ |
|
|
■ |
■ |
SS6.25 CC0.63 QX H1.0 |
| CoCl2 0.63 M |
| Na2SiO3 3.13 M |
|
|
■ |
|
|
■ |
Δ |
SS3.13 CC1.00 QX H1.0 |
| CoCl2 1.00 M |
These precipitate filaments spread randomly around the cell, as shown in Fig. 2. In order to quantify the properties of the filaments, MATLAB was used for image analysis, following a method published in the literature.10 An image of a single filament was first binarized and then skeletonized, which consists in thinning the filament to a single pixel in width. The arc length s and the Euclidean length d of the filament were then obtained from the coordinates of the points of the skeletonized figure. From the parametric curves x(s) and y(s) that define the trajectory of the filament, it is possible to calculate the curvature of the filament along its arc length, thus allowing the identification of each turn in its trajectory. The average distance between turns δ was determined as the ratio between the total length of the filament and the number of turns. Since photographs were taken every two seconds, the time it took for a filament segment to cover a certain length s was known, allowing the determination of the speed of the filament ut.
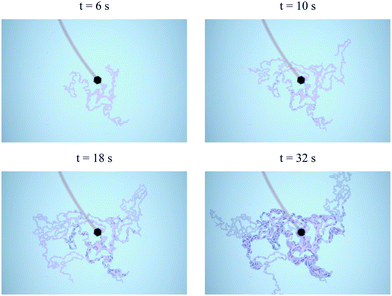 |
| | Fig. 2 Onset of multiple precipitate filaments in a Hele-Shaw cell; t denotes the time after the appearance of the first filament. Each filament tip moves with speed ut and changes direction after short rectilinear paths of preferred length δ. The erratic trajectory of the filament tips leads to a dispersion in the distance between each tip and the position of an ensemble of tips. Field of view of each image: 146 × 97 mm2, experimental conditions: SS3.13 CC1.00 Q2 H0.5 (Table 1). | |
3 Experimental observations
A variation in the injection flow rate of the metal salt solution leads to the appearance of three different regimes, as shown in Fig. 3. No filaments appear for low flow rates, with the precipitate structure growing radially around the nozzle with a “shell” pattern instead. Indeed, filaments require a minimum flow rate in order to exist; below that threshold the radial growth always occurs instead. An increase in the flow rate leads to the formation of a single filament, and a further increase in flow rate will eventually lead to the onset of multiple filaments at once. From that point onwards, higher flow rates will simply affect the number of filaments that are formed.21
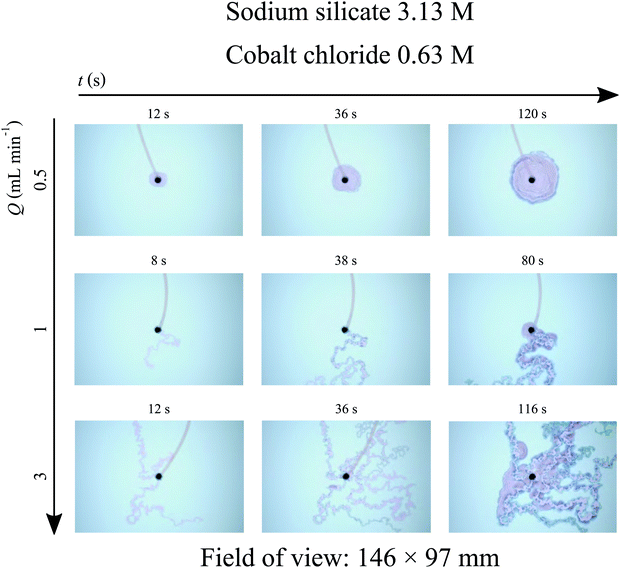 |
| | Fig. 3 Time sequence of photographs taken during experiments with cobalt chloride and sodium silicate (Hele-Shaw cell gap: 0.5 mm). Three regimes can be observed: no filaments in the top row, one filament in the middle row and multiple filaments in the bottom row. It is possible to observe from these pictures that the cobalt chloride solution starts to leak from the membrane after some time, with the resulting precipitate spreading as shell-like structures. This leaking causes a decrease in ut, and may eventually halt the growth of the filaments. | |
The filaments mentioned here correspond to the F1 structures described by Haudin et al.;8 these consist of narrow, elongated tubular structures. In addition to these, F2 structures8 were also observed. These are much wider than the F1 filaments, possess very thick walls, and always maintain a straight trajectory, in contrast with the meandering F1 structures. An F1 filament may suddenly widen to become an F2 one, which after a while will suddenly narrow back to the original F1 width. The period of time during which the F2 pattern is sustained is also variable. It may be quite short, ultimately resembling a quasi-circular “lake” in the path of the filament, or it may sustain its form for several seconds, and thus consist of a very elongated straight segment. Different examples of F2 structures found in this work are presented in Fig. 4.
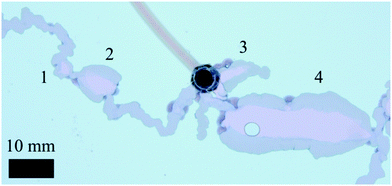 |
| | Fig. 4 F2 type filaments observed experimentally (SS6.25 CC0.63 Q6 H0.5). In this particular case four different examples are found, identified by the numbers from 1 to 4. These structures vary in length, ranging from very short and barely wider than a regular F1 filament (1) to reaching several centimetres in length and exhibiting much thicker walls (4). It is apparent that during the growth of the chemical garden the precipitate may suddenly switch from an F1 filament to a F2, and vice versa. These examples also suggest that the F2 structures “burst” out of the filaments, given the abrupt change in width in the cases 2 and 4, while thinning out more smoothly back to the regular F1 width. (The circle inside structure 4 is just an air bubble.). | |
The resemblance between these F2 filaments and the “worms” regime8 may suggest some connection between these two structures, however their cause is still unknown. These F2 patterns were observed in experiments with the cobalt chloride and manganese chloride metal salts, but not in experiments with copper sulfate. In addition, for cobalt chloride, these structures were only found when the sodium silicate concentration was 6.3 M, and were never observed for the lower sodium silicate concentration of 3.1 M. This is an interesting fact given that sodium silicate is in stoichiometric excess for all experimental conditions. The appearance of these patterns is also dependent on the injection flow rate into the Hele-Shaw cell. For very low flow rates, F2 patterns are practically non-existent; as the flow rate is increased these will appear more frequently during the growth of the filaments and will be sustained for longer. For high flow rates (already in the multiple filament regime) F2 may become the most common type of filament, with short F1 stretches linking long segments of F2 structures.
Table 1 shows which regimes are primarily observed for each chemical system and flow rate. Some overlap between regimes occurs at the boundary between them, so the symbols shown in Table 1 refer to the pattern most likely to be observed under those conditions. The single filament regime was studied more closely in this work, since the flow rate inside the filament is known to be identical to that set in the syringe pump. In this regime, an increase in flow rate causes the filament to have a lower tortuosity, defined as the ratio between the arc length and the euclidean distance of a filament, as shown in Fig. 5a). This means that the filament tends to adopt a straighter trajectory at higher flow rates. Another way to express this is to calculate the average angle between the filament trajectory and the radial direction, defined as θ = arc![[thin space (1/6-em)]](https://www.rsc.org/images/entities/char_2009.gif) cos(u/ut) where u is the velocity of the filament relative to its origin and ut is the speed of the tip of the filament. This value also tends to decrease with an increase in Q as shown in Fig. 5b). The average width of the filaments, 2Rf, and ut tend to increase with an increase in the injection flow rate, as shown in Fig. 5(c) and (d), respectively. All of these values are averages over the entire length of a filament.
cos(u/ut) where u is the velocity of the filament relative to its origin and ut is the speed of the tip of the filament. This value also tends to decrease with an increase in Q as shown in Fig. 5b). The average width of the filaments, 2Rf, and ut tend to increase with an increase in the injection flow rate, as shown in Fig. 5(c) and (d), respectively. All of these values are averages over the entire length of a filament.
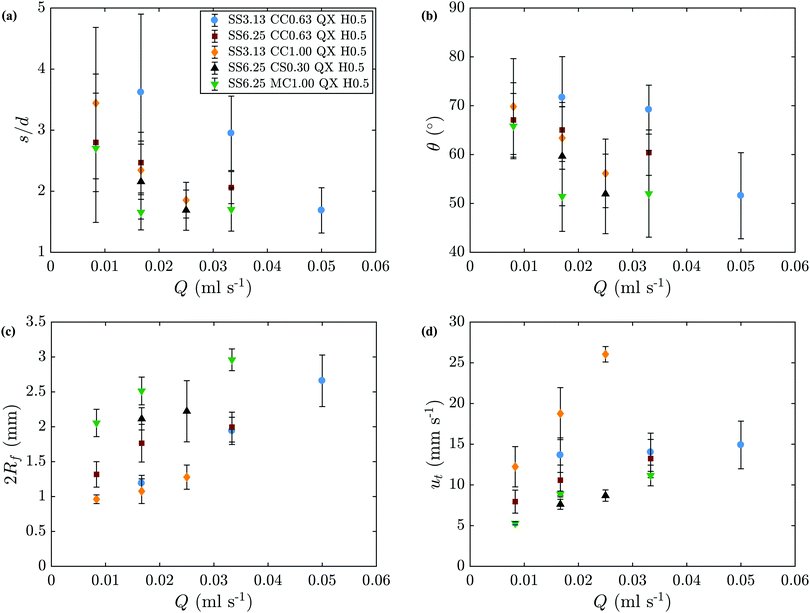 |
| | Fig. 5 Results obtained from the analysis of the filament images. (a) Average tortuosity of the filaments. (b) Average angle between the filament-motion and radial directions. (c) Average width of the filaments. (d) Average speed of the tip of the filaments. | |
In addition to these quantitative observations, filaments were found to adopt a very smooth trajectory when an air bubble is attached to its tip, as illustrated in Fig. 6. The occurrence of these bubble guided filaments was accidental. The striking difference between the behaviour of filaments with and without air bubbles supports the hypothesis that the erratic zig-zag growth of these structures is caused by the precipitation reaction occurring at their tip.
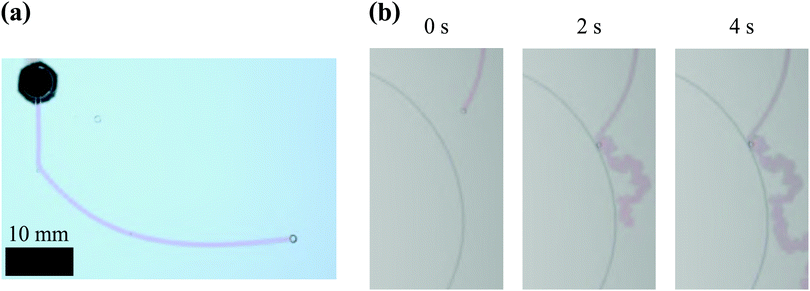 |
| | Fig. 6 Examples of bubble-guided filaments in a Hele-Shaw cell. (a) This bubble guided filament initially has a rectilinear motion, until it collides with an air bubble causing it to deflect its trajectory. It maintains a smooth path unlike bubble-free precipitate filaments. Experimental conditions: SS6.25 CC0.63 Q1 H0.5. (b) Time sequence of photos showing a filament adopting the usual erratic motion once it loses the air bubble at its tip. This shows that the transition from smooth trajectories to erratic ones is independent of the flow rate inside the filament. Experimental conditions: SS6.25 CC0.63 Q1 H1.0. | |
4 Mathematical modelling
4.1 Erratic motion of a single filament tip
We focus on the dynamics at the tip of a single, growing filament. The concentration of product at the interface between the two fluids, c, can be described by a balance between its formation by the reaction and its dilution owing to the spreading of the outflow. The internal pressure at the tip of the filament p is governed by change in the volume of fluid inside the filament and the deformation of the membrane. Thus, the system evolves with time according to| |  | (1a) |
| |  | (1b) |
Here, we have assumed that cobalt ions with concentration cCo diffuse with coefficient Dm over a length scale Lr to the reaction site on the outer surface of the membrane, whose curvature is κ (see Fig. 7). The product of the reaction will be a precipitate with concentration c, which constitutes the membrane. The concentration of ions is one of the experimental parameters, determined by the concentration of cobalt chloride solution injected into the cell. Since the width of the filaments is greater than the Hele-Shaw cell gap, the curvature will be greater in the vertical direction. As a result, the curvature was taken as κ = 1/(H/2), where H is the thickness of the Hele-Shaw cell. The Heaviside step function  describes that the product of reaction is only formed when there is outflow of cobalt ions. The volumetric flow rate of the fluid injected into the filament and speed of the tip of the filament are Qi and ut, respectively. We use the coefficient γ = (∂p/∂V)T = 60ELm3/(H(2Rf)5)/(1 − ν2) to describe the deformation of the thin cylindrical section of precipitate membrane; here Rf is the radius of filament and Lm is the membrane thickness, while E and ν denote Young's modulus and the Poisson ratio for the membrane material.22 This assumes elastic deformation only at the tip of the filament, and no effect of the Hele-Shaw cell plates. A derivation of the expression can be found in the Appendix. The surface area for the outward flow Aout is assumed constant. The coefficient α quantifies the pressure drop associated with the viscous flow along the filament, which by analogy with flow in a rectangular duct takes the form:
| |  | (2) |
Here μ is the dynamic viscosity of the fluids without product. Eqn (2) is taken from a published study on the friction factor in non circular ducts for laminar flows, obtained through modelling and scaling analysis.23
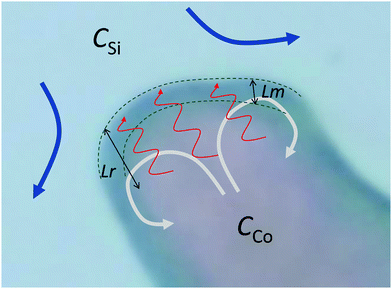 |
| | Fig. 7 Schematic of the flow of silicate solution (blue arrows) relative to the tip of a filament. The cobalt ions diffuse (red arrows) across the concentration boundary layer of thickness Lr: as cobalt ions are consumed by the chemical reaction, a concentration gradient is formed across that length scale. The precipitate membrane at the tip of the filament (between the green dashed lines) has thickness Lm. Reaction occurs at the outer surface of the membrane, adding cobalt–silicate precipitate. These precipitate particles constitute the membrane at the tip of the filament. The parameter c is their concentration across the perimeter of this membrane. The chemical reaction contributes to an increase in c, while the outflow of the cobalt chloride solution leads to the spreading of the product of reaction over a wider perimeter, thus contributing to a decrease in c. This mechanism causes the value of c to continually oscillate. As the flow inside the filament is laminar, the speed is maximum at the centre. For the filament to preserve the shape at the tip, there has to be some recirculation of the fluid there – from the higher speed position at the centre to the lower speeds at the sides of the filament – represented by the grey arrows in the schematic. This effect is not taken into account in the model since only an average speed ut is used, and the resistance to the flow at the tip is represented by the membrane properties (eqn (3)). Note: the arrows and dimensions of Lm and Lr in this figure are not shown to scale. | |
Since the cobalt chloride solution flows across the precipitate membrane, a porous medium, the speed of the tip of the filament is thus given by Darcy's law:
| |  | (3) |
where
kout is the permeability
22,24,25 of the membrane and
Lm is its thickness. The dependence of the outflow speed on concentration of product at the interface of the inner and outer fluids was first proposed by Wagatsuma
et al.21 for the growth of a precipitate filament: as the concentration of product increases, the speed decreases, and ceases above the critical product concentration
c*. We introduce the Heaviside step function

to ensure that
c ≤
c* and
ut ≥ 0. Substituting the speed relations (3) into the governing
eqn (1) and non-dimensionalizing using the scales for time
ts =
μLm/(
γAoutkout), pressure
ps =
γAout/
κ and concentration
cs =
c*, leads to the following simplified coupled equations
| |  | (4a) |
| |  | (4b) |
The evolution of the system depends therefore on three non-dimensional groups only:
| M = DmμLmcCo/(koutAoutγLr2c*) |
is a non-dimensional rate of accumulation of precipitate;
is a non-dimensional volumetric injection rate of metal ion;
measures the pressure drop along the filament.
Linear stability analysis of the governing eqn (4) around the steady-state product concentration ĉss = (1 + W)M/N and tip pressure ![[p with combining circumflex]](https://www.rsc.org/images/entities/i_char_0070_0302.gif) ss = N2/(1 + W)/(N − M − MW) allows the identification of several dynamical behaviours for different concentrations of metal ion and injection rates. Fig. 8 illustrates the stable, oscillatory and unstable regimes. At low injection flow rate of the cobalt solution (low N) the filament is unstable: the concentration of precipitate can grow to block the filament growth and internal fluid pressure is sufficient to lead to a slow leak over a larger area of the membrane; this is the radial spreading regime observed in Fig. 3 (top row). At higher injection rate of cobalt the filament exhibits an oscillatory growth pattern. The concentration of precipitate and pressure are lower than in the previous case, so that the membrane at the tip of the filament ruptures and grows in spurts. At still larger injection rates of cobalt (high N), the concentration of the product of reaction is low and the pressure is intermediate, thus allowing the membrane to rupture and form several oscillatory filaments. From the linear stability analysis, in the oscillatory regime, we expect the frequency of oscillation to follow
ss = N2/(1 + W)/(N − M − MW) allows the identification of several dynamical behaviours for different concentrations of metal ion and injection rates. Fig. 8 illustrates the stable, oscillatory and unstable regimes. At low injection flow rate of the cobalt solution (low N) the filament is unstable: the concentration of precipitate can grow to block the filament growth and internal fluid pressure is sufficient to lead to a slow leak over a larger area of the membrane; this is the radial spreading regime observed in Fig. 3 (top row). At higher injection rate of cobalt the filament exhibits an oscillatory growth pattern. The concentration of precipitate and pressure are lower than in the previous case, so that the membrane at the tip of the filament ruptures and grows in spurts. At still larger injection rates of cobalt (high N), the concentration of the product of reaction is low and the pressure is intermediate, thus allowing the membrane to rupture and form several oscillatory filaments. From the linear stability analysis, in the oscillatory regime, we expect the frequency of oscillation to follow
| |  | (5) |
where
| | 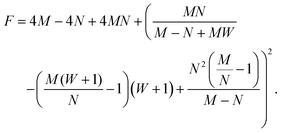 | (6) |
The term (−
F/4)
1/2 is the imaginary part of the eigenvalues of the Jacobian matrix of the system of
eqn (4a) and (b). The equations were determined with the Wolfram Mathematica software. The effect of the pressure drop along the filament
W on the regime map is shown in
Fig. 8b. An increase in the viscosity of the fluid increases the pressure on the membrane, thus favouring the slow leak over a large area,
i.e., the radial spreading pattern.
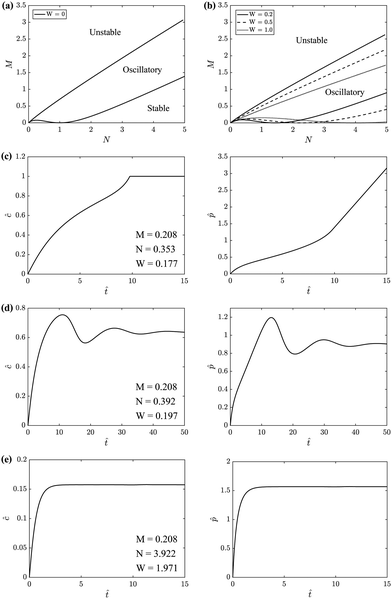 |
| | Fig. 8 Top row: Regime diagrams showing the stability of regions in M–N space. M is proportional to the concentration of metal salt, while N and W are proportional to the flow rate of injection into the Hele-Shaw cell/flow rate inside the filament. Since there are three parameters, these regions are presented in M–N space for different values of W. The regimes with no filaments and single filament correspond to the unstable and oscillatory regions, respectively. In all systems studied in the laboratory the multiple filament regime sets in before the system reaches the predicted conditions for the straight movement of a single filament - the stable regime. So this regime was not seen in the laboratory. (a) W = 0. (b) W ≠ 0. (c), (d) and (e) represent the prediction for the temporal evolution of ĉ and ![[p with combining circumflex]](https://www.rsc.org/images/entities/i_char_0070_0302.gif) for the unstable, oscillatory stable and stable regimes, respectively. These were obtained by solving the model eqn (4a) and (b) numerically. for the unstable, oscillatory stable and stable regimes, respectively. These were obtained by solving the model eqn (4a) and (b) numerically. | |
The frequency of oscillation f of a particular filament can be calculated from:
| |  | (7) |
By measuring the speed of the filament tip and the distance between turns with the method presented in Section 2, the frequency of oscillation can be obtained experimentally and compared with the theoretical predictions.
The parameters M, N, W, ps, and ts all depend on Lm, kout and Lr2·c*, which are the fitting parameters of the model, unknown at the beginning of the study. All the other parameters are either measured with experiments (such as Rf and ut) or taken from the literature (such as the Young's modulus for the membrane). In Section 5, we compare the model predictions with measurements for frequency f, distance between turns δ and pressure p.
4.2 Statistical mechanics of an ensemble of filaments
We may examine the behaviour of these filaments by analysing their statistical mechanics. In Section 2, we have noted that the tip of each filament has a random motion, which changes direction abruptly after short, relatively rectilinear flow paths. Fig. 2 and 5(a) show that a preferred length exists for such paths between abrupt turns. The random turns lead to a fluctuation in the distance between a given filament tip and the position of an ensemble of tips. An averaging of these fluctuations shows that the distance between a filament tip and the ensemble of tips grows with time as Δx = (2utδt)1/2, where ut is the speed of the tips of the filaments. In the present experiments the speed ut is related to the flow rate of injection, and therefore an externally controlled variable; in other cases such as the classical chemical garden with a solid seed the filament tip speed may be driven by an internal driving force: osmosis. Thus, the abrupt changes in the trajectories of the filaments lead to a dispersion in the motion of an ensemble of filaments that scales as De ∼ cDutδ, where cD is a constant. This process is analogous to diffusion in a gas mixture arising from molecular collisions,26 or dispersion of a solute in a porous medium resulting from the tortuous flow paths in its pores.27
On the macro-scale, the motion of an ensemble of filaments may therefore be described in terms of two components, the magnitude of the average velocity of an ensemble of filaments u and a random or dispersive component associated with the turns De. We expect then the motion of n filaments to follow the continuum transport equation
| |  | (8) |
where
t denotes time and
x is the coordinate in the direction of the spatially-averaged flow. If
n0 filaments are released at (
x,
t) = (0,0), appropriate initial and boundary conditions are
n(0 <
x < ∞,0) = 0,
n(
x = 0,
t) =
n0 and
n(
x → +∞,
t) = 0. The solution of this partial differential equation gives the spatio-temporal distribution of filaments, which for long times takes the form
| |  | (9) |
Defining
a =
u/
ut and noting that
s =
utt, we have
| |  | (10) |
The filament tips therefore form a spatial band in which the number of tips decreases from
n0 to 0.
Eqn (10) can be solved for
x to obtain the Euclidean distance from the source of a particular band of filament tips. For instance, the front of tips with
n/
n0 = 0.4 evolves as
| | | d(s) ∼ as + 0.18(4cDδs)0.5. | (11) |
This relationship for
d(
s) comprises a linear term,
s, associated with the ballistic or advective motion and a sub-linear dispersive term,
s0.5, reflecting the random turns, and analogous to Brownian transport. We compare the theoretical predictions of
eqn (9) and (11) with the measurements for the chemical-garden filaments below.
5 Results
5.1 Oscillatory dynamics of a precipitate filament
The linear model predicts pressure and concentration oscillations at the tip of the filament, and we expect these to be associated with its regular change of direction. The frequency of oscillation was thus estimated with eqn (7). Fig. 9(a) shows a comparison of the theoretical prediction of eqn (5) with our experimental measurements for cobalt chloride. Fig. 9(b) shows the results in terms of δ. The model is in good agreement with the measured results for different silicate concentrations. As expected, the oscillatory regime develops in a window of intermediate flow rates, outside which the frequency of oscillation quickly vanishes. Here, we have assumed a Young modulus of 105 Pa and a Poisson ratio 0.5 for the precipitate membrane,28 as well as the property values summarized in Table 2. The curvature κ is 4000 m−1 and 2000 m−1 for Hele-Shaw cell gaps of 0.5 mm and 1.0 mm respectively. Since the membrane at the tip of the filament is continually being formed and diluted as the filament moves forward, its thickness is as a result much thinner than chemical garden membranes grown over several hours.19,20 Below, we use these properties to determine the nonlinear time-dependent behaviour of the system through numerical integration of eqn (4).
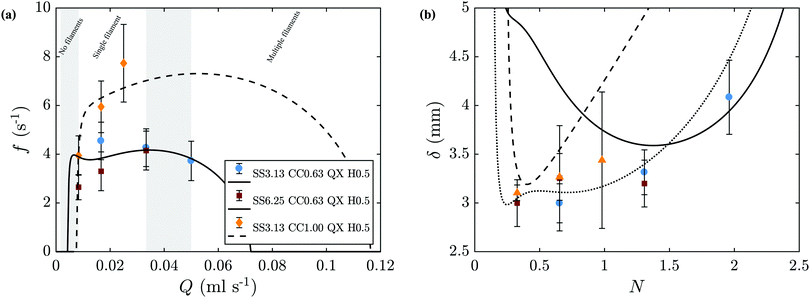 |
| | Fig. 9 Comparison of the model predictions (lines) with the experimental results (symbols). (a) Frequency of oscillation for cobalt chloride one-filament regime. Shaded areas represent the transition between different regimes; for flow rates within these ranges, two different regimes may be observed. This corresponds to the fitting of eqn (5) and (6) to the experimental measurements of f. (b) Distance between turns δ. The model prediction is obtained from δ = f/ut. | |
Table 2 Properties of the different precipitate membranes
|
|
|
Co |
Cu |
Mn |
|
L
m
|
m |
4.8 × 10⁻⁶ |
4.0 × 10⁻⁶ |
4.4 × 10⁻⁶ |
|
k
out
|
m2 |
1.6 × 10⁻¹⁰ |
8.3 × 10⁻¹¹ |
2.0 × 10⁻¹⁰ |
|
L
r
2·c* |
mol m−1 |
3.4 × 10⁻⁸ |
6.3 × 10⁻⁸ |
8.8 × 10⁻⁸ |
The values of the frequency of oscillation can be presented in non-dimensional form for all experimental results, by multiplying f by ts and presenting it as a function of N, as shown in Fig. 10. All the results are in good agreement with the theoretical predictions. It is important to note that these theoretical predictions consider an average value of Rf for each M, even though Rf is known to increase with flow rate, as shown in Fig. 5(c). This simplification has a negligible effect for the smallest Hele-Shaw cell gap of 0.5 mm, however for H = 1.0 mm this becomes more important as it leads to a larger Aout. The higher sensitivity of the model to higher H explains the differences between theory and experiments run under these conditions, shown in Fig. 10 with the data for M = 0.56 and M = 0.73.
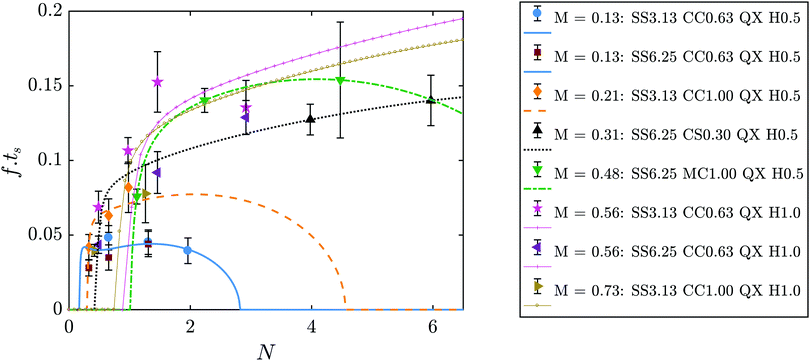 |
| | Fig. 10 Non-dimensional frequency of oscillation as a function of N for all experiments. Symbols represent the experimental results, lines are the theoretical prediction. The theoretical lines here correspond to the value of f as calculated from eqn (5) multiplied by ts. | |
The pressure delivered by the syringe pump, pmeasured, was measured and an example is shown in Fig. 11(a) for an experiment with sodium silicate 6.25 M, manganese chloride 1.00 M and an injection flow rate of 0.033 mL s−1. The pressure at the tip of the filament, p, can also be determined with the model, by solving the differential equations numerically. Fig. 11(b) shows the theoretical prediction of p for a filament under the same conditions, with M = 0.48, N = 4.47 and W = 2.75. The pressure measured during an experiment is expected to depend on the pressure at the tip of the filament and the pressure drop along the filament, pdrop. It is also assumed that there is a large pressure drop at the entrance to the cell, pentry, that needs to be taken into account:21
| | | pmeasured = p + pdrop + pentry. | (12) |
According to the literature, for a flow rate of 0.033 mL s
−1,
pentry is equal to 0.64 kPa.
21pmeasured is obtained experimentally, and corresponds to approximately 1 kPa in this case as shown in
Fig. 11.
p is the pressure at the tip of the filament, and can be determined analytically or numerically. From stability analysis, as shown in Section 4.1, the system should have the following non-dimensional fixed point:
| |  | (13) |
Since
ps = 0.168 Pa, this point corresponds to a pressure of 0.33 Pa.
pdrop is the pressure drop along the filament:
For this case,
α = 4.37 × 10
10 kg m
−5 s
−1.
pmeasured can thus be calculated with
eqn (12), with the comparison with the experimental measurement shown in
Fig. 11.
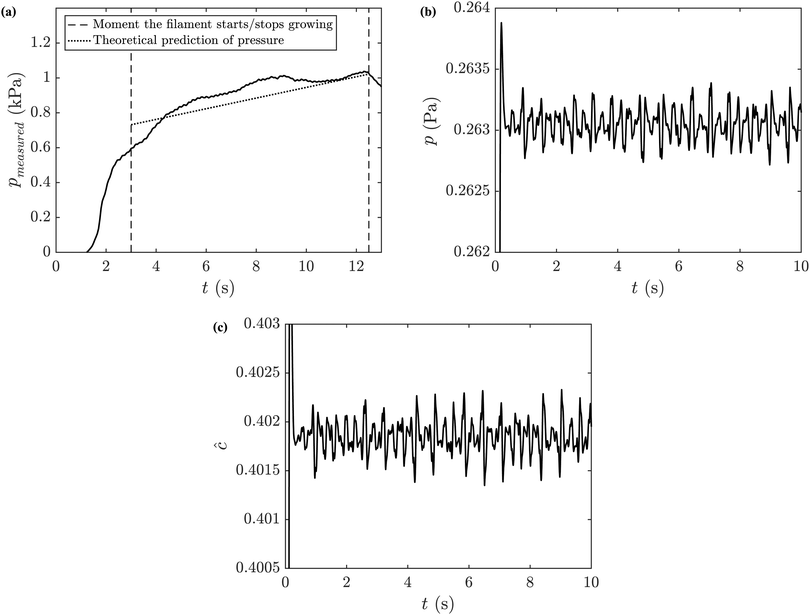 |
| | Fig. 11 Analysis of the pressure in a precipitate filament. (a) Comparison between pmeasured (solid line) and the theoretical prediction for the pressure (eqn (12), dotted line). Numerical predictions for the (b) pressure at the tip of the filament and (c) concentration of product. Experimental conditions: SS6.25 MC1.00 Q2 H0.5. | |
5.2 Dispersive spreading of an ensemble of filament tips
The model describing the dispersive dynamics of an ensemble of filament tips described in Section 4.2 is found to be in good agreement with the experimental measurements. As shown in Fig. 12, eqn (11) predicts the experimental results effectively for all metal salts, Hele-Shaw cell gaps and injection flow rates tested.
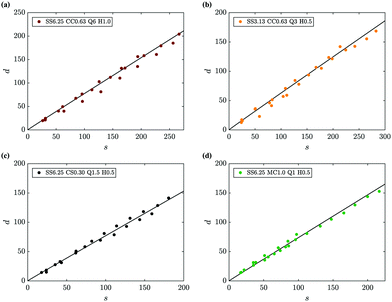 |
| | Fig. 12 Comparison of the theoretical prediction for the evolution of the front of tips with n/n0 = 0.4 as a function of its arc length (eqn (11), lines) with experimental measurements (symbols), representative of the different experimental conditions analysed in this work. | |
The Euclidean distance and arc length of a particular filament can be rescaled with its respective preferred distance between turns δ and constant cD, such as ![[d with combining circumflex]](https://www.rsc.org/images/entities/i_char_0064_0302.gif) = d/cDδ and
= d/cDδ and ![[d with combining circumflex]](https://www.rsc.org/images/entities/i_char_0064_0302.gif) = s/cDδ.10 This leads to the following non-dimensional form of eqn (11):
= s/cDδ.10 This leads to the following non-dimensional form of eqn (11):
| | ![[d with combining circumflex]](https://www.rsc.org/images/entities/i_char_0064_0302.gif) (s) ∼ aŝ + 2bŝ0.5, (s) ∼ aŝ + 2bŝ0.5, | (15) |
where
b is a constant dependent on the value of
n/
n0. Thus, a further way of comparing theory with experiments is to plot
![[d with combining circumflex]](https://www.rsc.org/images/entities/i_char_0064_0302.gif)
as a function of
aŝ + 2
bŝ0.5, as presented in
Fig. 13. Experimental measurements fall on the line
x =
y, in agreement with the model.
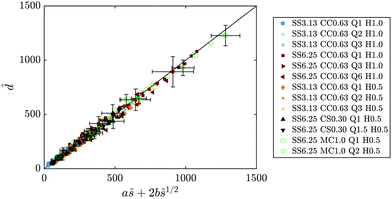 |
| | Fig. 13 Non-dimensional comparison between theoretical prediction and experimental results for the Euclidean distance (eqn (15)). Symbols represent measurements, line corresponds to x = y. | |
The value of De can be determined by fitting eqn (9) to the experimental results. Since ut and δ can be measured directly from the experiments, calculating cD becomes straightforward. Fig. 14(b) shows De as a function of the experimentally measured values of utδ. The slope of the line that best fits the points is thus the value of the coefficient cD. Different values of cD are observed, which suggest a dependence on the metal salt used given the difference between the results for cobalt chloride and manganese chloride. Also, the observed spread in the value of cD, from 0.04 to 0.15, may be caused partly by the errors in the measurement of ut and δ. The analysis of n/n0 can be presented non-dimensionally as a function of the coefficient (x − ut)/(4cDutδt)1/2, as shown in Fig. 14(c). A theoretical curve is also presented in the figure, and is in good agreement with the experimental values considering the error bars shown. This strengthens the argument of the validity of the model, and supports the existence of a universal cD, which is found to be 0.080 ± 0.010. The values of De are also plotted as a function of injection flow rate in Fig. 14(a). This magnitude increases with flow rate and is of the order of 10−6 m2 s−1.
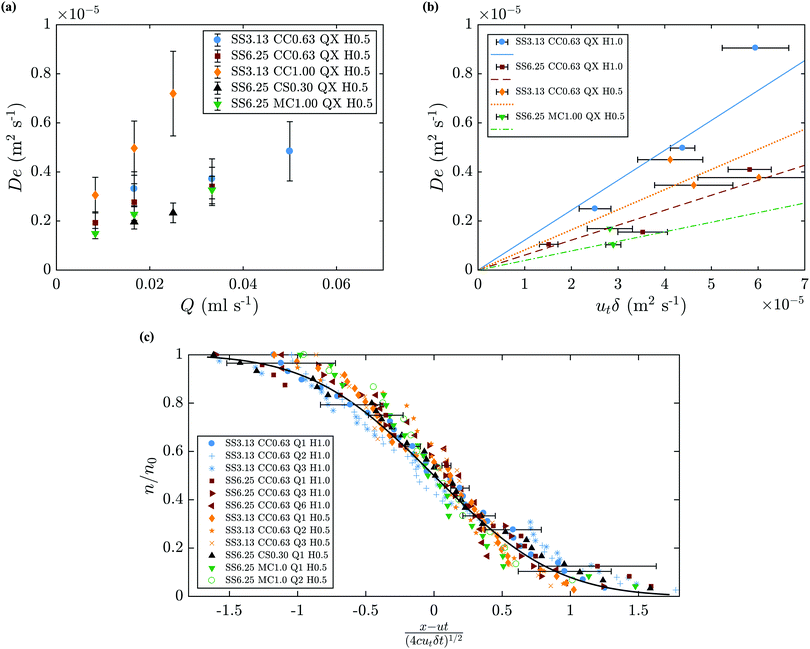 |
| | Fig. 14 (a) Dispersion coefficient as a function of injection flow rate. (b) Predicted (lines) and measured values of De from eqn (9) as a function of utδ. The coefficient cD corresponds to the slope of the line that best fits the results to the equation De = cDutδ. Solid line: cD = 0.122, dashed line: cD = 0.061, dotted line: cD = 0.082, dash dot line: cD = 0.039. (c) Predicted and measured filament movement n/n0 (eqn (9)). | |
6 Discussion
One important detail to have in mind when analysing the experimental results under any of the models is that the flow rate in the filaments for each data point must always be the same. However, one limitation of the single filament experiments is that soon after the start the filament starts leaking, which means that the flow rate at the tip will be variable as the filament grows. As a result, we observe more tortuous trajectories (and thus shorter segments) in the final part of the filament than at the beginning. This can give the wrong impression that the distribution of filament lengths is wider than it really is, and makes it harder to analyse the statistical significance of the results.
6.1 Diffusive motion of a chemical garden filament
If we start from our model of fixed-length straight segments plus random turns, we have exactly a basic random walk. This random walk, in turn, is exactly the model that produces normal diffusion, 〈r2(t) 〉 ∼ Kt, where r is the displacement, K is the diffusivity and t is the time elapsed. This is because in normal diffusion one has in effect a mean free path. The difference between the model and molecular diffusion is then simply the difference in scales between the molecular mean free path length and the segment length.
The cases of superdiffusion, 〈r2(t)〉 ∼ tα, and subdiffusion,  , arise when there is a distribution of mean free path/segment lengths with a long tail. That means a significant probability of very long segments. These are called Lévy flights.29
It would be interesting if one could have a chemical-garden type process that produced tube segments with a long tail of lengths, because then one could have superdiffusion. It would be interesting to see such long straight segments, since these would correspond to the ‘stable’ regime of the model. But we have not observed in any of the experiments any filaments with long straight segments. This regime, if it exists, would require a very high flow rate inside the filaments (much higher than the usual ∼0.02 mL s−1 inside each individual filament), and when a high flow rate is set in the pump multiple filaments are observed instead of a single straight one. Not observing these segments is thus in agreement with the model, which predicts that for these conditions the concentration of precipitate and pressure at the tip of the filament are constantly oscillating, and thus the filament is constantly turning as well.
If we have a normal distribution of segment lengths then we have a normal diffusive (i.e., dispersive) process. (We should note that we hit the terminological difference between fields, between in this case fluid mechanics and statistical mechanics, because in fluid mechanics what is not molecular diffusion is dispersion, while everything is diffusion in statistical mechanics.) The distribution of filament lengths is already presented in Fig. 4 of the 2018 paper on filament dynamics.10 The power spectrum of the preferred wavenumber (from which the segment length is directly calculated) does not imply any case of a long tail. Also, in this paper the data is compiled from experiments with different metal salts and multiple filaments in a single experiment, which can lead to a wider distribution of filament lengths. Based on the data from the image analysis method (which of course also has its limitations) we have a normal random walk and a normal diffusion process is the most logical conclusion.
6.2 Implications for 3D chemical gardens
The study and understanding of confined precipitate filaments as shown in this work may provide insights into currently unexplained phenomena observed in the growth of three dimensional chemical gardens. When the traditional method of seed growth is employed, three dimensional precipitate structures are found to sprout vertically out of a solid seed, driven by a combination of osmosis and buoyancy.1 These often exhibit numerous tubes, similar to the filaments observed in confined conditions. While the forces driving the process are different in the two set-ups, in both cases a metal salt solution is flowing inside the filament, and a precipitate reaction is continually occurring at its tip. Indeed, three dimensional tubes have been observed to grow with numerous turns with preferred angles, as shown in Fig. 15. Meanwhile, 3D bubble guided filaments are completely straight.30 The limitations of such seed grown experiments, such as not knowing the actual flow rate inside each tube or their salt concentration prevent a rigorous application of the model in this work. Nevertheless, assuming the 3D filaments have a circular cross-section, the theory is essentially the same. The pressure drop can be calculated with Poiseuille's law and the variable γ will correspond to the deformation of a thin circular plate with supported edges under uniform pressure:31| |  | (16) |
where p is the pressure, R is the radius of the plate, r is the radial distance from the centre of the plate, Dfr is the flexural rigidity and ν is Poisson's ratio. The flexural rigidity is calculated with the following equation:22| |  | (17) |
where E is the Young's modulus and Lm is the thickness of the membrane.
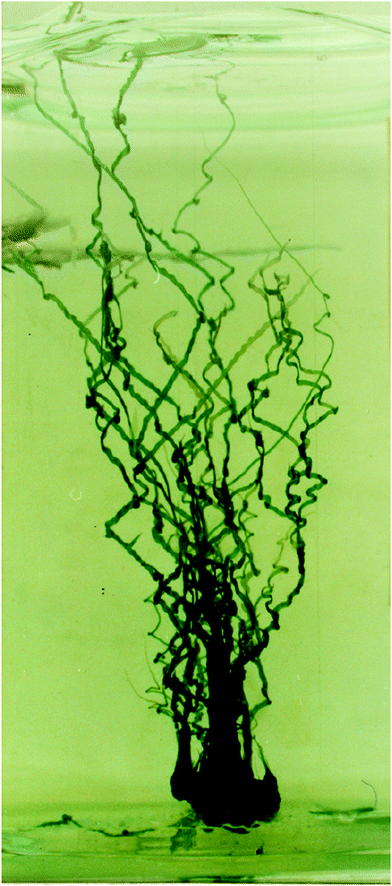 |
| | Fig. 15 Three dimensional chemical garden grown from a 1 g seed of cobalt sulfate in a tank with sodium silicate. The structure has numerous tubes, each with several turns with preferred angles. In addition, the straight segments of the tubes appear to have an oscillating width, or a “wavy” membrane on their sides. These characteristics make them very similar to the confined filaments studied in this paper. In both the 2D and 3D case, the tubes have a metal salt solution flowing inside them, as well as a precipitate reaction at the tip. The main differences from the 2D case are the variable metal salt concentration (caused by osmosis gradually diluting the salt) as well as buoyancy regulating the speed of growth of the structure instead of a pump. Image from David Jones.1 | |
The pressure oscillations shown to exist in these chemical gardens,28 for instance, imply that they grow in “bursts” rather than continually when the Hele-Shaw cell is fed by a pump. However, the similarities that do exist between the two systems suggest the same mechanism may be occurring in both of them, that is the diffusive supply of metal salt ions to the membrane at the tip of the filament and the spreading of product of reaction along its edge, causing turns in the trajectory of the filament with particular angles.
7 Conclusions
In this work we analyse the dynamics of confined chemical gardens experimentally and theoretically. For increasing injection flow rate of the metal salt solution into the host solution of sodium silicate in a Hele-Shaw cell, the patterns observed range from quasi-circular “shells” to single filaments, to multiple active filaments growing simultaneously. The erratic motion of a single filament tip was modelled considering the diffusive supply of ions to the tip, and the spreading of the precipitate as the filament advances. These two effects lead to an oscillation in the pressure and concentration of product of reaction at the tip of the moving filament, causing zig-zag trajectories. The model was successfully fitted to the experimental data, allowing the estimation of the thickness of the precipitate membrane and its permeability. When multiple filaments are growing at once, their meandering motion leads to a fluctuation in the distance between a given filament tip and the position of an ensemble of tips. The effective diffusivity for the transverse spreading of a chemical garden is estimated to be up to De ∼ cDutδ ∼ 10−5 m2 s−1. This efficient transport is four orders of magnitude larger than molecular diffusion in a liquid, thus ensuring a transverse spreading rate 100 times higher than might have been expected. Such widespread contact between the chemical-garden structure and its surrounding environment enhances physical and chemical exchanges.
Conflicts of interest
There are no conflicts to declare.
Appendix
Derivation of γ
The deformation at the tip of the filament is taken as analogous to the upward buckling of a thin plate, embedded on both ends, due to a uniform horizontal load. Considering a thin plate 2Rf wide and taking x = 0 as the centre of the plate, the deflection ω is expressed as:22| |  | (18) |
where p is the pressure deforming the plate and Dfr is the flexural rigidity, given by eqn (17). With the appropriate boundary conditions, ω = dω/dx = 0 at x = ±Rf, the solution of eqn (18) that satisfies these boundary conditions is| |  | (19) |
The cross sectional area of the deformation is obtained by integrating eqn (19) across the length of the plate:| |  | (20) |
In the particular case of the filament in a Hele-Shaw cell, the volume of deformation Vdef is obtained by multiplying Across by the cell's gap width; this volume will thus vary as the pressure changes: ΔVdef = ΔPH(2Rf)5/720Dfr. Rearranging this equation and substituting Dfr by eqn (17), γ can then be calculated from the following expression:| |  | (21) |
Acknowledgements
L. A. M. R. gratefully acknowledges funding from the Fundação para a Ciência e Tecnologia (FCT), Portugal (grant SFRH/BD/130401/2017). The authors acknowledge the contribution of the COST Action Chemobrionics, CA17120.
References
- L. M. Barge, S. S. S. Cardoso, J. H. E. Cartwright, G. J. T. Cooper, L. Cronin, A. De Wit, I. J. Doloboff, B. Escribano, R. E. Goldstein, F. Haudin, D. E. H. Jones, A. L. Mackay, J. Maselko, J. J. Pagano, J. Pantaleone, M. J. Russell, C. I. Sainz-Díaz, O. Steinbock, D. A. Stone, Y. Tanimoto and N. L. Thomas, Chem. Rev., 2015, 115, 8652–8703 CrossRef CAS.
- E. Nakouzi and O. Steinbock, Sci. Adv., 2016, 2, e1601144 CrossRef.
- J. H. E. Cartwright, B. Escribano, C. I. Sainz-Díaz and L. S. Stodieck, Langmuir, 2011, 27, 3294–3300 CrossRef CAS.
- S. Thouvenel-Romans and O. Steinbock, J. Am. Chem. Soc., 2003, 125, 4338–4341 CrossRef CAS.
- M. R. Bentley, B. C. Batista and O. Steinbock, J. Phys. Chem. A, 2016, 120, 4294–4301 CrossRef CAS.
- F. Haudin, J. H. E. Cartwright, F. Brau and A. De Wit, Proc. Natl. Acad. Sci. U. S. A., 2014, 111, 1–11 CrossRef.
- F. Haudin, J. H. E. Cartwright and A. De Wit, J. Phys. Chem. C, 2015, 119, 15067–15076 CrossRef CAS.
- F. Haudin, V. Brasiliense, J. H. E. Cartwright, F. Brau and A. De Wit, Phys. Chem. Chem. Phys., 2015, 17, 12804–12811 RSC.
- F. Haudin and A. De Wit, Phys. Fluids, 2015, 27, 113101 CrossRef.
- F. Brau, F. Haudin, S. Thouvenel-Romans, A. De Wit, O. Steinbock, S. S. S. Cardoso and J. H. E. Cartwright, Phys. Chem. Chem. Phys., 2018, 20, 784–793 RSC.
- Y. Ding, B. Batista, O. Steinbock, J. H. E. Cartwright and S. S. S. Cardoso, Proc. Natl. Acad. Sci. U. S. A., 2016, 104, 20167–20172 Search PubMed.
- G. Schuszter and A. De Wit, J. Chem. Phys., 2016, 145, 224201 CrossRef CAS.
- F. Glaab, J. Rieder, J. M. García-Ruiz, W. Kunz and M. Kellermeier, Phys. Chem. Chem. Phys., 2016, 18, 24850–24858 RSC.
- F. Glaab, J. Rieder, R. Klein, D. Choquesillo-Lazarte, E. Melero-Garcia, J. M. García-Ruiz, W. Kunz and M. Kellermeier, ChemPhysChem, 2017, 18, 338–345 CrossRef CAS.
- S. Hussein, J. Maselko and J. T. Pantaleone, Langmuir, 2016, 32, 706–711 CrossRef CAS.
- G. Schuszter, F. Brau and A. De Wit, Phys. Chem. Chem. Phys., 2016, 18, 25592–25600 RSC.
- E. Rauscher, G. Schuszter, B. Bohner, Á. Tóth and D. Horváth, Phys. Chem. Chem. Phys., 2018, 20, 5766–5770 RSC.
- I. Ziemecka, F. Brau and A. De Wit, Chaos, 2020, 30, 013140 CrossRef CAS.
- B. C. Batista and O. Steinbock, J. Phys. Chem. C, 2015, 119, 27045–27052 CrossRef CAS.
- Q. Wang, M. R. Bentley and O. Steinbock, J. Phys. Chem. C, 2017, 121, 14120–14127 CrossRef CAS.
- S. Wagatsuma, T. Higashi, Y. Sumino and A. Achiwa, Phys. Rev. E, 2017, 95, 052220 CrossRef.
-
D. L. Turcotte and G. Schubert, Geodynamics, Cambridge University Press, Cambridge, 2002 Search PubMed.
- Y. S. Muzychka and M. M. Yovanovich, J. Fluids Eng., 2009, 131, 111105 CrossRef.
- O. Kedem and A. Katchalsky, Biochim. Biophys. Acta, 1958, 27, 229–246 CrossRef CAS.
- S. S. S. Cardoso and J. H. E. Cartwright, R. Soc. Open Sci., 2014, 1, 140352 CrossRef.
-
S. Chapman and T. Cowling, The mathematical theory of non-uniform gases, Cambridge University Press, Cambridge, 1970 Search PubMed.
-
O. M. Phillips, Flow and Reactions in Permeable Rocks, Cambridge University Press, 1991 Search PubMed.
- J. Pantaleone, A. Toth, D. Horvath, L. Rosefigura, W. Morgan and J. Maselko, Phys. Rev. E: Stat., Nonlinear, Soft Matter Phys., 2009, 79, 056221 CrossRef CAS.
-
B. B. Mandelbrot, The fractal geometry of nature, W. H. Freeman, San Francisco, 1982 Search PubMed.
- S. Thouvenel-Romans, J. J. Pagano and O. Steinbock, Phys. Chem. Chem. Phys., 2005, 7, 2610–2615 RSC.
-
S. Timoshenko and S. Woinowsky-Krieger, Theory of plates and shells, McGraw-Hill, New-York, 1959 Search PubMed.
|
| This journal is © the Owner Societies 2021 |
Click here to see how this site uses Cookies. View our privacy policy here.  Open Access Article
 *a,
Julyan H. E.
Cartwright
 bc and
Silvana S. S.
Cardoso
 a
a

![[thin space (1/6-em)]](https://www.rsc.org/images/entities/char_2009.gif) cos(u/ut) where u is the velocity of the filament relative to its origin and ut is the speed of the tip of the filament. This value also tends to decrease with an increase in Q as shown in Fig. 5b). The average width of the filaments, 2Rf, and ut tend to increase with an increase in the injection flow rate, as shown in Fig. 5(c) and (d), respectively. All of these values are averages over the entire length of a filament.
cos(u/ut) where u is the velocity of the filament relative to its origin and ut is the speed of the tip of the filament. This value also tends to decrease with an increase in Q as shown in Fig. 5b). The average width of the filaments, 2Rf, and ut tend to increase with an increase in the injection flow rate, as shown in Fig. 5(c) and (d), respectively. All of these values are averages over the entire length of a filament.

 describes that the product of reaction is only formed when there is outflow of cobalt ions. The volumetric flow rate of the fluid injected into the filament and speed of the tip of the filament are Qi and ut, respectively. We use the coefficient γ = (∂p/∂V)T = 60ELm3/(H(2Rf)5)/(1 − ν2) to describe the deformation of the thin cylindrical section of precipitate membrane; here Rf is the radius of filament and Lm is the membrane thickness, while E and ν denote Young's modulus and the Poisson ratio for the membrane material.22 This assumes elastic deformation only at the tip of the filament, and no effect of the Hele-Shaw cell plates. A derivation of the expression can be found in the Appendix. The surface area for the outward flow Aout is assumed constant. The coefficient α quantifies the pressure drop associated with the viscous flow along the filament, which by analogy with flow in a rectangular duct takes the form:


 to ensure that c ≤ c* and ut ≥ 0. Substituting the speed relations (3) into the governing eqn (1) and non-dimensionalizing using the scales for time ts = μLm/(γAoutkout), pressure ps = γAout/κ and concentration cs = c*, leads to the following simplified coupled equations

![[p with combining circumflex]](https://www.rsc.org/images/entities/i_char_0070_0302.gif) ss = N2/(1 + W)/(N − M − MW) allows the identification of several dynamical behaviours for different concentrations of metal ion and injection rates. Fig. 8 illustrates the stable, oscillatory and unstable regimes. At low injection flow rate of the cobalt solution (low N) the filament is unstable: the concentration of precipitate can grow to block the filament growth and internal fluid pressure is sufficient to lead to a slow leak over a larger area of the membrane; this is the radial spreading regime observed in Fig. 3 (top row). At higher injection rate of cobalt the filament exhibits an oscillatory growth pattern. The concentration of precipitate and pressure are lower than in the previous case, so that the membrane at the tip of the filament ruptures and grows in spurts. At still larger injection rates of cobalt (high N), the concentration of the product of reaction is low and the pressure is intermediate, thus allowing the membrane to rupture and form several oscillatory filaments. From the linear stability analysis, in the oscillatory regime, we expect the frequency of oscillation to follow
ss = N2/(1 + W)/(N − M − MW) allows the identification of several dynamical behaviours for different concentrations of metal ion and injection rates. Fig. 8 illustrates the stable, oscillatory and unstable regimes. At low injection flow rate of the cobalt solution (low N) the filament is unstable: the concentration of precipitate can grow to block the filament growth and internal fluid pressure is sufficient to lead to a slow leak over a larger area of the membrane; this is the radial spreading regime observed in Fig. 3 (top row). At higher injection rate of cobalt the filament exhibits an oscillatory growth pattern. The concentration of precipitate and pressure are lower than in the previous case, so that the membrane at the tip of the filament ruptures and grows in spurts. At still larger injection rates of cobalt (high N), the concentration of the product of reaction is low and the pressure is intermediate, thus allowing the membrane to rupture and form several oscillatory filaments. From the linear stability analysis, in the oscillatory regime, we expect the frequency of oscillation to follow


![[p with combining circumflex]](https://www.rsc.org/images/entities/i_char_0070_0302.gif) for the unstable, oscillatory stable and stable regimes, respectively. These were obtained by solving the model eqn (4a) and (b) numerically.
for the unstable, oscillatory stable and stable regimes, respectively. These were obtained by solving the model eqn (4a) and (b) numerically.


![[d with combining circumflex]](https://www.rsc.org/images/entities/i_char_0064_0302.gif) = d/cDδ and
= d/cDδ and ![[d with combining circumflex]](https://www.rsc.org/images/entities/i_char_0064_0302.gif) = s/cDδ.10 This leads to the following non-dimensional form of eqn (11):
= s/cDδ.10 This leads to the following non-dimensional form of eqn (11):![[d with combining circumflex]](https://www.rsc.org/images/entities/i_char_0064_0302.gif) (s) ∼ aŝ + 2bŝ0.5,
(s) ∼ aŝ + 2bŝ0.5,![[d with combining circumflex]](https://www.rsc.org/images/entities/i_char_0064_0302.gif) as a function of aŝ + 2bŝ0.5, as presented in Fig. 13. Experimental measurements fall on the line x = y, in agreement with the model.
as a function of aŝ + 2bŝ0.5, as presented in Fig. 13. Experimental measurements fall on the line x = y, in agreement with the model.


 , arise when there is a distribution of mean free path/segment lengths with a long tail. That means a significant probability of very long segments. These are called Lévy flights.29


