
 Open Access Article
 This Open Access Article is licensed under a
 Creative Commons Attribution 3.0 Unported Licence
Tuning the structure of cerium phosphate nanorods†
Lisa
Allen‡
 a,
Josh A.
Davies-Jones
*a,
Philip R.
Davies
*a,
Sarah
King
a and
Padraic
O'Reilly
b
a,
Josh A.
Davies-Jones
*a,
Philip R.
Davies
*a,
Sarah
King
a and
Padraic
O'Reilly
b
aCardiff Catalysis Institute, School of Chemistry, Cardiff University, Cardiff, CF10 3AT, UK. E-mail: DaviesJA21@cardiff.ac.uk; daviespr@cardiff.ac.uk
bMolecular Vista, 6840 Via Del Oro Suite 110, San Jose, CA 95119, USA
First published on 2nd November 2021
Abstract
The one-pot, shape selective synthesis of cerium phosphate nanorods has been explored and developed to give nanoparticles with aspect ratios between 3–24.8. Studies of the surface with photo induced force microscopy show for the first time that despite the hexagonal phase bulk structure, mixed monoclinic and hexagonal domains are present in the surface layer demonstrating the importance of surface sensitive, nanoscale vibrational spectroscopy in nanoparticle science. There is also evidence that carbonate is adsorbed preferentially on the monoclinic domains, though whether the carbonate is the cause of the domains or merely adsorbs more easily on this structure has not been determined. Co, Ni and Mn-doped cerium phosphate rods were prepared successfully with aspect ratios of >20. The introduction of dopant ions has a measurable effect upon the magnetic susceptibility but a more significant effect on the bulk crystal phase of the nanoparticles, introducing up to ∼30% monoclinic phosphate in the doped rods.
1 Introduction
Rare-earth orthophosphates (LnPO4) are an important family of functional materials with uses in luminescence1–3 catalysis,4,5 heat-resistance,6 cosmetics,7 radioactive waste storage8 and electrochemistry.9 They often have multiple crystal forms, cerium phosphate for example has two well documented crystal structures: rhabdophane (hexagonal) and monazite (monoclinic) with the hexagonal form usually including structural water, (CePO4·nH2O) and formed at low temperatures while the monoclinic form is anhydrous and formed at high temperatures. The two forms of cerium phosphate show crystal specific properties, Pusztai et al.10 for example, demonstrated differences in the surface area and density of surface acidic sites between the hexagonal and monoclinic forms of cerium phosphate nanorods. They also showed a surface conductivity for the monoclinic form three times greater than that of the hexagonal form, accounted for by the observed differences in surface properties. Similarly, Vinothkumar et al.,11 synthesised samarium doped cerium phosphate nanorods with monoclinic and hexagonal structures and showed a longer luminescent lifetime for the monoclinic form which they attributed to quenching by the structural water in the hexagonal structure. They also showed the monoclinic phosphate to have a higher catalytic activity in the presence of peroxidase which they attributed to a greater ability to create hydroxyl radicals.Since the tuning of the crystal structure of the rare earth phosphates is often a matter of changing simple synthetic parameters such as pH, temperature, or pressure,10–13 these materials offer interesting opportunities to optimise their performance for different applications. This is particularly true for heterogeneous catalysis where surface properties are key but it also applies in situations where growth of one phase on another is necessary. The control of morphology is well documented for ceria nanoparticles, for example Hao-Xin Mai et al.14 prepared cerium oxide nanoparticles as cubes, rods, and polyhedra with different proportions of exposed crystal lattices. The oxygen storage and CO oxidation capabilities of the nanorod and nanocube morphologies, which were assumed to be dominated by [100] and [110] crystal faces, were significantly better than for the polyhedra which were expected to exhibit mainly [111] facets. Si et al.15 reported a similar trend for the water gas shift reaction over ceria supported gold catalysts but in both these cases the surface structure is assumed to be a simple termination of the bulk structure because determining the structure of the upper few monolayers of a nanoparticle is very difficult without high resolution TEM and very good samples.
Our interest in the rare earth phosphates is in their potential use in an optical sensing platform which requires a magnetic character and a coating of a plasmonic material. The cerium phosphates are ideal for this application because of their well-controlled morphology and weak para-magnetism which can be manipulated in the same way that Xia et al.16 greatly increased the magnetic susceptibility of micron sized cerium oxide nanorods through the addition of Mn ions into the lattice. In this report, we investigate the morphology of cerium phosphate nanorods under different synthesis conditions and explore the possibility of increasing the magnetic strength of the nanoparticles by doping with other transition metals. We have a particular interest in the surfaces of the rods since the properties of the surface are critical to the effectiveness of the coating procedures we will report in a future publication. In order to study this aspect, we have employed the relatively new photo induced force microscopy (PiFM) technique which provides surface vibrational spectroscopy together with nanometre resolved topography.17,18 We show that this allows the mapping of surface structural domains on the cerium phosphate nanorods and importantly a correlation between different domains and adsorbed species under ambient conditions which has great potential for exploring the role surface structure plays in determining surface reaction mechanisms in areas as diverse as coatings, adhesion and catalysis.
2 Methods
2.1 Nanoparticle preparation
The cerium phosphate nanoparticles were synthesised in a novel procedure designed for use with a sealed glass flask whereas methods published previously have used an autoclave.19 0.56 g Ce(NO3)3·6H2O (Sigma Aldrich, 99.99%) was added to 40 mL of Na3PO4 (Sigma Aldrich, 99.0%) solution, with a concentration ranging from 8.25 × 10⁻⁵ M to 8.25 × 10⁻² M, and stirred at 300 rpm for 5 minutes at room temperature (∼293 K). The white solution was transferred to a 100 mL sealed glass pressure flask and heated at temperatures between 100–220 °C for 16 hours. After cooling, the precipitate was washed in a centrifuge with deionised water and dried at 70 °C overnight in air.2.2 Doping of cerium phosphate
Doping of cerium phosphate nanorods was carried out at the optimised cerium phosphate nanorod conditions of 180 °C with 8.25 × 10⁻² M KH2PO4. To this, different amounts of dopant were added.Photo induced force microscopy (PiFM)21,22 is a relatively new spectroscopic tool in which dipole–dipole coupling between a surface oscillator and a gold covered AFM tip exerts a measurable force that is detected mechanically. This enables the recovery of near-field vibrational spectra of the surface region that match exactly far-field infrared spectra but are obtained at spacial resolutions well below the diffraction limit. Whilst PiFM can be run in hyper-spectral mode in which every pixel of an AFM image contains a full infrared spectrum, that approach is very time consuming and a more efficient experimental strategy, and the one adopted here, is to either select specific points on an image to record a spectrum or to simultaneously map the topography of a surface with the intensity at a single frequency. Samples of the nano-rods were deposited on mica sheets from aqueous suspension and allowed to dry in air. The samples were sent to California for analysis by Molecular Vista where they were examined in air without further sample preparation. The spectroscopic data was analysed using CasaXPS20 and fitted using Gaussian curves to clarify the changes that occur between different points in the images, details of the fitting procedure are described below.
3 Results and discussion
3.1 Synthesis: effects of phosphate concentration and synthesis temperature
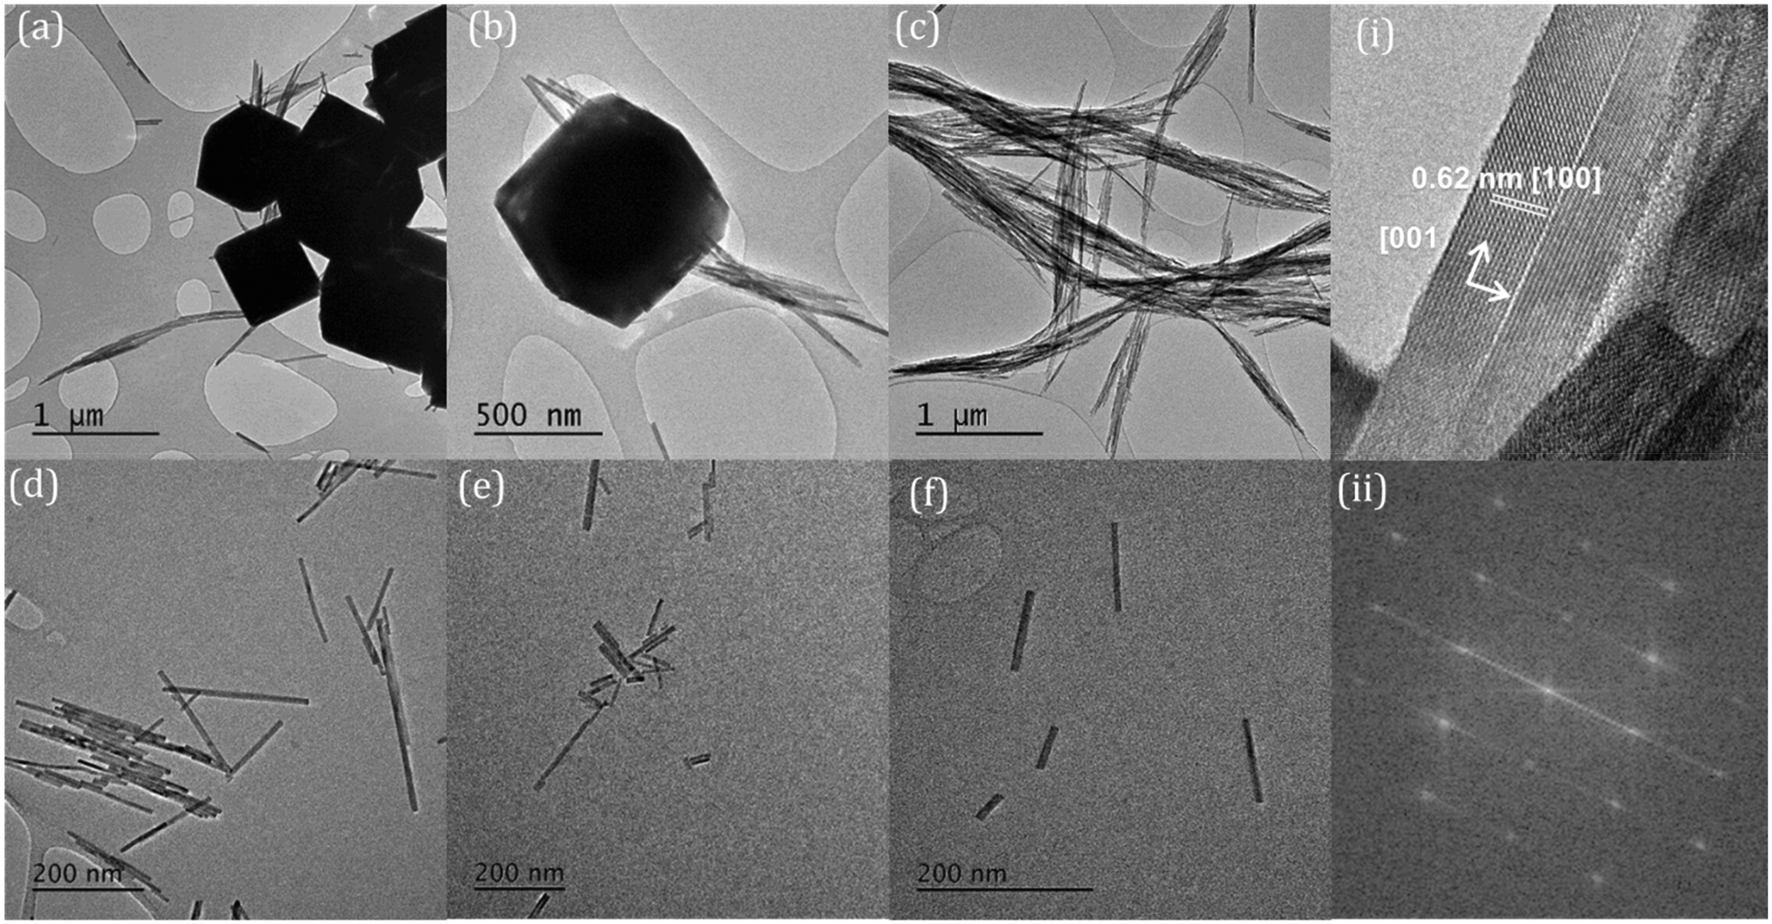
The KH2PO4 or Na3PO4 concentration has a significant effect on the morphology of the cerium nanoparticles produced by the hydrothermal synthesis, Fig. 1, with a transition from predominantly nanocubes (∼200 nm wide) to anisotropic nanorods as the phosphate concentration is increased. In the intermediate stages, the TEM images resemble those of Li et al.23 but we cannot determine from the TEM whether the association of the nanorods with the cubes is due to aggregation or to the growth of one from the other. As the phosphate concentration is increased, the diameter and length of the nanorods increases from 14.2 to 20.3 nm and 43.1 to 503.6 nm respectively, giving an increase in aspect ratio from 3 to 24.8. XP spectra of the Ce3d region (Fig. S1†) shows a corresponding transition from 100% Ce(IV) at the lowest phosphate concentrations, through a mixture of states between phosphate concentrations of 3 × 10⁻⁴ and 5 × 10⁻² M, to 100% Ce(III) at 8.25 × 10⁻² M and a Ce![[thin space (1/6-em)]](https://www.rsc.org/images/entities/char_2009.gif) :P:O ratio of 1:1:4. The data is consistent with a switch from CeO2 nanocubes to CePO4 nanorods as the phosphate concentration is increased.
:P:O ratio of 1:1:4. The data is consistent with a switch from CeO2 nanocubes to CePO4 nanorods as the phosphate concentration is increased.
 | ||
| Fig. 1 TEM micrographs of cerium nanostructures formed with varying concentrations of phosphate at 170 °C (a) 8.25 × 10⁻⁵ M; (b) 3.3 × 10⁻⁴ M; (c) 4.4 × 10⁻⁴ M; (d) 1.65 × 10⁻³ M; (e) 4.125 × 10⁻² M; (f) 8.25 × 10⁻² M. | ||
The temperature at which the synthesis is carried out, also influences the morphology of the nanoparticles. We found two temperature regimes of interest at a phosphate concentration of 8.25 × 10⁻² M. For ≤180 °C we produced exclusively cerium phosphate nanorods, where increasing the temperature in increments up to 180 °C led to a growth in the rod length/aspect ratio. At synthesis temperatures >200 °C, the production of large (≥600 nm) polyhedra dominates. In the lower temperature regime, TEM shows that the rods grow preferential along the [001] axis with a hexagonal crystal structure. The rod length grows with increasing temperature, Fig. 2, from an average length of 98.7 to 795.6 nm with an apparent activation energy of 26.5 kJ mol−1, Fig. S2,† suggesting a process limited by diffusion of cerium intermediates to the ends of the growing rods.
 | ||
| Fig. 2 TEM micrographs of cerium nanoparticles formed at (a) 220 °C; (b) 200 °C; (c) 180 °C; (d) 140 °C; (e) 120 °C; (f) 100 °C; (i) 170 °C with axis labelled; (ii) the FFT of (i) showing preferential growth along the [001] axis and a hexagonal crystal structure. | ||
The XRD data in Fig. 3, confirm the transition from cerium oxide to cerium phosphate as the phosphate concentration is increased, with the particles formed at lower potassium phosphate concentrations displaying XRD patterns corresponding only to that of cerium oxide with intense [111] and [220] peaks characteristic of a cubic fluorite F![[m with combining macron]](https://www.rsc.org/images/entities/i_char_006d_0304.gif) 3m space group. At higher phosphate concentrations, 12 peaks are observed corresponding to the P6222 space group of hexagonal CePO4 with the [200], [102] and [211] peaks being the most intense.
3m space group. At higher phosphate concentrations, 12 peaks are observed corresponding to the P6222 space group of hexagonal CePO4 with the [200], [102] and [211] peaks being the most intense.
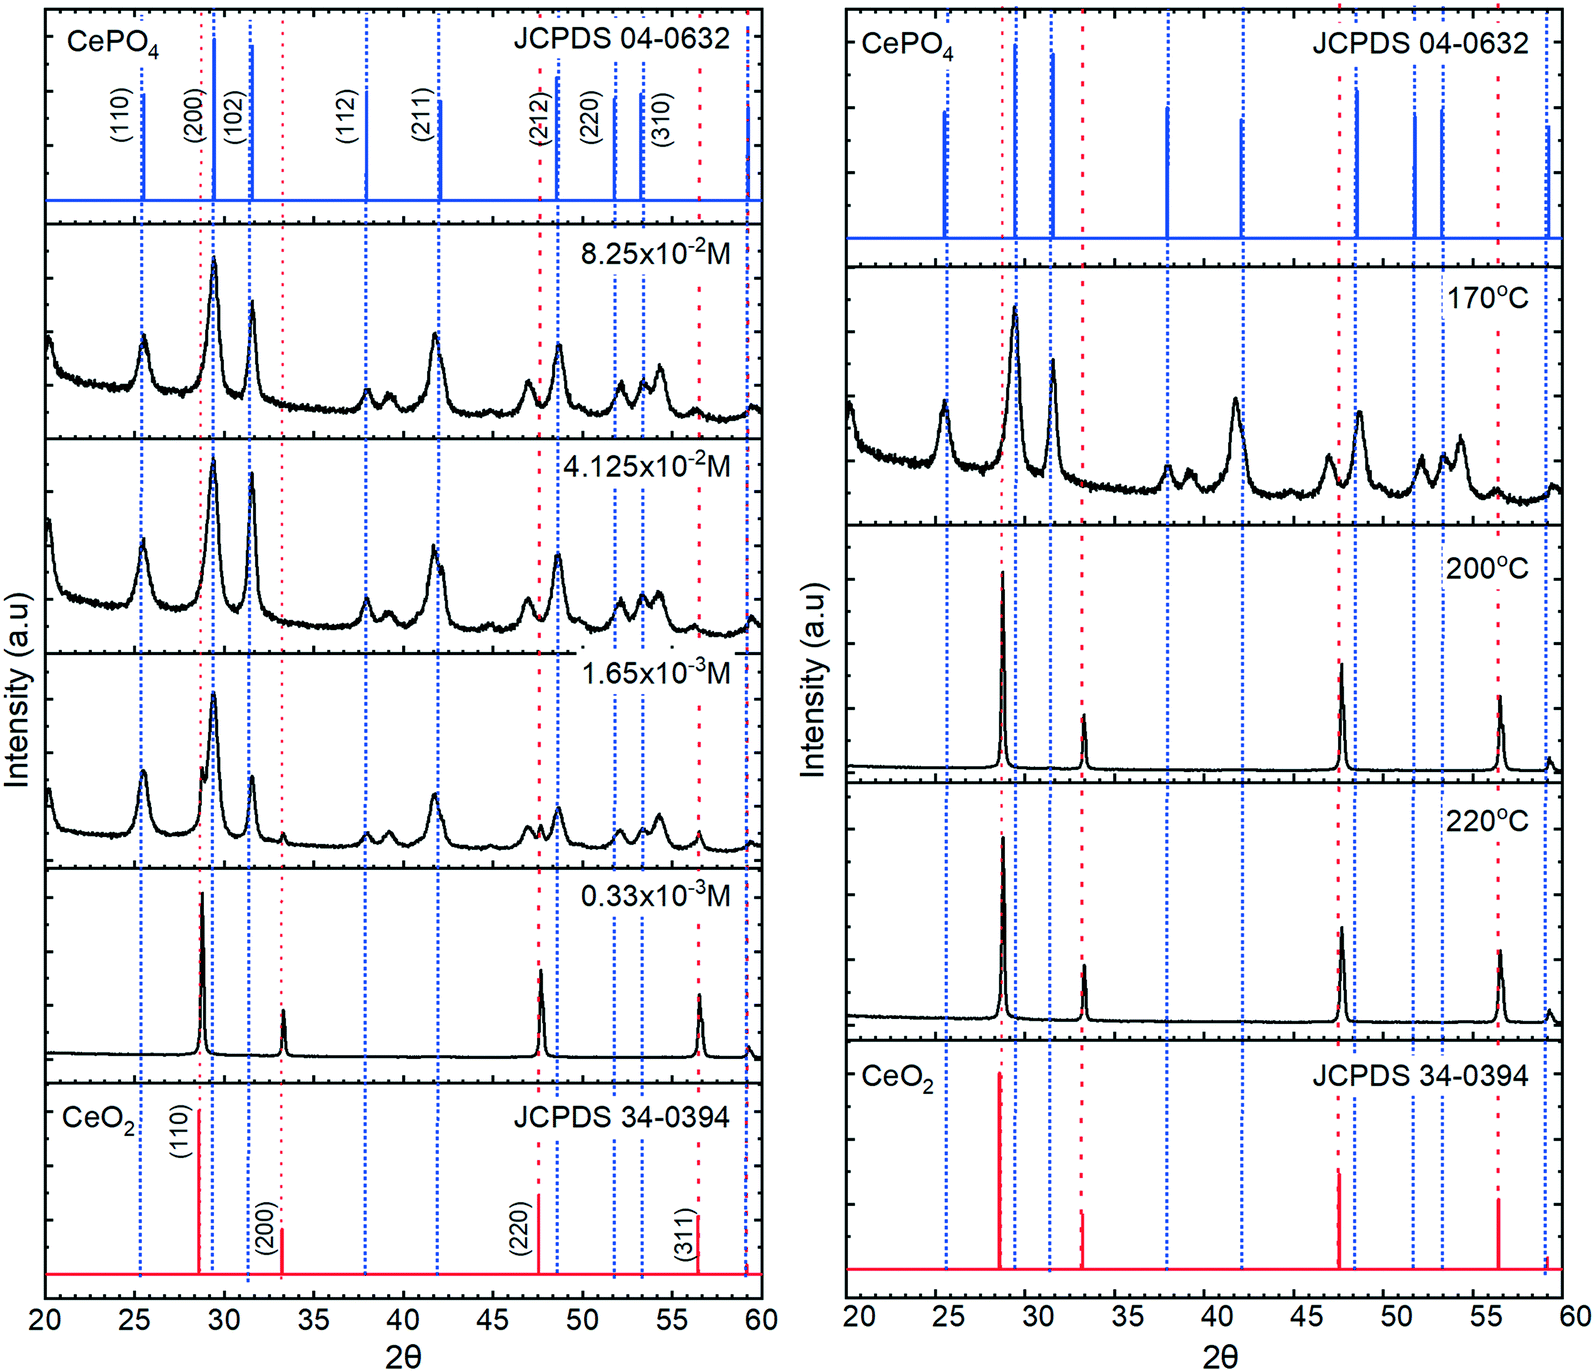 | ||
| Fig. 3 Left, XRD patterns of cerium phosphate nanoparticles obtained at different concentrations of phosphate with reference data from the ICDMS data base for CeO2 and hexagonal CePO4 shown in blue and red, respectively on both charts. Right, XRD for cerium nanoparticles prepared at 220, 200, 170 °C with 8.25 × 10⁻² M potassium phosphate. | ||
Raman spectra of the rods, Fig. 4, show a typical CeO2 pattern at a phosphate concentration of 0.33 × 10⁻³ M with an intense F2g first order phonon at 459 cm−1 corresponding to the fluorite crystal system, and two weak peaks at 260 cm−1 and 1065 cm−1 caused by the second-order transverse acoustic mode (2TA) and a second-order longitudinal optical mode (2LO).24 A weak PO4− symmetric stretching band at 979 cm−1 can also be detected, indicating the presence of some hexagonal structured cerium phosphate in the sample,
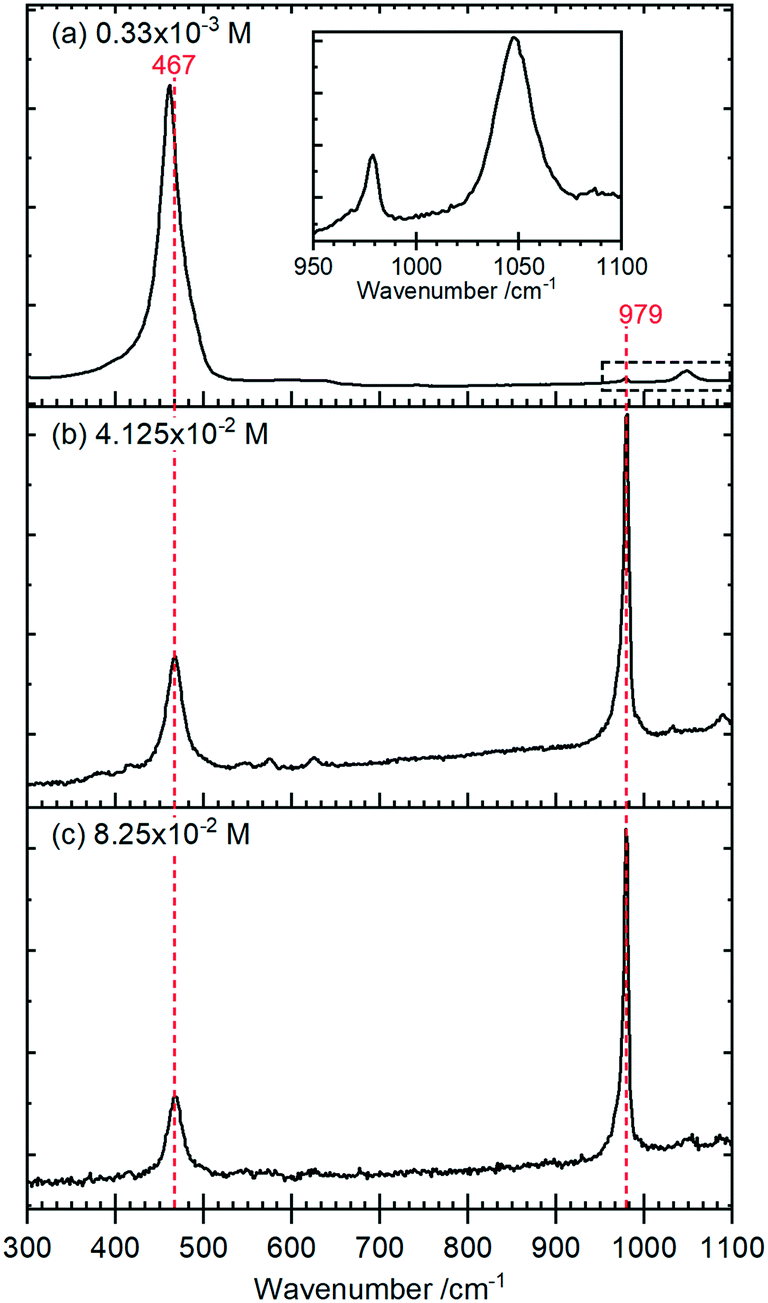 | ||
| Fig. 4 Raman spectra for cerium nanoparticles formed with different concentrations of potassium phosphate (a) 0.33 × 10⁻³ M; (b) 4.125 × 10⁻² M; (c) 8.25 × 10⁻² M. The inset in (a) is a magnification of the PO4 stretching region indicated by the dashed rectangle. | ||
At higher concentrations of phosphate the Raman signal due to the ceria all but disappears (most clearly indicated by the loss of intensity in the 1050 cm−1 peak in (a)) and is replaced by Raman bands at 979 cm−1 and 467 cm−1 that can be assigned to the V1 and V2, PO4 stretching and bending modes of hexagonal CePO4 along with weaker peaks at 1085 cm−1, 627 cm−1 and 573 cm−1, Table 1. Finally, there is evidence for the presence of some monoclinic phase in the samples with weak features at 414 cm−1, 1050 cm−1 and a pronounced asymmetry to the low wavenumber side of the 979 cm−1 peak. The features assigned to monoclinic phosphate are more apparent in the Raman spectra of samples prepared at higher temperatures (Fig. S3†).
| IR-spectroscopy wavenumber/cm−1 | Raman – spectroscopy wavenumber/cm−1 | ||||
|---|---|---|---|---|---|
| Hexagonal | Monoclinic | Assignment | Hexagonal | Monoclinic | Assignment |
| 1104 | V3 | 1085 | 1070 | V3 | |
| 1096 | 1054 | ||||
| 1052 | 1062 | 1024 | |||
| 1020 | 1025 | 990 | |||
| 995 | |||||
| 976 | 969 | V1 | |||
| 967 | 956 | V1 | |||
| 624 | 618 | V4 | |||
| 615 | 623 | V4 | 573 | ||
| 569 | 579 | ||||
| 542 | 567 | 466 | 466 | V2 | |
| 542 | 377 | 414 | |||
Samples of undoped rods formed at higher concentrations of phosphate, and those with mixed morphology were examined with the local spectroscopic tool PiFM. Spectra were obtained at specific points on the nanoparticles between 770 and 1950 cm−1, and intensity maps at selected wavenumbers were also collected, providing a unique insight into the composition of the surface region of the particles. In the discussion below we concentrate mainly on the 900–1200 cm−1 region of the spectrum which can contain components from both monoclinic and hexagonal cerium phosphate. To identify the components involved in the complex envelopes the data was fitted with Gaussian peak shapes with FWHM of 20–25 cm−1. A minimum of 7 peaks is required to give good fits in the 900–1200 cm−1 region of all the spectra. The fitting procedure allowed a variation of ∼±5 cm−1 in position for each peak around the position of the main components expected for the infrared spectra of hexagonal and monoclinic structures. Good fits were obtained with peaks at 971.9 and 1050 cm−1 corresponding to hexagonal vibrations (coloured light brown in Fig. 5) and 1001.8, 1072.6 and 1093.7 cm−1 corresponding to monoclinic vibrations, (coloured yellow in Fig. 5). A sixth component at ∼1020 cm−1 (coloured pink) occurs in both structures and the final component at 1036.0 cm−1 (purple) doesn't match well with any of the expected phosphate vibrations, Table 1. However, the 1036 peak correlates well with other peaks observed at 1410, 1390–1365, and 850 cm−1 which match those expected for a bidentate carbonate at cerium surfaces.26
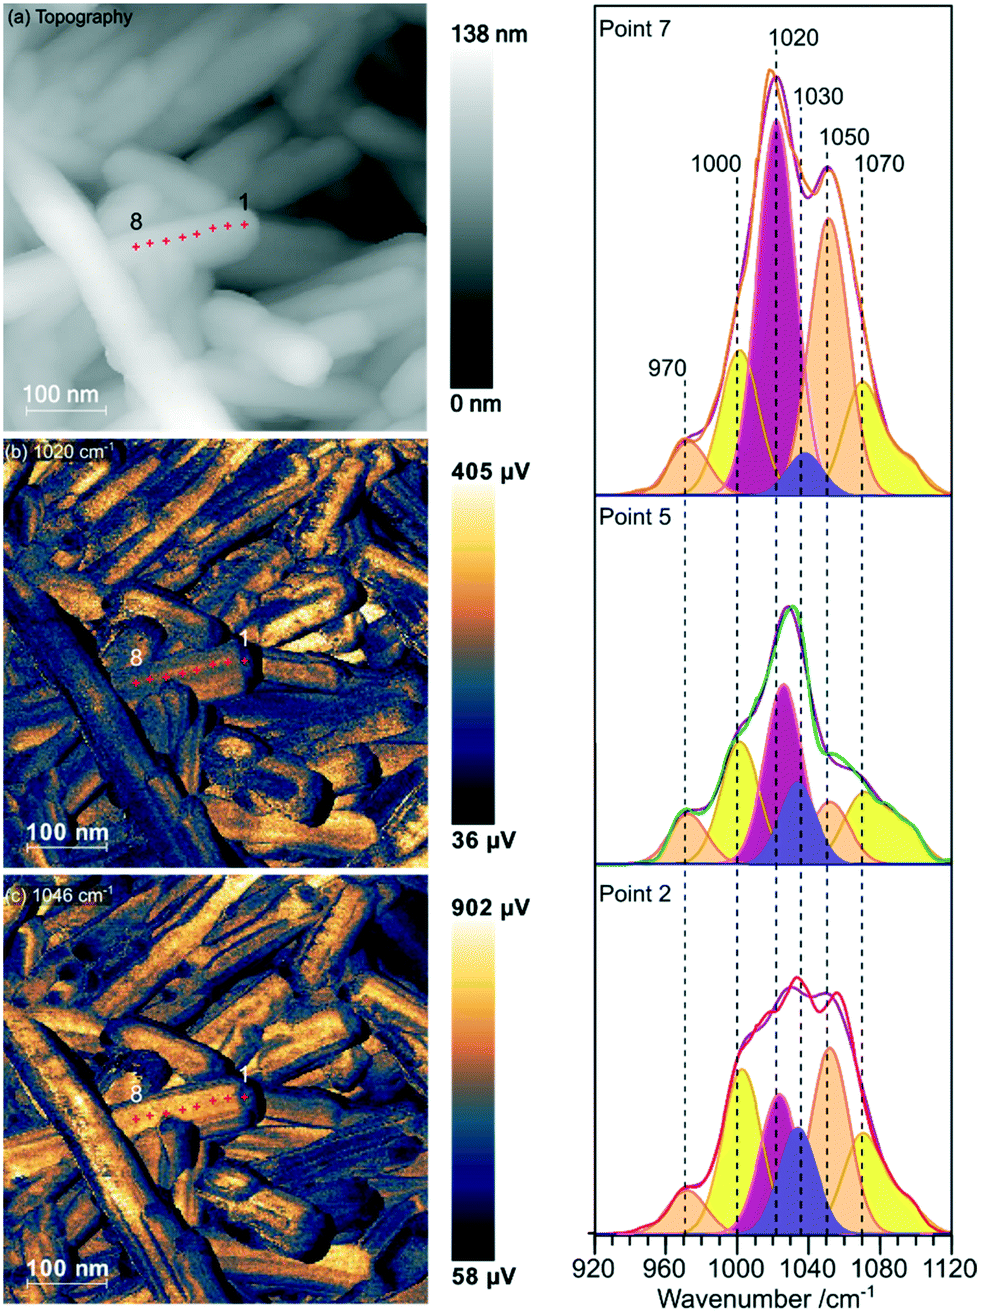 | ||
| Fig. 5 PiFM images and spectra of cerium phosphate nanorods synthesised at a phosphate concentration of 8.25 × 10⁻² M and a temperature of 170 °C. (a) Topography; (b) and (c) maps of the vibrational intensity measured by PiFM at 1020 and 1046 cm−1 respectively selected to contrast the presence of hexagonal structure, see text. (Right) PiFM spectra obtained from positions 2, 5 and 7 marked on the topography and PiFM maps. The V1 and V3 region is shown with the curve fitted peaks coloured according to the species to which they are assigned (light brown = hexagonal CePO4, yellow = monoclinic CePO4, pink = monoclinic and hexagonal, purple = carbonate). Note: in the figure, adjacent monoclinic components are combined for clarity. Full PiFM spectra are shown in Fig. S4.† | ||
Maps of intensity at 1020 and 1046 cm−1 show a consistent state along the rod and the fitting of the spectra reflect this with only small changes in the relative amounts of hexagonal and monoclinic phases between points.
The presence of domains of different structure at the surface of the nano rods is nicely demonstrated in Fig. 6 where the vibrational spectrum of the sample is mapped across a rod. The intensity map at 1066 cm−1, Fig. 6(b), shows areas with higher concentrations of monoclinic phosphate whilst the map at 1020 cm−1 corresponds to the peak that is shared by both monoclinic and hexagonal structures, the differences between the two shows areas populated with higher concentrations of the hexagonal structure. From the 1066 cm−1 map its evident that the monoclinic structure is concentrated on the edge of the rod, whereas the map corresponding to the combined hexagonal and monoclinic signal shows intensity right across the rod. The same pattern is evident on several of the other nanorods. Interestingly, the map at 849 cm−1 correlates very well with that of the monoclinic peak. Adsorbed phosphate can show a peak at this position but would be expected to be present at both hexagonal and monoclinic surfaces. The alternative assignment of the 849 cm−1 peak to carbonate was discussed above and is stronger since it correlates well with the other carbonate peaks. That suggests that the carbonate adsorbs preferentially on the monoclinic phosphate.
 | ||
| Fig. 6 PiFM images and spectra of cerium phosphate nanorods synthesised at a phosphate concentration of 4.4 × 10⁻³ M and a temperature of 170 °C. PiFM intensity maps at: (a) 849 cm−1; (b) 1066 cm−1; and (c) 1019 cm−1; (d) topography, red square indicates the outline of a CeO2 cube; (e) waterfall plot of PiFM spectra across the surface (points 1–10). | ||
In addition to the vibrational spectra, the PiFM maps in Fig. 6 also show the relationship between the nanorods of phosphate and the nanocubes of ceria much more clearly than the TEM images in Fig. 1. It's clear from these images that the phosphate rods are embedded in the surface of a ceria cube confirming previous suggestions that the phosphate rods nucleate on the cubes.
3.2 Growth mechanism
The local vibrational spectroscopy of PiFM provides some evidence towards the growth mechanism of the cubes and rods. Previous work has shown the formation of cerium(III) hydroxide particles from aqueous solutions of the cerium nitrate, which subsequently undergo a dissolution–re-crystallisation process27–29 to form the ceria nanoparticles. The evidence here for the growth of the cerium phosphates from the surface of the ceria is consistent with a mechanism in which high concentrations of phosphate ions direct the hydroxide towards the phosphate. At low phosphate concentrations ceria is formed preferentially but as the local cerium concentration is depleted by precipitation, nucleation of CePO4 on the surface of the cerium oxide nanocubes can take place (Fig. 7).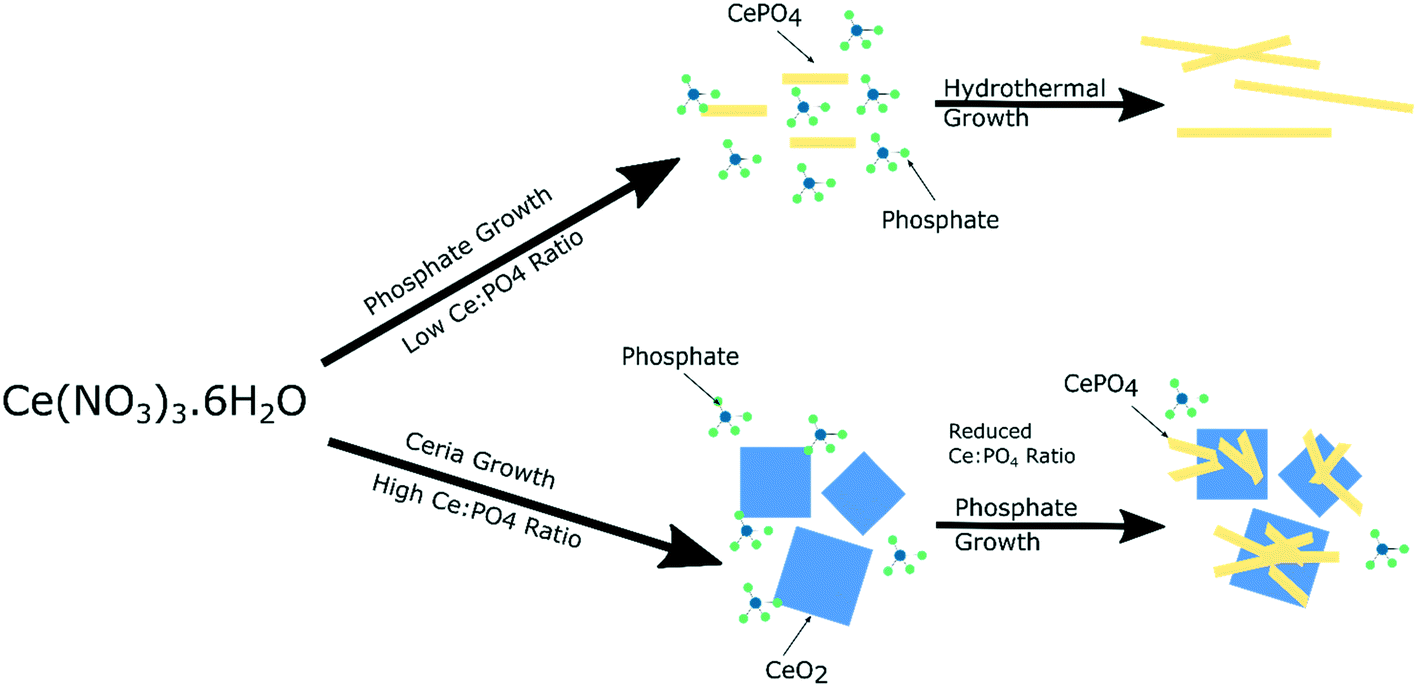 | ||
| Fig. 7 Illustration of suggested growth mechanism of cerium nanoparticles based on phosphate concentration. | ||
3.3 Effect of doping on the morphology and magnetism of the CePO4 nanorods
Cerium phosphate nanorods prepared in the presence of between 0.1 and 3.5 wt% Co2+, Ni2+ and Mn2+ ions showed no difference in rod diameter with a consistent average of 19.6 nm for all the samples. However, the average nanoparticle length was decreased from 430 nm to 346, 312 and 304 nm for ∼3 wt% Ni, Mn and Co respectively (Fig. 8). | ||
| Fig. 8 TEM images of cerium phosphate nanorods synthesised at 180 °C and doped with 0.15 wt% (a) manganese; (b) cobalt, and (c) nickel. | ||
XP spectra of the doped nanorods were recorded to investigate the extent to which the dopants were successfully incorporated into the nanorods. As Fig. 9 (and Fig. S5†) show, these closely match the spectra of the undoped samples with the Ce(3d) region containing only the features typical of the Ce(III) in CePO4. There is no evidence for Ni, Mn, or Co in the XP spectra indicating that the concentrations of these dopants in the surface region are below the detectable limits for XPS (∼1%) even for those samples with nominal doping levels that are much higher.
 | ||
| Fig. 9 XP spectra of Co doped cerium phosphate nanoparticles. Left: Ce(3d) spectra for selected samples; right: corresponding region for dopant. Complete spectra for all samples are shown in Fig. S5.† | ||
Although the XPS data show no evidence for the dopants in the nanorods there is support for them having effects on the rods through other characterisation methods. Changes to the magnetic susceptibility of the nanorods on doping were measurable with a consistent increase for the Mn doped samples but changes that are only just outside the measurement error for the Co and Ni doped samples, Fig. 10.
 | ||
| Fig. 10 Graphs of the average molar susceptibility of doped cerium phosphate nanorods as a function of dopant concentration. The dashed line at 1.714 × 10⁻⁴ cm3 g−1 represents the average molar susceptibility of the undoped nanorods. Errors were calculated from an average of 3 measurements for each substituent. | ||
More concrete evidence for the impact of the dopants is the change in XRD pattern. In the absence of dopants, XRD patterns show a single hexagonal CePO4 phase but inclusion of Ni, Co and Mn all lead to the development of mixed monoclinic and hexagonal phase systems, (Fig. 11 and S6†). Rietveld analysis shows the proportion of the monoclinic phase increases initially up to a maximum of about 40% but decreases again as the dopant concentration increases (Fig. S7, Table S1†).
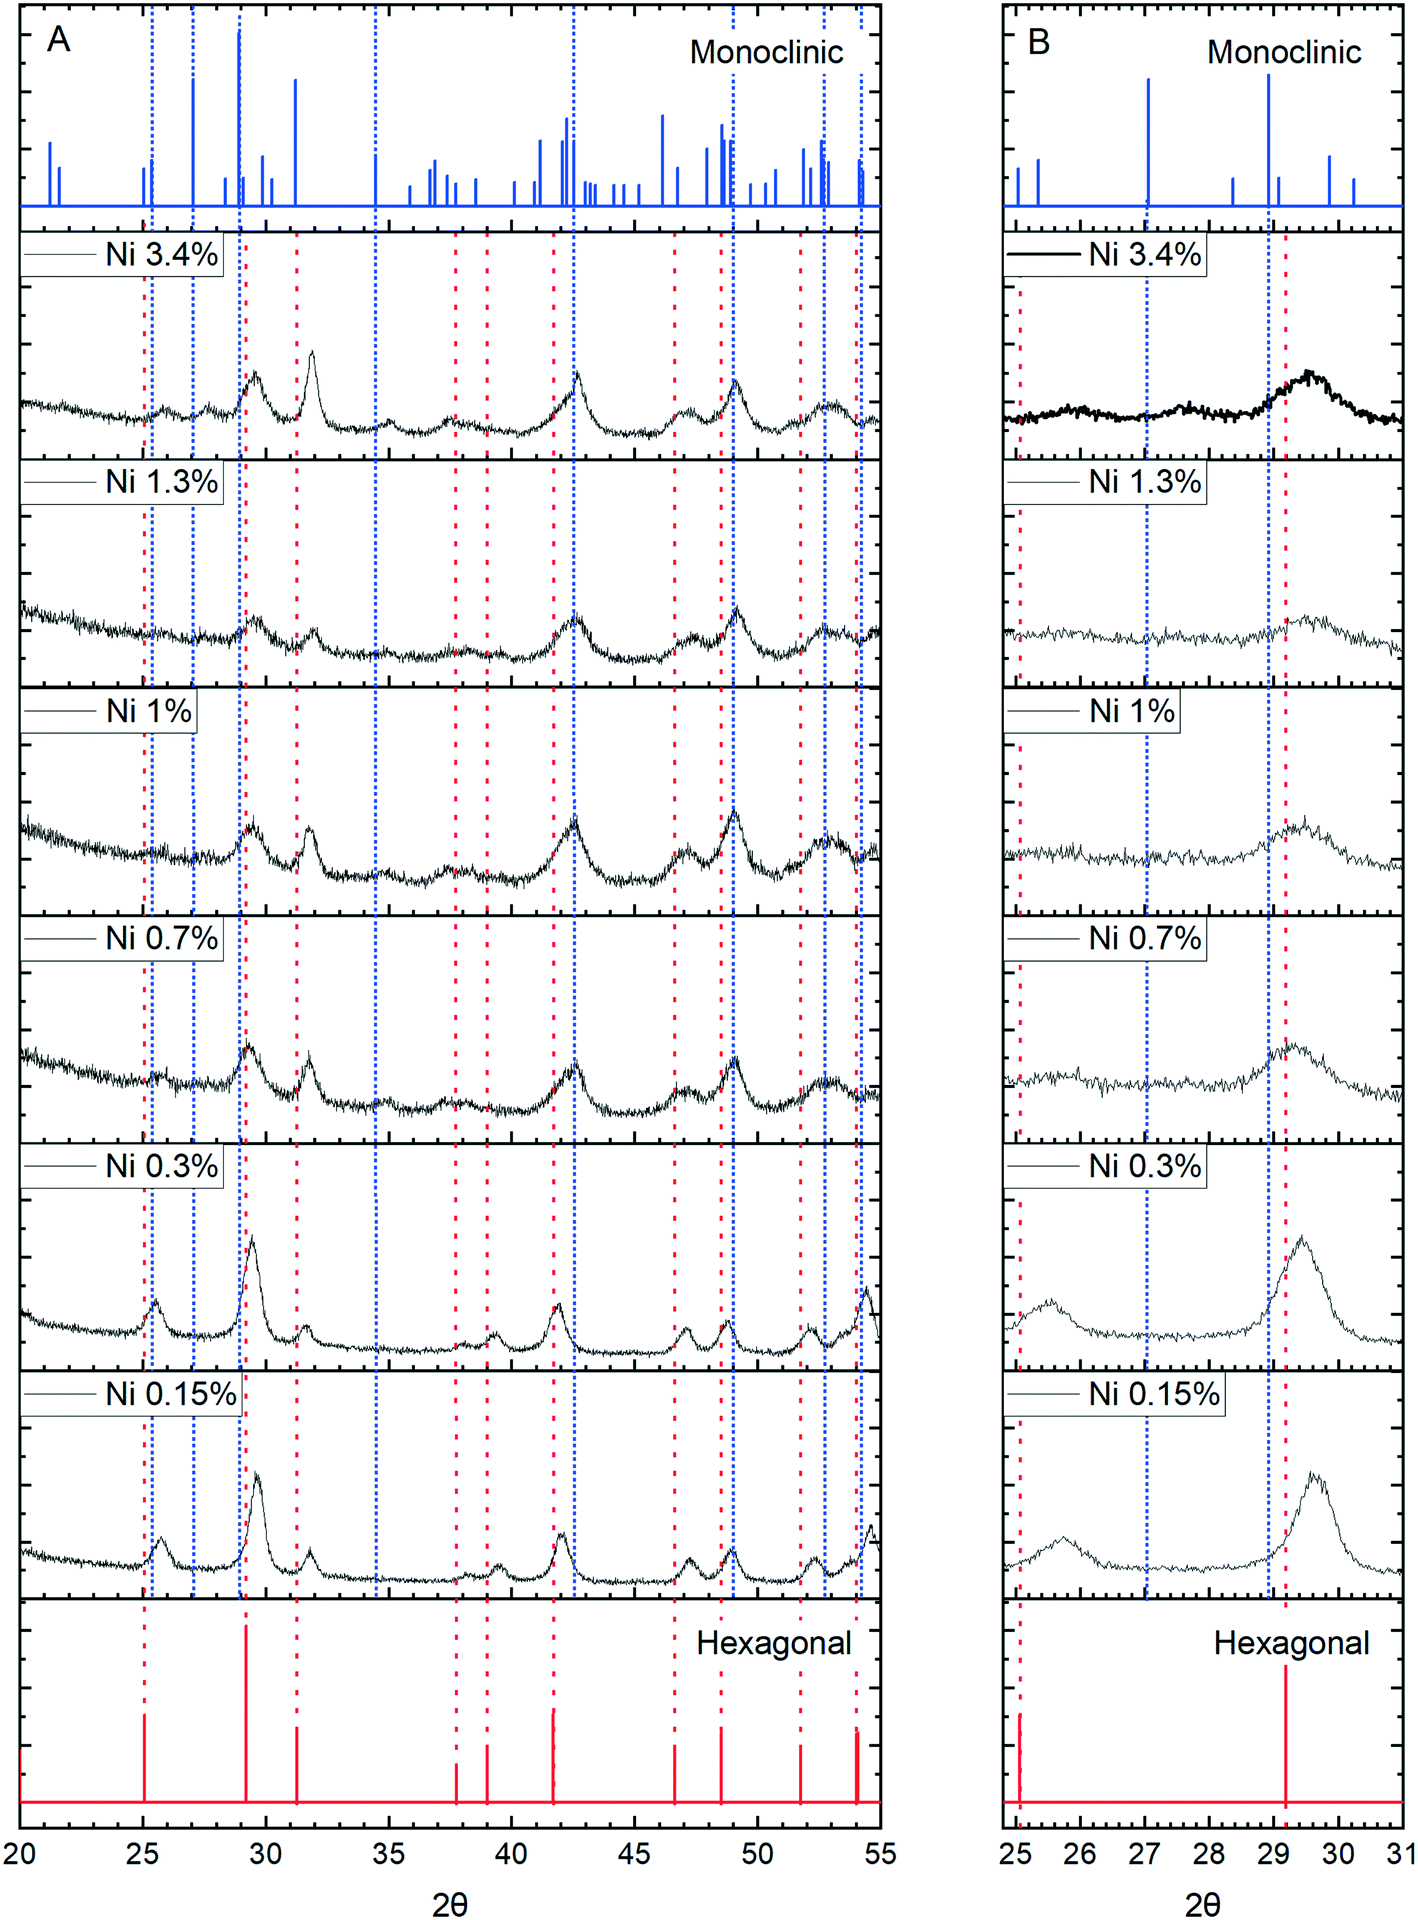 | ||
| Fig. 11 XRD of nickel doped-cerium nanoparticles prepared with 8.25 × 10⁻² M potassium phosphate at 170 °C. The shifts in the precise position of the [200] peak is highlighted in (B) which shows an expansion of (A) along the 2θ scale, providing evidence for the incorporation of nickel into the cerium phosphate lattice followed by a switch to the monoclinic phase. Reference data from the ICDMS data base for monoclinic (JSPDS 39-0199) and hexagonal CePO4 (ICDD 04-0632) are shown at the top and bottom of the chart respectively. | ||
The appearance of the monoclinic phase could be due to an effect of the ions on the crystallisation process but strong evidence for the incorporation of ions within the lattice comes from shifts of the [200] peak to higher angles for all three dopants, Fig. 11 and S8.†
Raman spectra of the doped nanorod systems show no additional peaks that might be attributed to Co, Mn or Ni components, in agreement with the XPS and XRD, but Fig. 9, does show increased complexity in the V3 peaks between 990–1080 cm−1 indicating the presence of other phases. Deconvolution of the spectra identifies new peaks at 971 and 990 cm−1 which, as discussed in connection to the PiFM data are indicative of the presence of a monoclinic phase supporting the evidence from XRD for the effect of substitution of the dopant ions into the lattice (Fig. 12).
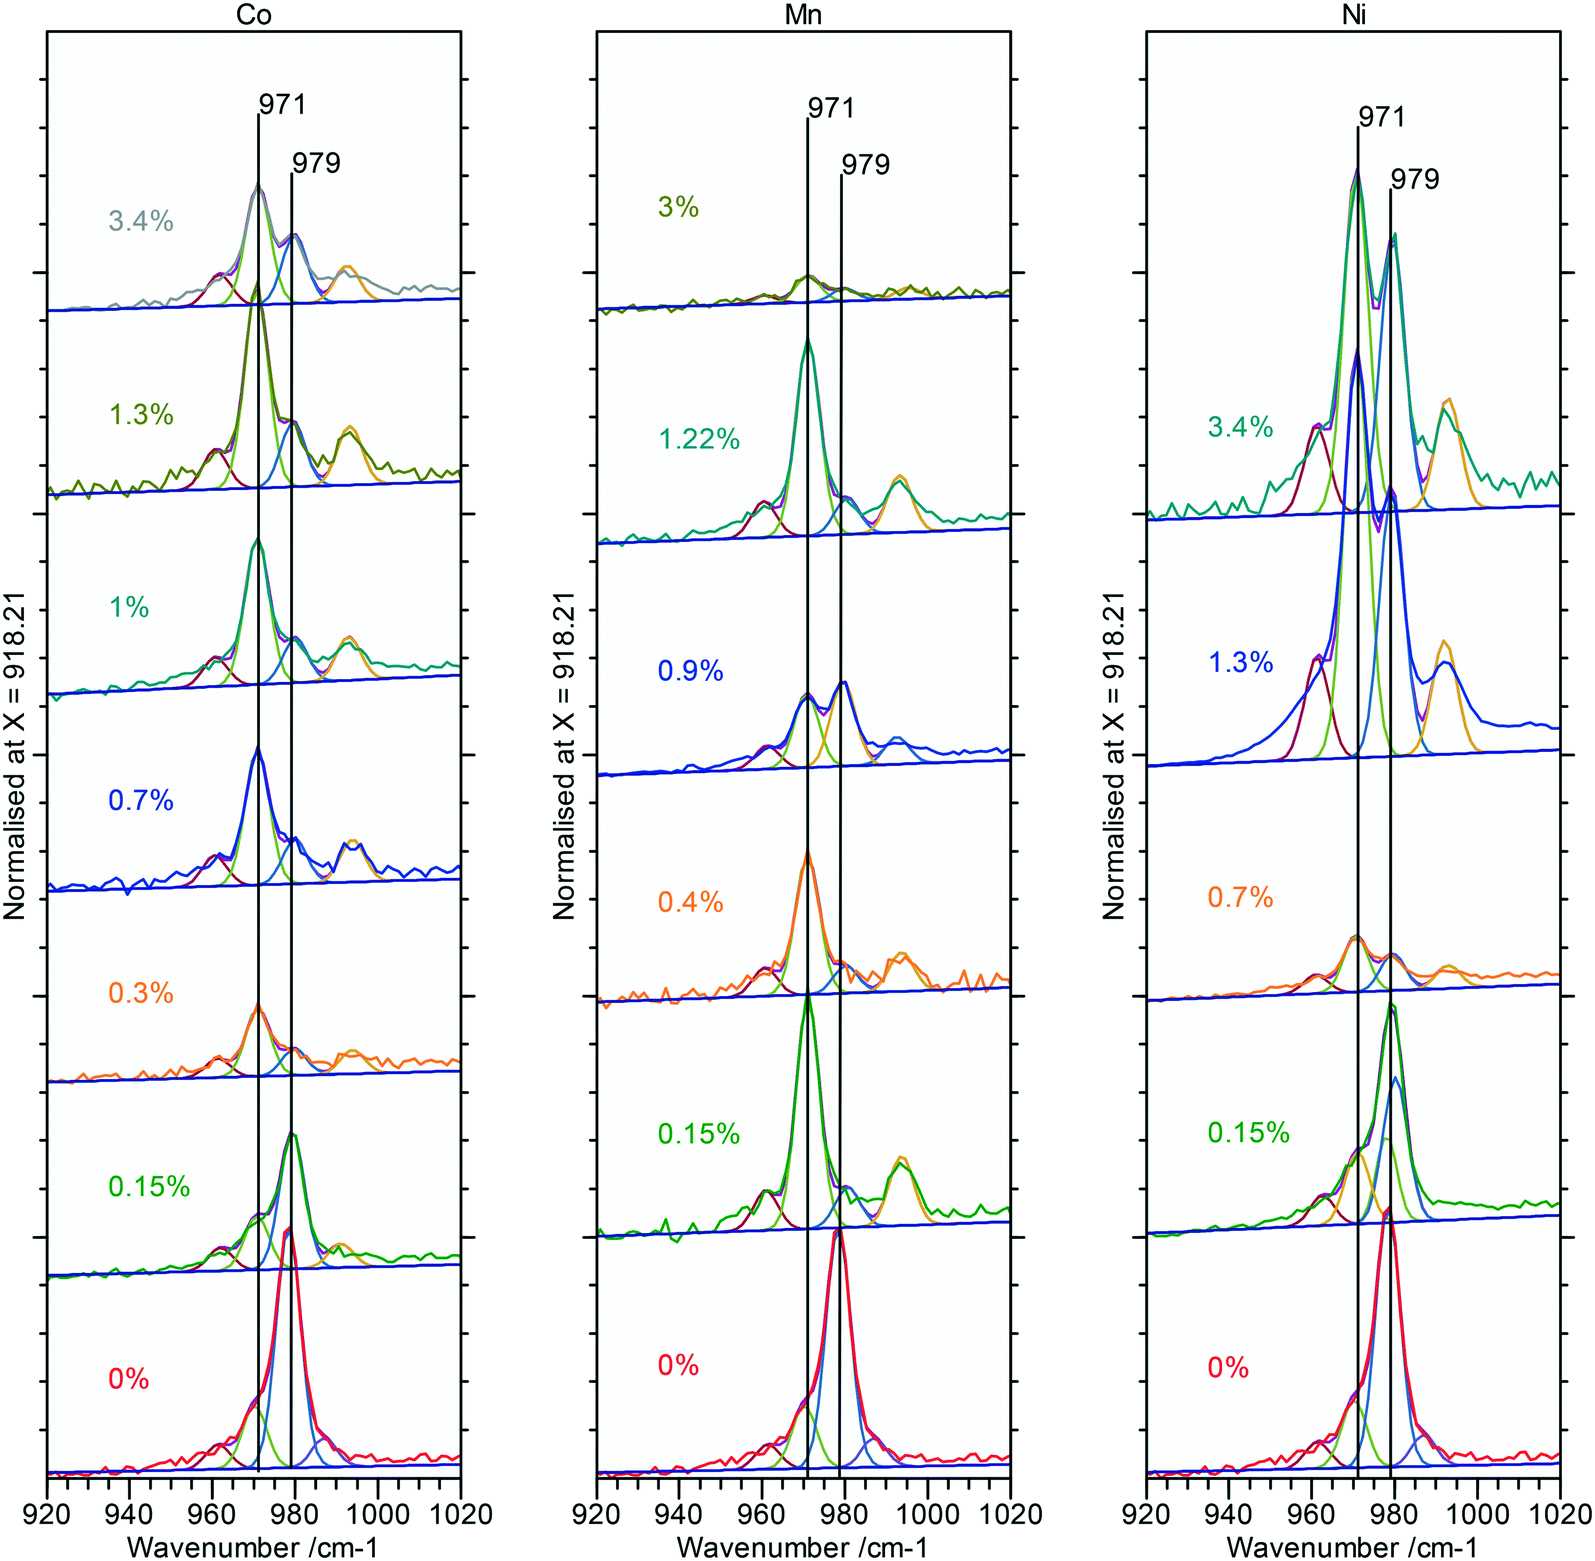 | ||
| Fig. 12 V3 region of the Raman spectra for Co, Mn and Ni doped cerium phosphate rods. Fitting using Gaussian peaks is to guide the eye. The spectra clearly show the enhancement of the monoclinic contribution at 971 cm−1 with dopant concentration. | ||
4 Conclusions
An investigation of the one pot hydrothermal synthesis of cerium phosphate nanorods using sodium phosphate and cerium nitrate has demonstrated a degree of control over the morphology and chemical composition of the nanorods and an insight into the factors affecting crystal growth in this system. CePO4 nanorods with a P6222 space group hexagonal bulk structure, are formed at temperatures <200 °C, while ceria nanocubes and polyhedra form at high temperatures and with low concentrations of phosphate. Under conditions where a mixture of ceria and cerium phosphate is produced the PiFM images suggest that the latter nucleates on the ceria cubes.The method was optimised to give a tuneable aspect ratio for the rods of between 3–26.5. Despite the hexagonal bulk structure, the PiFM spectra show that domains of monoclinic cerium phosphate coexist with the hexagonal structure at the surface of the rods. The spectra also give good evidence for the presence of a surface carbonate associated with the monoclinic domains. This demonstration of the powerful analytical capabilities of surface sensitive vibrational spectroscopy is an important outcome of the investigation. It's not clear from the data whether the surface carbonate is the cause of, or result of, the presence of the monoclinic domains, but this new information is important for work involving the coating of the rods where changes of phase can have a significant impact on the coating growth. The subtle balance between the two phosphate structures is also highlighted by the effect of doping with Co2+, Mn2+ and Ni2+. All three ions were successfully incorporated into the nanorods (as demonstrated by a change in the lattice spacing of the rods) and whilst they did not have a significant impact on the magnetic properties, they did result in the development of bulk domains of the monoclinic phosphate structure.
Author contributions
Josh A. Davies-Jones & Philip R. Davies: conceptualization, data curation, formal analysis, investigation, writing – original draft, review & editing. Lisa Allen, Sarah King and Padraic O'Reilly: investigation, writing – review & editing.Conflicts of interest
There are no conflicts to declare.Acknowledgements
JADJ's PhD was funded by Cotton Mouton Diagnostics Ltd and the Knowledge Economy Skills Scholarships (KESS) a pan-Wales higher level skills initiative led by Bangor University on behalf of the HE sector in Wales. KESS is part funded by the Welsh Government's European Social Fund (ESF) convergence programme for West Wales and the Valleys. XP spectra were acquired by EPSRC National Facility for Photoelectron Spectroscopy (HarwellXPS), operated by Cardiff University and UCL under contract number PR16195. The authors are grateful to Molecular Vista for access to the PiFM system and to Ian Holton of Acutance Scientific Ltd for his help with the PiFM and many stimulating discussions.References
- P. Xu, R. Yu, L. Zong, J. Wang, D. Wang, J. Deng, J. Chen and X. Xing, J. Nanopart. Res., 2013, 15, 1622 CrossRef.
- S. Lin, Y. Yuan, H. Wang, R. Jia, X. Yang and S. Liu, J. Mater. Sci.: Mater. Electron., 2009, 20, 899–904 CrossRef CAS.
- W. Di, X. Zhao, Z. Nie, X. Wang, S. Lu, H. Zhao and X. Ren, J. Lumin., 2010, 130, 728–732 CrossRef CAS.
- S. Navarro-Jaén, M. Á. Centeno, O. H. Laguna and J. A. Odriozola, J. Mater. Chem. A, 2018, 6, 17001–17010 RSC.
- A. Kumar and R. Srivastava, Sustainable Energy Fuels, 2019, 3, 2475–2489 RSC.
- C. Thiriet, R. J. M. Konings, P. Javorský and F. Wastin, Phys. Chem. Miner., 2004, 31, 347–352 CrossRef CAS.
- H. Onoda and R. Tanaka, J. Mater. Res. Technol., 2019, 8, 5524–5528 CrossRef CAS.
- K. Jolley, R. Asuvathraman and R. Smith, Nucl. Instrum. Methods Phys. Res., Sect. B, 2017, 393, 93–96 CrossRef CAS.
- J. Wang, X. Wu, X. Cao, Y. Jiang, D. Zhang, T. Yang, F. Zhang and Y. Luo, CrystEngComm, 2020, 22, 1610–1618 RSC.
- P. Pusztai, H. Haspel, I. Y. Tóth, E. Tombácz, K. László, Á. Kukovecz and Z. Kónya, ACS Appl. Mater. Interfaces, 2015, 7, 9947–9956 CrossRef CAS PubMed.
- G. Vinothkumar, I. L. Arun, P. Arunkumar, W. Ahmed, S. Ryu, S. W. Cha and K. S. Babu, J. Mater. Chem. B, 2018, 6, 6559–6571 RSC.
- Y. P. Fang, A. W. Xu, A. M. Qin and R. J. Yu, Cryst. Growth Des., 2005, 5, 1221–1225 CrossRef CAS.
- A. Ochiai and S. Utsunomiya, Minerals, 2017, 7, 84 CrossRef.
- H.-X. Mai, L.-D. Sun, Y.-W. Zhang, R. Si, W. Feng, H.-P. Zhang, H.-C. Liu and C.-H. Yan, J. Phys. Chem. B, 2005, 109, 24380–24385 CrossRef CAS PubMed.
- R. Si and M. Flytzani-Stephanopoulos, Angew. Chem., Int. Ed., 2008, 47, 2884–2887 CrossRef CAS PubMed.
- C. Xia, C. Hu, P. Chen, B. Wan, X. He and Y. Tian, Mater. Res. Bull., 2010, 45, 794–798 CrossRef CAS.
- L. M. Otter, M. W. Förster, E. Belousova, P. O'Reilly, D. Nowak, S. Park, S. Clark, S. F. Foley and D. E. Jacob, Geostand. Geoanal. Res., 2021, 45, 5–27 CrossRef CAS.
- C. J. Allender, J. L. Bowen, V. Celorrio, J. A. Davies-Jones, P. R. Davies, S. Guan, P. O’Reilly and M. Sankar, Nanoscale Res. Lett., 2020, 15, 161 CrossRef CAS PubMed.
- X. Wen, C. Li and F. Meng, J. Wuhan Univ. Technol., Mater. Sci. Ed., 2014, 29, 229–232 CrossRef CAS.
- N. Fairley, V. Fernandez, M. Richard-Plouet, C. Guillot-Deudon, J. Walton, E. Smith, D. Flahaut, M. Greiner, M. Biesinger, S. Tougaard, D. Morgan and J. Baltrusaitis, Applied Surface Science Advances, 2021, 5, 100112 CrossRef.
- J. Jahng, D. A. Fishman, S. Park, D. B. Nowak, W. A. Morrison, H. K. Wickramasinghe and E. O. Potma, Acc. Chem. Res., 2015, 48, 2671–2679 CrossRef CAS PubMed.
- D. Nowak, W. Morrison, H. K. Wickramasinghe, J. Jahng, E. Potma, L. Wan, R. Ruiz, T. R. Albrecht, K. Schmidt, J. Frommer, D. P. Sanders and S. Park, Sci. Adv., 2016, 2, e1501571 CrossRef PubMed.
- P. Li, Y. Zhou, Z. Zhao, Q. Xu, X. Wang, M. Xiao and Z. Zou, J. Am. Chem. Soc., 2015, 137, 9547–9550 CrossRef CAS PubMed.
- L. He, Y. Ren, Y. Fu, B. Yue, S. C. E. Tsang and H. He, Molecules, 2019, 24, 526 CrossRef PubMed.
- A. Hezel and S. D. Ross, Spectrochim. Acta, 1966, 22, 1949–1961 CrossRef CAS.
- F. Bozon-Verduraz and A. Bensalem, J. Chem. Soc., Faraday Trans., 1994, 90, 653–657 RSC.
- Q. Wu, F. Zhang, P. Xiao, H. Tao, X. Wang, Z. Hu and Y. Lü, J. Phys. Chem. C, 2008, 112, 17076–17080 CrossRef CAS.
- H. X. Mai, L. D. Sun, Y. W. Zhang, R. Si, W. Feng, H. P. Zhang, H. C. Liu and C. H. Yan, J. Phys. Chem. B, 2005, 109, 24380–24385 CrossRef CAS PubMed.
- C. Dong, Y. Zhou, N. Ta and W. Shen, CrystEngComm, 2020, 22, 3033–3041 RSC.
Footnotes |
| † Electronic supplementary information (ESI) available. See DOI: 10.1039/d1ce01151k |
| ‡ Current addresses: Department of Chemistry, University College London, 20 Gordon Street, London, WC1H 0AJ, UK and The Research Complex at Harwell, Rutherford Appleton Laboratory, Harwell Campus, Didcot, Oxfordshire, OX11 0FA, UK. |
| This journal is © The Royal Society of Chemistry 2021 |