
 Open Access Article
 This Open Access Article is licensed under a
 Creative Commons Attribution 3.0 Unported Licence
Protein crystallisation facilitated by silica particles to compensate for the adverse impact from protein impurities†
Xiaoyu
Li
and
Jerry Y. Y.
Heng
 *
*
Department of Chemical Engineering, South Kensington Campus, Imperial College London, London SW7 2AZ, UK. E-mail: jerry.heng@imperial.ac.uk
First published on 19th October 2021
Abstract
In this study, silica particles were used to improve target protein batch crystallisation from a binary protein mixture at a 5 mL scale. Lysozyme (40 mg mL−1) was used as the target protein and thaumatin (0.1–8 mg mL−1) was regarded as a protein impurity. It was demonstrated that even an impurity at the concentration as low as 0.1 mg mL−1 (0.25 w/w% of the target protein) would delay target protein crystallisation, predominantly by extending the induction time. When the silica particles were employed in the system to facilitate crystallisation, target protein crystallisation was significantly improved with a much shorter induction time and higher yield at the end of the experiment. It was also shown that the effectiveness of silica on target protein crystallisation depended on the impurity concentration and silica loading amount.
1. Introduction
Therapeutic proteins have drawn major interests in the current biopharmaceutical market. Cost-effective manufacturing of the therapeutic proteins remains challenging while advanced upstream processes have led to higher titres of secreted proteins.1,2 Efficient downstream processes are the bottleneck of the current protein manufacturing. The mainstream purification and separation processes involve a multi-step protein A chromatography technology which contributes up to 80% of the manufacturing costs.3 Researchers are investigating more efficient and robust alternative technologies to replace or partially replace the conventional chromatography steps.4 Separation and purification methods such as solvent extraction,5,6 membrane-based method,7,8 precipitation9,10 and crystallisation10,11 are the leading potential alternatives. Crystallisation is a widely applied purification process in conventional chemical industries. Furthermore, proteins in crystalline forms possess higher purity and stability which can benefit formulation and storage.12,13Many previous protein crystallisation studies mainly focused on getting large single crystals for biomolecular structural studies in which usually only a few μL of protein solution was used. In the past few decades, researchers have demonstrated that protein crystallisation in batch-mode up to 1 L-scale is also achievable.14–16 Continuous crystallisation platforms have also been developed on a lab-scale demonstrating the potential of adapting crystallisation in a continuous manufacturing fashion.17–22 In general, protein crystallisation is a feasible and scalable purification and isolation technology for downstream bio-separation.
Protein crystallisation remains challenging since spontaneous nucleation is a rare event. The ability to control protein nucleation and henceforward its crystallisation process is a major bottleneck. To address this concern, recent studies showed that heterogeneous nucleants were able to provide a better control of the nucleation process and thus had the potential to facilitate rational design of selective protein crystallisation for isolation and purification steps.23,24 A wide range of such nucleants with designed chemical and physical properties have been developed, for instance, porous silicon,25 nanowrinkle substrates,26,27 mesoporous MOFs,28 magnetic particles,29 DNA origami,30 amino acids,31etc. In most of the cases, the focus has been on the use of templates to increase the possibility of crystallisation from a protein solution with high purity. However, some limited cases of selective crystallisation were also described.26,32–35 Nonetheless, systematic knowledge of the crystallisation behaviour of the target protein from the mixture is still absent. The reported selective crystallisation cases only focused on specific scenarios either with an ultralow protein concentration, with a very limited range of protein composition of the mixture, or at a relatively small scale and long-time span which are not suitable for industrial application.
In this study, it was demonstrated that protein impurities had an adverse impact on target protein crystallisation. Additionally, a method with the aid of silica nucleants to accelerate protein crystallisation was proposed to compensate for the negative impacts of protein impurities.
2. Methodology
Materials
Lysozyme from chicken egg white (L6876), thaumatin from Thaumatococcus daniellii (T7638), 1,4-piperazinediethanesulfonic acid (PIPES) (≥99%), potassium sodium tartrate tetrahydrate (99%), mesoporous SBA-15 (806803, <150 μm particle size, pore size: 4 nm, hexagonal pore morphology), non-porous silica (904465, monodisperse, non-porous, 2.0 μm), and mesoporous silica (806900, mesoporous, 2 μm particle size, pore size: ∼4 nm) were purchased from Sigma-Aldrich (Dorset, UK). Sodium hydroxide (>98.5%) was purchased from VWR (Lutterworth, UK). Deionised water was obtained using a PURELAB Chorus 1 water purification system (ELGA LabWater). All chemicals were used as received without further purification.Characterisation of silica particles
Silica particles purchased from Sigma were further investigated by nitrogen adsorption experiments to further confirm their pore sizes. Silica particles were degassed at 120 °C for 24 hours before the nitrogen adsorption studies. The nitrogen adsorption and desorption isotherms were then obtained by using a TriStar3000 (Micromeritics Instrument Corporation) and calculation of the specific surface area based on the Brunauer–Emmett–Teller (BET) model and pore size distribution based on the Barrett–Joyner–Halenda (BJH) model were done using software.Dynamic light scattering
The hydrodynamic diameters of lysozyme and thaumatin were determined using dynamic light scattering (DLS). DLS measurements were performed on aqueous protein solutions in 0.1 M PIPES buffer using a Malvern Zetasizer μV (Malvern Instruments, UK) with disposable polystyrene cuvettes. Measurements were repeated at least 5 times and the averaged data are used.Hanging-drop vapour-diffusion protein crystallisation
The hanging-drop vapour-diffusion (HDVD) crystallisation method was used in this study. Potassium sodium tartrate tetrahydrate precipitant solution (28 mg mL−1 to 560 mg mL−1) was prepared by dissolving potassium sodium tartrate tetrahydrate in 0.1 M PIPES buffer, pH 6.8. All precipitant solutions were filtered through 0.22 μm Millex-GS syringe filter units (Millipore) before crystallisation trials. Lysozyme solution was prepared by dissolving the protein powder into a buffer solution which was the same buffer as used for precipitant preparation. All protein solutions were filtered through a 0.22 μm syringe filter (VWR) before crystallisation trials. 5 mg silica was measured in an Eppendorf tube and suspended with 1 mL of the precipitant solution. A 24-well VDX™ plate with sealant (Hampton Research) was used in the HDVD experiments. Each well was filled with 500 μL precipitant solution as a reservoir solution. A 4 μL droplet with an equal volume of the protein solution and precipitant solution (same as the reservoir solution) was deposited on a borosilicate cover glass (VWR). The cover glass with the protein–precipitant drop was carefully inversed and sealed onto the well filled with the reservoir solution. The crystallisation plates were then placed into an incubator (20 °C ± 0.5 °C). The plates were observed using a CX41 optical microscope (Olympus) regularly after they were set-up. Microscopy images were captured using a GXCAM HICHROME-MET camera (GT Vision).Batch protein crystallisation
A crystallisation precipitant solution was prepared by dissolving potassium sodium tartrate tetrahydrate at 560 mg mL−1 in 0.1 M PIPES buffer, pH 6.8. Protein (lysozyme/thaumatin) solution was prepared by dissolving the protein powder into a buffer solution which was the same buffer as used for precipitant solution preparation. Protein concentration in the solution was determined using a Nanodrop Onec microvolume UV-vis spectrophotometer (Thermo Scientific™) at 280 nm using a mass extinction coefficient (ε1%) of 26.4 L g−1 cm−1 for lysozyme and 12.7 L gm−1 cm−1 for thaumatin.36 Lysozyme–thaumatin mixtures were prepared by mixing the pre-prepared lysozyme solution and thaumatin solution with determined concentrations. All solutions were filtered through 0.22 μm Millex-GS syringe filter units (Millipore) before crystallisation trials were set up.All batch crystallisation experiments in this study were conducted at a room temperature of 21 °C (±1 °C) with at least 2 replicates for each condition. The experiments were implemented in a 10 mL glass vial. Silica particles were added to the glass vial carefully avoiding attachment to the container wall. 2500 μL protein solution was added to the tube and then 2500 μL precipitant solution was added to the same tube. The resulting solution was actively mixed manually by pipetting several times before sitting on the bench or the shaker. The samples were placed on an orbital shaker (SciQuip, SP2250-03, 20 mm orbital diameter) immediately after mixing. To track the crystallisation process in a sample, the dissolved protein concentration was monitored off-line over time. A 10 μL aliquot was sampled each time and was centrifuged at 2000g (Thermo Scientific™ mySPIN™ 6) for 1 min to settle any particles in the sample. The supernatant after centrifugation was used to measure the dissolved protein concentration in the solution using a Nanodrop Onec microvolume UV-vis spectrophotometer (Thermo Scientific™) at 280 nm with 3 repeats each time. Microscopy observations using an optical microscope (Olympus, CX41) were compiled to ensure that the concentration change was from crystallisation rather than liquid–liquid phase separation, precipitation or other amorphous condensations. Microscopy images were captured using a mounted camera on the microscope (GT Vision, GXCAM HICHROME-MET).
3. Results and discussion
Effect of thaumatin as a protein impurity on lysozyme crystallisation kinetics
As shown in Fig. 1, protein impurities had a negative impact on target protein crystallisation in the model system studied. Thaumatin had an adverse impact on the lysozyme concentration even for a low impurity concentration of 0.1 mg mL−1 (0.25 w/w% of the target protein concentration). The more thaumatin added, the longer the induction time and the lower yield was achieved after 9 hours. This agrees with our previous results from the HDVD experiments in which lysozyme crystals appeared later in a droplet with thaumatin compared to a droplet with only lysozyme.37 Considering the maximum error bar from pure lysozyme crystallisation experiments with more repeats, for low impurity concentration no more than 0.4 mg mL−1, once target protein crystallisation started, the yields at the 9th hour were not significantly different compared to the yield from pure lysozyme crystallisation. In our previous study, we showed that lysozyme concentrations after 2 weeks were not dependent on the thaumatin concentration in the system.38 And thus, we hypothesised that lysozyme solubility, in the impurity concentration range investigated in this study, was not influenced by thaumatin impurities. Thaumatin impurities tended to delay lysozyme nucleation rather than the later stage of crystallisation dominated by crystal growth in batch crystallisation. Kovalchuk et al. showed that an oligomer including a dimer and octamer of lysozyme might be the essential building block for tetragonal lysozyme crystallisation.39 The presence of thaumatin could lower the probability of formation of such an oligomer and thus delayed nucleation. Once nuclei were formed, the effects of added thaumatin were less significant, especially in a non-diffusion-limited system when shaking was involved to promote mass transport of lysozyme molecules. | ||
| Fig. 1 Normalised lysozyme concentration over time with different amounts of thaumatin in the solution. | ||
Effect of silica particles in pure lysozyme batch crystallisation
As shown in Fig. 2A, in the HDVD experiments, the success rate of lysozyme crystallisation was increased by the addition of silica particles and SBA-15 had the most noticeable impact while mesoporous silica had the least when the same amount of silica particles was used. For a more detailed qualitative and scalable study of the impact of silica particles, batch crystallisation at 5 mL with agitation was conducted. | ||
| Fig. 2 (A) Occurrence of lysozyme crystal(s) in the HDVD experiments with different silica particles; (B) normalised lysozyme concentration over time in batch lysozyme crystallisation (5 mL) with different amounts of silica particles. At least 48 droplets were set for each condition in the HDVD experiments. Pure lysozyme crystallisation experiments and experiments with 10 mg of SBA-15 were repeated 5 times and others were repeated twice. | ||
As shown in Fig. 2B, all cases with silica particles showed accelerated lysozyme crystallisation compared to experiments without silica employed. Agreeing with the HDVD experimental results, SBA-15 had the most noticeable impact even at a lower amount and non-porous silica worked more effectively than mesoporous silica when the same silica loading was used. As shown in Fig. 3, the yield was improved by the addition of SBA-15 and the induction time was dramatically reduced compared to that of non-seeded experiments. Addition of 1 mg SBA-15 was able to reduce the induction time by about 3 hours while further addition of SBA-15 had no significant further improvement on induction time reduction. With a similar induction time, 10 mg of SBA-15 gave a better yield, especially in the first 6 hours. The induction time would be significantly reduced by silica particles. The difference of the yields at the end of the experiments with and without silica particles ranged from less than 1% to around 15%. Silica particles were discovered to have more impact on the acceleration of crystallisation on the early stage of nucleation rather than the crystal growth. Our previous study has demonstrated that non-porous silica can mitigate the negative impact from protein impurities via adsorption of proteins on particle surfaces while no effect of silica particles on protein solubility was observed.34 Researchers also showed that porous silica has a positive impact as heterogeneous nucleants.32,33,35 As shown in Table 1, mesoporous silica had the highest surface area while non-porous silica had the lowest. Contradicting our hypothesis, non-porous silica worked better on improving lysozyme crystallisation compared to mesoporous silica. The hydrodynamic diameter measured by DLS was 4.48 ± 0.74 nm for lysozyme and was 6.57 ± 1.61 nm for thaumatin. Considering the size of lysozyme molecules and pore size of the silica, the pores seemed not accessible for thaumatin in all cases and only accessible for lysozyme when SBA-15 silica was used. Though mesoporous silica particles had the highest surface area, most of them would not be beneficial for lysozyme adsorption and further facilitating lysozyme nucleation.
 | ||
| Fig. 3 (A) Yield of protein crystallisation (lysozyme at a starting concentration of 40 mg mL−1) with different amounts of SBA-15; (B) induction time of lysozyme crystallisation (40 mg mL−1) with different amounts of silica loading. | ||
| BET surface area (m2 g−1) | BJH adsorption average pore diameter (nm) | BJH desorption average pore diameter (nm) | |
|---|---|---|---|
| SBA-15 silica | 470.75 | 5.20 | 5.06 |
| Mesoporous silica | 502.02 | 4.10 | 4.40 |
| Non-porous silica | 2.67 | — | — |
Using silica particles to compensate for the adverse impact from protein impurities
As shown in Fig. 4, SBA-15 silica particles could also accelerate lysozyme crystallisation in the protein mixture system by shortening the induction time of crystallisation. As shown in Fig. 5(B), a minimum induction time could be achieved by addition of silica particles while further addition of silica nucleants would not reduce the induction time. With the increasing amount of thaumatin, the amount of silica nucleants would be higher to reach a similar induction time to that of the lower impurity level experiments as the adsorption of proteins on silica surfaces was non-specific. Both types of protein molecules would be driven to the surface and the existence of thaumatin would reduce the chance of the target protein to form nuclei on the silica surface when not enough surface area was provided. Induction time was dramatically reduced by addition of 1 mg SBA-15 in the experiments with 0.08 mg mL−1 thaumatin and the induction time remained similar for an SBA-15 loading amount of above 10 mg. For the experiments with a higher amount of thaumatin, 4 mg mL−1, 30 mg more SBA-15 was required to shorten the induction time to a similar level. The amount of silica required to mitigate the adverse impact of protein impurities increased with the increasing protein impurity content. Similar to crystallisation from pure lysozyme, even when thaumatin is present as an impurity in the system, silica mainly facilitated target protein crystallisation in the nucleation stage. The induction time was shortened rather than the final yield at the end of the experiments. And thus, we assumed that the final equilibrium state was not manipulated by addition of silica. The improvement of crystallisation was at the early stage of nucleation rather than changing the protein solubility. | ||
| Fig. 4 Normalised lysozyme concentration profiles with different amounts of thaumatin impurities and silica particles. | ||
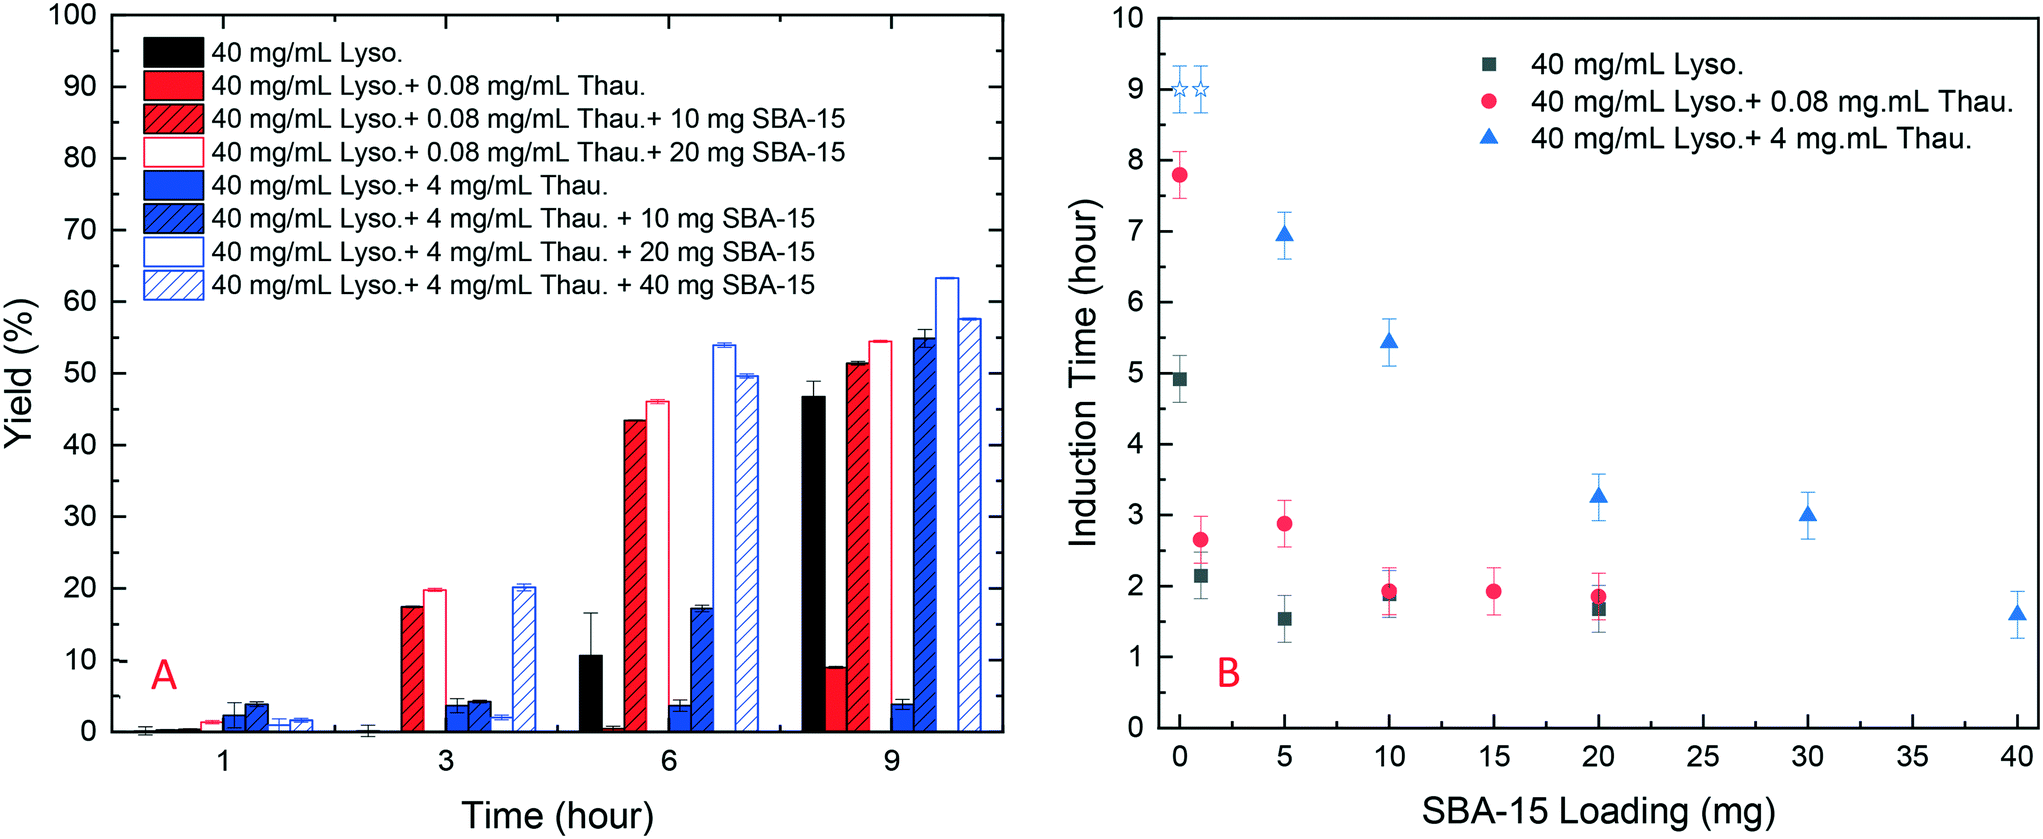 | ||
| Fig. 5 (A) Yield of batch protein crystallisation with different amounts of thaumatin and amounts of SBA-15; (B) induction time of batch lysozyme crystallisation with different amounts of thaumatin and silica loading (derived from Fig. S4 in the ESI†). Note: blue stars represent the experiments in which no crystallization occurred within 9 hours and thus the real induction time was higher than 9 hours in these cases. | ||
4. Conclusion
This study demonstrated the negative impact of protein impurities on target protein crystallisation. In our model system, even a trace amount of thaumatin impurities would delay lysozyme crystallisation by hours. Silica particles, porous or non-porous, could accelerate lysozyme crystallisation in pure protein crystallisation experiments or in crystallisation from a protein mixture. An optimal silica loading amount depended on the lysozyme concentration and thaumatin impurity concentration. The more impurities, the more silica required to compensate for the negative impacts on target protein crystallisation. The study indicated that the accessible surface provided by the silica particles played a role in accelerating the protein crystallisation process via heterogeneous nucleation. In future studies, for the design of silica nucleants to optimise a protein crystallisation process, the roles of silica particle size and the correlation between protein size and pore size of silica would need to be further investigated.Conflicts of interest
There are no conflicts to declare.Acknowledgements
This work was financially supported by the Seeding and Continuous Biopharmaceutical Crystallisation (SCoBiC) Project (EP/N015916/1) funded by EPSRC. We acknowledge useful discussions with Dr Wenqian Chen.References
- V. Natarajan and A. L. Zydney, Biotechnol. Bioeng., 2013, 110, 2445–2451 CrossRef CAS PubMed.
- A. A. Shukla and J. Thommes, Trends Biotechnol., 2010, 28, 253–261 CrossRef CAS PubMed.
- J. A. V. Costa, H. Treichel, L. O. Santos and V. G. Martins, in Current Developments in Biotechnology and Bioengineering, ed. A. Pandey, C. Larroche and C. R. Soccol, Elsevier, 2018, pp. 357–372, DOI:10.1016/B978-0-444-63990-5.00016-5.
- J. Thommes and M. Etzel, Biotechnol. Prog., 2007, 23, 42–45 CrossRef PubMed.
- S. Y. Lee, I. Khoiroh, C. W. Ooi, T. C. Ling and P. L. Show, Sep. Purif. Rev., 2017, 46, 291–304 CrossRef CAS.
- P. A. J. Rosa, I. F. Ferreira, A. M. Azevedo and M. R. Aires-Barros, J. Chromatogr. A, 2010, 1217, 2296–2305 CrossRef CAS PubMed.
- A. L. Zydney and R. van Reis, in Reference Module in Biomedical Sciences, Elsevier, 2016, DOI:10.1016/B978-0-12-801238-3.99815-5.
- V. Orr, L. Zhong, M. Moo-Young and C. P. Chou, Biotechnol. Adv., 2013, 31, 450–465 CrossRef CAS PubMed.
- F. W. F. Wong, A. B. Ariff and D. C. Stuckey, Crit. Rev. Biotechnol., 2018, 38, 31–46 CrossRef CAS PubMed.
- R. dos Santos, A. L. Carvalho and A. C. A. Roque, Biotechnol. Adv., 2017, 35, 41–50 CrossRef CAS PubMed.
- D. Hekmat, Bioprocess Biosyst. Eng., 2015, 38, 1209–1231 CrossRef CAS PubMed.
- M. X. Yang, B. Shenoy, M. Disttler, R. Patel, M. McGrath, S. Pechenov and A. L. Margolin, Proc. Natl. Acad. Sci., 2003, 100, 6934–6939 CrossRef CAS PubMed.
- S. Stolnik and K. Shakesheff, Biotechnol. Lett., 2009, 31, 1–11 CrossRef CAS PubMed.
- R. A. Judge, M. R. Johns and E. T. White, Biotechnol. Bioeng., 1995, 48, 316–323 CrossRef CAS PubMed.
- C. Jacobsen, J. Garside and M. Hoare, Biotechnol. Bioeng., 1998, 57, 666–675 CrossRef CAS PubMed.
- D. Hebel, S. Huber, B. Stanislawski and D. Hekmat, J. Biotechnol., 2013, 166, 206–211 CrossRef CAS PubMed.
- D. Hekmat, M. Huber, C. Lohse, N. von den Eichen and D. Weuster-Botz, Cryst. Growth Des., 2017, 17, 4162–4169 CrossRef CAS.
- P. Neugebauer and J. G. Khinast, Cryst. Growth Des., 2015, 15, 1089–1095 CrossRef CAS PubMed.
- H. Y. Yang, W. Q. Chen, P. Peczulis and J. Y. Y. Heng, Cryst. Growth Des., 2019, 19, 983–991 CrossRef CAS.
- H. Y. Yang, P. Peczulis, P. Inguva, X. Y. Li and J. Y. Y. Heng, Chem. Eng. Res. Des., 2018, 136, 529–535 CrossRef CAS.
- F. Castro, A. Ferreira, J. A. Teixeira and F. Rocha, Cryst. Growth Des., 2018, 18(10), 5940–5946 CrossRef CAS.
- S. Y. Pu and K. Hadinoto, Chem. Eng. Res. Des., 2020, 160, 89–104 CrossRef CAS.
- U. V. Shah, C. Amberg, Y. Diao, Z. Yang and J. Y. Y. Heng, Curr. Opin. Chem. Eng., 2015, 8, 69–75 CrossRef.
- R.-B. Zhou, H.-L. Cao, C.-Y. Zhang and D.-C. Yin, CrystEngComm, 2017, 19, 1143–1155 RSC.
- N. E. Chayen, E. Saridakis, R. El-Bahar and Y. Nemirovsky, J. Mol. Biol., 2001, 312, 591–595 CrossRef CAS PubMed.
- A. Ghatak, G. Rawal and A. Ghatak, Crystals, 2017, 7, 245 CrossRef CAS.
- A. Sengupta Ghatak and A. Ghatak, Cryst. Growth Des., 2016, 16, 5323–5329 CrossRef CAS.
- J. P. Leite, D. Rodrigues, S. Ferreira, F. Figueira, F. A. Almeida Paz and L. Gales, Cryst. Growth Des., 2019, 19, 1610–1615 CrossRef CAS.
- R. dos Santos, M. J. Romão, A. C. A. Roque and A. L. Carvalho, CrystEngComm, 2021, 23, 1083–1090 RSC.
- B. Zhang, A. R. Mei, M. A. Isbell, D. Wang, Y. Wang, S. F. Tan, X. L. Teo, L. Xu, Z. Yang and J. Y. Y. Heng, ACS Appl. Mater. Interfaces, 2018, 10, 44240–44246 CrossRef CAS PubMed.
- F. J. Link and J. Y. Y. Heng, CrystEngComm, 2021, 23, 3951–3960 RSC.
- U. V. Shah, D. R. Williams and J. Y. Y. Heng, Cryst. Growth Des., 2012, 12, 1362–1369 CrossRef CAS.
- U. V. Shah, N. H. Jahn, S. Huang, Z. Yang, D. R. Williams and J. Y. Y. Heng, J. Cryst. Growth, 2017, 469, 42–47 CrossRef CAS.
- W. Chen, T. N. H. Cheng, L. F. Khaw, X. Li, H. Yang, J. Ouyang and J. Y. Y. Heng, Sep. Purif. Technol., 2021, 255, 117384 CrossRef CAS.
- W. Chen, S. J. Park, F. Kong, X. Li, H. Yang and J. Y. Y. Heng, Cryst. Growth Des., 2020, 20, 866–873 CrossRef CAS.
- N. Asherie, C. Ginsberg, S. Blass, A. Greenbaum and S. Knafo, Cryst. Growth Des., 2008, 8, 1815–1817 CrossRef CAS.
- X. Li, W. Chen, H. Yang, Z. Yang and J. Y. Y. Heng, CrystEngComm, 2020, 22, 4566–4572 RSC.
- X. Li and J. Y. Y. Heng, Chem. Eng. Res. Des., 2021, 173, 81–88 CrossRef CAS.
- M. V. Kovalchuk, A. E. Blagov, Y. A. Dyakova, A. Y. Gruzinov, M. A. Marchenkova, G. S. Peters, Y. V. Pisarevsky, V. I. Timofeev and V. V. Volkov, Cryst. Growth Des., 2016, 16, 1792–1797 CrossRef CAS.
Footnote |
| † Electronic supplementary information (ESI) available. See DOI: 10.1039/d1ce00983d |
| This journal is © The Royal Society of Chemistry 2021 |