Crystal structure prediction of energetic materials and a twisted arene with Genarris and GAtor†
Imanuel
Bier‡
a,
Dana
O'Connor‡
a,
Yun-Ting
Hsieh
a,
Wen
Wen
b,
Anna M.
Hiszpanski
 c,
T. Yong-Jin
Han
 c and
Noa
Marom
 *abd
*abd
aDepartment of Materials Science and Engineering, Carnegie Mellon University, Pittsburgh, PA 15213, USA. E-mail: nmarom@andrew.cmu.edu
bDepartment of Chemistry, Carnegie Mellon University, Pittsburgh, PA 15213, USA
cMaterials Science Division, Lawrence Livermore National Laboratory, Livermore, CA 94550, USA
dDepartment of Physics, Carnegie Mellon University, Pittsburgh, PA 15213, USA
First published on 23rd July 2021
Abstract
A molecular crystal structure prediction (CSP) workflow, based on the random structure generator, Genarris, and the genetic algorithm (GA), GAtor, is applied to the energetic materials 2,4,6-trinitrobenzene-1,3,5-triamine (TATB) and 2,4,6-trinitrobenzene-1,3-diamine (DATB), and the chiral arene, 4,5-dimethylphenanthrene. The experimental structures of all three materials are successfully generated multiple times by both Genarris and GAtor, and ranked as the most stable structures by dispersion-inclusive density functional theory (DFT) methods. For 4,5-dimethylphenanthrene the evolutionary niching feature of GAtor helps find the experimental structure by penalizing the fitness of over-sampled regions and steering the GA to an under-explored basin. For DATB, a putative structure with a sheet packing motif, which is associated with reduced sensitivity, is found to be very close in energy to the experimental structure and could be a viable polymorph. Principal component analysis of atom-centered symmetry functions is used to compare the crystal structure landscapes of TATB and DATB. Genarris and GAtor exhibit robust performance for diverse targets with varied intermolecular interactions. This work demonstrates the potential of including CSP as a part of the energetic materials development process.
1 Introduction
Molecular crystals are a class of solids comprised of molecules packed in a periodic lattice. Molecular crystals have a wide array of applications including pharmaceuticals,1,2 organic electronics,3–5 and energetic materials.6–8 Molecular crystals are prone to exhibit polymorphism, the capability to crystallize in multiple distinct structures.9–11 Different polymorphs may be synthesized by a variety of experimental techniques,12,13 such as changing the solvent and crystallization conditions,14–16 tailor-made additives,17–19 solution shearing,20 and nanoscale confinement.21–23Polymorphism can profoundly influence the physical and chemical properties, and hence the functionality of molecular solids. For example, crystal structure may affect the bioavailability24,25 and mechanical properties of pharmaceuticals,26–28 the charge carrier mobility of organic electronics,29–31 and the performance and safety of energetic materials.7,32,33 Examples of known polymorphic energetic materials include 1,3,5,7-tetranitro-1,3,5,7-tetrazoctane (HMX),34 1,3,5-trinitro-1,3,5-triazinane (RDX),35 1,1-diamino-2,2-dinitroethylene (FOX-7),36 and hexanitrohexaazaisowurtzitane (CL-20).37 In both HMX and CL-20, pressure and temperature induced phase changes can impact safety and performance, particularly the detonation power and sensitivity.34,37 Experimental polymorph screening may be costly and time consuming,38,39 and in the case of energetic materials also potentially hazardous.6,40 Computational crystal structure prediction (CSP) techniques can aid in predicting whether or not a molecule may exhibit polymorphism and can aid in discovering new polymorphs with improved properties. To date, relatively few CSP studies have been performed for energetic materials.41–48
CSP aims to find all the possible crystal structures of a given molecule. This challenge is embodied by the CSP blind tests, which have tracked the progress of the field from predicting the crystals structures of small, rigid molecules to those with multiple conformational degrees of freedom.49–54 Pioneering methods for CSP have included grid searches,55,56 random generation,57–60 quasi-random generation,61,62 simulated annealing,63 and evolutionary algorithms.64–68 Molecular crystal structure prediction is challenging because it requires searching a high-dimensional configuration space with high accuracy. The high dimensionality is caused by multiple independent degrees of freedom, including the unit cell lattice parameters and angles, the center of mass positions and orientations of the molecules in the asymmetric unit, and in some cases molecular conformational degrees of freedom. Typical energy differences between polymorphs are within 4–7 kJ mol−1.10,69 Modern quantum mechanical simulations based on dispersion-inclusive density functional theory (DFT) are capable of delivering the required level of accuracy.70–73 However, these simulations have a high computational cost. Therefore, crystal structure prediction requires efficient search algorithms that can converge to the solution with a minimal number of high-cost samples.
To perform CSP, we have developed the GAtor genetic algorithm (GA) code67,68 and its associated random structure generator, Genarris.58,59 GAs are a versatile class of optimization algorithms inspired by the evolutionary principle of survival of the fittest.74–77 GAs are well suited for molecular crystal structure prediction because they are capable of handling complex, multidimensional search spaces. A GA starts from an initial population of structures. The property being optimized is mapped onto a fitness function and structures with higher fitness are assigned a higher probability of selection for mating. Offspring are generated by crossover operators, which combine the structural genes of two parent structures, or mutation operators, which alter selected genes of a single parent. Repeating the cycle of fitness evaluation, selection, and mating propagates structural features associated with high fitness. This continues to convergence, i.e., until no new structures with high fitness are found in many GA cycles. Typically, for the goal of structure prediction, the property being optimized is the total energy. GAs have been used extensively and successfully for structure prediction of inorganic crystals77–83 and molecular crystals.64–68
GAtor has several special features.67 GAtor offers the user a menu of GA options, including two selection schemes (roulette wheel and tournament), two crossover schemes (standard and symmetric), and several mutations. GAtor's breeding operators have been tailored specifically for molecular crystals. They provide a balance between exploration and exploitation by preserving or breaking space group symmetries. GAtor achieves massive parallelization by spawning several GA replicas that run in parallel, only interacting via a shared population of structures, thus eliminating the traditional concept of GA generations. The selection and mating of parent structures from the common population and subsequent local optimization of offspring require no communication between replicas. Processor idle time is avoided by immediately launching a new cycle without waiting for other GA instances to finish. Thus, linear scaling with the number of replicas is achieved, enabling effective utilization of high-performance computing resources. In addition to the energy-based fitness function, GAtor enables multimodal optimization by evolutionary niching, which enhances exploration of under-sampled low-energy regions of the potential energy surface.68 The evolutionary niching feature uses the affinity propagation (AP)84 machine learning algorithm to cluster the population based on structural similarity with respect to a radial symmetry function (RSF) descriptor calculated for each crystal structure.85 The niching fitness function is defined to be inversely proportional to the number of members in each cluster. This increases the probability for selection of distinct crystal structures to help overcome initial pool biases and selection biases, known as evolutionary drift.
To seed the GA, an initial population is generated using Genarris.58,59 Genarris generates random structures with a distribution around a given volume in all space groups compatible with the requested number of molecules per unit cell and the molecular point group symmetry, including space groups with molecules occupying special Wyckoff positions. Once a structure is generated, a three-stage hierarchical structure check procedure detects if any distances between atoms of different molecules are too close to be physically reasonable. Structure generation continues until a user-defined number of structures is reached. The resulting structures consist the “raw” pool. Down-selection from the raw pool may be performed by executing user-defined sequences of clustering and selection steps based on energy and/or diversity considerations. To cluster the population by structural similarity, Genarris uses the affinity propagation machine learning algorithm with the RSF descriptor. MPI-based parallelization facilitates the seamless sequential execution of user-defined workflows that integrate machine learning with electronic structure calculations.
Previously, we have demonstrated the ability of GAtor and Genarris to produce the crystal structures of several past blind test targets in the small rigid molecule category.67,68 Genarris 2.0 has been further tested successfully for benzene and glycine.59 These previous examples possess a variety of common intermolecular interactions including hydrogen bonds, halogen bonds, and π–π interactions. However, GAtor and Genarris have not been tested yet for energetic materials, which are characterized by distinct nitro group interactions, and pack in particularly dense crystal structures. Therefore, we have chosen two energetic targets, shown in Fig. 1. 2,4,6-Trinitrobenzene-1,3,5-triamine (TATB) and 2,4,6-trinitrobenzene-1,3-diamine (DATB) are two well-known, highly insensitive explosives with a similar chemical composition.86–88 Despite this, TATB and DATB pack in completely different motifs. TATB packs in a β-sheet, whereas DATB packs in a herringbone structure. The increased stability of TATB has been attributed to its packing motif. This has attracted interest in the possibility of discovering and synthesizing a β-sheet polymorph of DATB.32,89
 | ||
| Fig. 1 CSP targets: From left to right, 2,4,6-trinitrobenzene-1,3,5-triamine (TATB), 2,4,6-trinitrobenzene-1,3-diamine (DATB), and 4,5-dimethylphenanthrene. | ||
As an additional target, 4,5-dimethylphenanthrene, a polycyclic aromatic hydrocarbon (PAH) with inherent chirality due its twisted backbone, has been chosen. PAHs are commonly used in organic electronic and photovoltaic devices thanks to their electronic and optical properties.90–92 Their crystal structures are characterized by π–π interactions. Planar PAHs often form structures with layered or herringbone packing motifs characterized by intermolecular π–π interactions, similar to those of TATB and DATB.93–95 The twisted backbone of 4,5-dimethylphenanthrene makes it more difficult to pack than planar PAHs. The steric hindrance created by the two methyl groups in the 4,5 positions not only causes the twist in the backbone but may also cause strain.96 Strained ring compounds, are of interest to the field of energetic materials due to predicted high heats of formation.93,97 Furthermore, stereochemistry and regioselectivity may have a critical role in the future development of EMs. For example, regiochemistry can significantly impact the sensitivity of an EM.98–100
For all three materials, GAtor and Genarris successfully produce the known crystal structure multiple times, demonstrating robust performance for diverse targets. For 4,5-dimethylphenanthrene the evolutionary niching feature of GAtor helps find the experimental structure by steering the GA to an under-explored basin. For DATB, a putative structure with a sheet packing motif, which is associated with reduced sensitivity, is found to be very close in energy to the experimental structure and could be a viable polymorph.
An active area of development in the analysis of CSP results is the construction of structure–property landscapes as a means of representing the potential energy surfaces (PES) of molecular crystals.101–103 This can aid in the identification of optimal packing arrangements that correlate with both stable lattice energies and specific target properties. These methods have seen recent advances thanks to the incorporation of high-dimensional descriptors of molecular packing in the solid phase. Such descriptors include radial and angular symmetry functions,85 the smooth overlap of atomic positions,104,105 and the many-body tensor representation.106,107 In this work, representations of the potential energy landscapes of TATB and DATB are computed using principal component analysis (PCA) of RSF descriptors. This approach reveals that the experimentally known polymorph of DATB lies in a narrow energy basin, which makes it more difficult to locate by CSP methods compared to TATB. In addition, it is observed that due to the lack of a third amine group, nitro group interactions become more important for low energy crystal structures of DATB as compared to TATB.
2 Methods
2.1 Computational details
For energy evaluation and geometry relaxation, GAtor and Genarris are interfaced with the electronic structure code FHI-aims.108 All DFT calculations performed within GAtor and Genarris used the Perdew, Burke, and Ernzerhof (PBE)109 generalized gradient approximation paired with the Tkatchenko–Scheffler (TS) pairwise dispersion method.110 For these calculations, lower-level numerical settings were used, which correspond to the light species default settings, with light integration grids and the tier 1 basis sets. A 3 × 3 × 3 k-point grid was used to sample the Brillouin zone. No constraints were applied during local optimization in both Genarris and GAtor, such that unit cell parameters and space group symmetry were allowed to change during geometry relaxation.For each target, Genarris runs were conducted with different values of sr. The parameter sr controls the minimum intermolecular distance that is allowed between atoms of different molecules in the crystal.58,59 All crystal structures generated by Genarris adhere to the equation:
| dij < sr (ri + rj) | (1) |
Our recommended best practice is to run GAtor several times with different GA settings, collect the structures found in all runs, remove duplicates, and perform hierarchical reranking using increasingly accurate DFT methods.67 It has been shown that the choice of DFT functional and dispersion method can significantly affect the stability ranking of putative crystal structures.72,73,112 Therefore, post-processing is a crucial step of the CSP workflow. For each CSP target, the top 25% of structures produced in all GA runs were rerelaxed and reranked using PBE + TS with higher-level numerical settings, which correspond to the tight species default settings and the tier 2 basis sets. Rerelaxation with higher-level numerical settings may cause some structures to relax to the same local minimum. Therefore, duplicates were detected and removed again at this point. Subsequently, the structures were rerelaxed and reranked using PBE paired with the many-body dispersion (MBD) method113,114 and higher-level numerical settings. Following another round of duplicate removal, final reranking was performed for the remaining structures. Single point energy evaluations were performed using the PBE-based hybrid functional (PBE0)115 paired with the MBD dispersion method and higher-level numerical settings. PBE0 + MBD has been shown to provide sufficient accuracy for polymorph ranking.70–73
To identify the most important intermolecular interactions in a given molecular crystal, we have previously developed a method for evaluating the interaction energies of 1D and 2D periodic intermolecular interaction networks.116 Nearest neighbor interactions in the crystal structure are used to construct periodic molecular chains. A unit cell is constructed around each interaction such that the lattice vector(s) in the direction(s) of the interaction are the same as in the bulk crystal and a vacuum of 40 Å is added in the other lattice vector direction(s) in order to isolate specific intermolecular interactions. The k-point grid was defined such that in the direction(s) of the interactions the number of k-points was the nearest integer to 24 divided by the lattice vector length(s). In the direction(s) of vacuum 1 k-point was used. The interaction energy, IE, was calculated using PBE0 + MBD with higher level numerical settings as follows:
| IE = ENetwork − Z × EMolecule | (2) |
2.2 Principal component analysis
Principal component analysis (PCA) of radial symmetry function (RSF) descriptors was used to construct a two-dimensional landscape of TATB and DATB crystal structures in order to identify correlations between their lattice energy and crystal packing. The RSF descriptors were calculated for each relaxed crystal structure produced by GAtor using a cutoff radius of 8 Å. Twelve evenly spaced radial symmetry functions were used for every pairwise combination of elements, centered between 1 Å and 8 Å. The RSF descriptors for each atom in the unit cell were averaged to produced a single real-valued vector describing the average atomic environment of each crystal structure.PCA was used to project the high-dimensional RSF descriptors to two dimensions in order to easily visualize the crystal structure landscape. PCA provides the optimal linear compression of a high-dimensional data matrix to a desired lower dimension, n.117 The principal components are found by calculating the first n eigenvectors that have the largest eigenvalues from the entire data matrix. The projection of each data point to the desired lower dimension is calculated by taking the dot product of the data entry with each eigenvector. The principal components of the RSF descriptors for the TATB and DATB crystal structures were calculated in Python using Sklearn.142 The landscape of the DATB and TATB crystal structures was then correlated with the relative stability, the density, and the frequency of specific intermolecular interactions.
3 Results and discussion
3.1 TATB
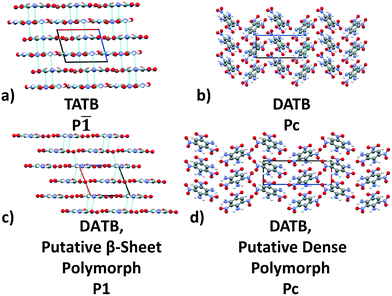
TATB packs in a β-sheet motif with 2 molecules per unit cell in space group P![[1 with combining macron]](https://www.rsc.org/images/entities/char_0031_0304.gif) ,118,119 illustrated in Fig. 2a. The insensitivity of TATB has been ascribed to this packing motif and to the 2D network of hydrogen bonds within the planar sheets.120,121 The experimental structure of TATB is relatively easy to generate using our CSP workflow. As shown in the following, both Genarris and GAtor successfully generate it multiple times with different settings and it is consistently ranked as the most stable.
,118,119 illustrated in Fig. 2a. The insensitivity of TATB has been ascribed to this packing motif and to the 2D network of hydrogen bonds within the planar sheets.120,121 The experimental structure of TATB is relatively easy to generate using our CSP workflow. As shown in the following, both Genarris and GAtor successfully generate it multiple times with different settings and it is consistently ranked as the most stable.
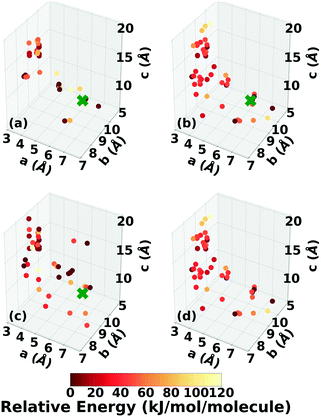
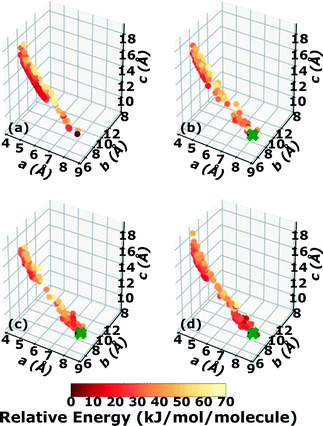
Three Genarris runs were performed for TATB, generating 5000 structures each with sr values of 0.65, 0.75, and 0.85. The mean generated unit cell volume was set to 425 Å3 and the standard deviation was set to 32 Å3. In each run, the raw pool was down-selected using the Robust workflow59 to 50 final structures, which were optimized with PBE + TS and lower-level settings. The volume and space group distributions of the generated structures throughout the workflow are shown in Fig. S1–S3 in the ESI.†Fig. 3 shows the lattice parameter distributions of the final relaxed structures obtained from the three runs. Genarris generated the experimental structure, indicated by a green cross, using all three sr values. The lower sr values of 0.65 and 0.75 led to more sampling around the experimental structure than the higher sr value of 0.85. We attribute this to the dense packing of the experimental structure, which is more likely to be generated with a lower sr value. The GAtor initial pool was constructed by collecting the relaxed structures from all three Genarris runs and then identifying and removing any duplicates. The resulting initial pool, shown in Fig. 3d, contained 65 unique structures. The experimental structure was removed from the initial pool in order to assess GAtor's ability to generate it.
Four GAtor runs were conducted for TATB. The energy-based and niching fitness functions were used with crossover probabilities of 25% and 75%. In all runs, the standard crossover scheme was used initially for approximately 100 GA cycles. When the GA was no longer producing unique low energy structures, the crossover scheme was switched to symmetric crossover to increase exploration. The standard mutation scheme was used for all runs. All runs were terminated when the average energy started to increase, as shown in Fig. S4 in the ESI.†
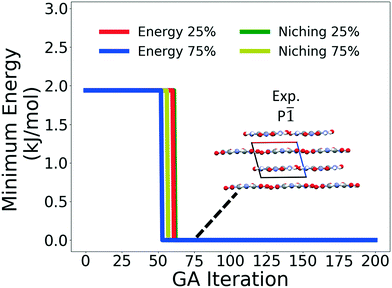
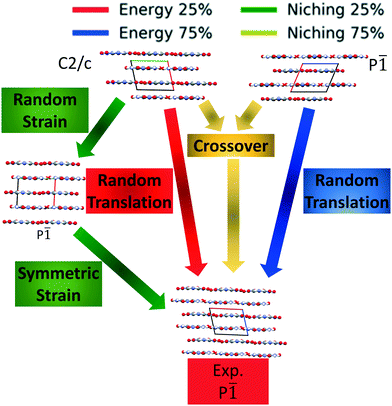
Fig. 4 shows the minimum energy structure as a function of GA iteration for all four runs, referenced to the total energy of the global minimum structure. All four GA runs generated the known experimental structure of TATB fairly quickly. The runs using the energy-based fitness function generated the experimental structure within 61 and 63 GA iterations when crossover probabilities of 25% and 75% were used, respectively. The runs using the niching fitness function generated the experimental structure within 62 and 60 GA iterations using crossover probabilities of 25% and 75%, respectively. The experimental structure was generated via multiple different evolutionary routes, as shown in Fig. 5. The routes start with initial pool structures and follow the crossover and mutation operations that led to the experimental structure. The same two initial pool structures eventually led to the experimental structure across all four GA runs. Both of these initial structures possess a β-sheet packing motif, similar to the experimental structure. However, they have different lattice parameters and/or space groups, which were altered by the GA to produce the experimental structure.
Fig. 6 shows the lattice parameter distributions of the structures generated in the four GA runs. This can provide insight into the configuration space explored with different GA settings, as well as the structure of the potential energy landscape. All four GA runs thoroughly sampled the portion of the configuration space in the bottom right, which contains the experimental structure marked by the green cross. In addition to the experimental structure, this region contains several other low-energy structures with sheet packing motifs. The region in the top left with a relatively small a lattice parameter and relatively large c lattice parameter was heavily explored by the GA runs using evolutionary niching. This region contains structures with a layered packing motif, in which the molecules pack directly on top of each other, as opposed to the staggered packing of the experimental structure. Most of these structures have higher energies.
Fig. 7 shows the results of hierarchical reranking using increasingly accurate DFT functionals and dispersion methods. The experimental structure is consistently ranked as the lowest energy structure by all methods and the ranking of other low-energy structures does not change significantly between methods. Several putative structures are found within the polymorph energy range. These have a sheet packing motif, similar to the experimental structure. Two structures are ranked within 1 kJ mol−1 of the experimental structure. Both of these structures adopt a higher symmetry space group than the experimental structure, C2/m. The structure shown in magenta originates from the region in the top left of the lattice parameter plots in Fig. 6.
For energetic materials, the density is important because it relates to the detonation velocity, load density,122,123 and detonation pressure of the material.124Fig. 8 shows the PBE0 + MBD relative energy as a function of the density. It is observed that the density is strongly correlated with the stability of TATB crystal structures. The experimental structure is the most stable and most dense. Several other putative low-energy, high-density structures are also found. However, no putative structures with a higher density than the experimental structure are found within the typical energy range of molecular crystal polymorphs.
 | ||
| Fig. 8 PBE0 + MBD relative energy as a function of density for TATB structures produced by GAtor. Colored markers correspond to structures shown in the same colors in Fig. 7. | ||
3.2 DATB
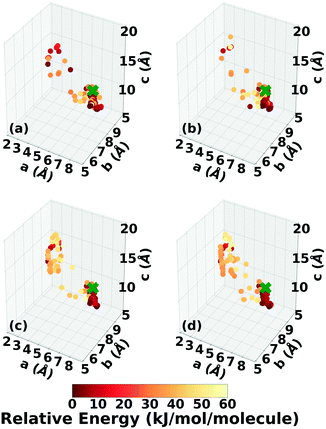
The experimental structure of DATB packs in an edge-to-face herringbone motif, shown in Fig. 2b. DATB crystallizes in space group Pc with 2 molecules per unit cell.120,125 Although the Cambridge Structural Database (CSD)126 only contains one entry for DATB, it has been proposed that there is a pressure-induced phase change of DATB around 6.5 GPa.120 In addition there is interest in finding a polymorph of DATB that exhibits the β-sheet packing motif, associated with the lower sensitivity of TATB.89,121Three Genarris runs were performed for DATB, generating 5000 structures each with sr values of 0.65, 0.75, and 0.85. The mean generated unit cell volume was set to 436 Å3 and the standard deviation was set to 33 Å3. In each run, the raw pool was down-selected using the Robust workflow to 50 final structures, which were optimized using PBE + TS with lower-level settings. The volume and space group distributions of the generated structures throughout the workflow are shown in Fig. S5–S7 in the ESI.†Fig. 9 shows the lattice parameter distributions of the final relaxed structures obtained from the three runs. Genarris generated the experimental structure, indicated by a green cross, using all three sr values. The run with sr of 0.65 generated the most structures in the region of the experimental structure. We attribute this to the dense packing of the experimental structure, which is more likely to be generated with a lower sr value. The GAtor initial pool was constructed by collecting the relaxed structures from all three Genarris runs and then identifying and removing any duplicates. The resulting initial pool, shown in Fig. 9d contained 65 unique structures. The experimental structure was removed from the initial pool in order to assess GAtor's ability to generate it.
Four GAtor runs were conducted for DATB. The energy-based and niching fitness functions were used with crossover probabilities of 25% and 75%. To evaluate the effect of the crossover scheme, the standard crossover scheme was used for both runs with the niching fitness function, whereas the symmetric crossover scheme was used for both runs with the energy-based fitness function. The standard mutation scheme was used for all runs. All runs were terminated when the average energy started increasing, as shown in Fig. S8 in the ESI.†
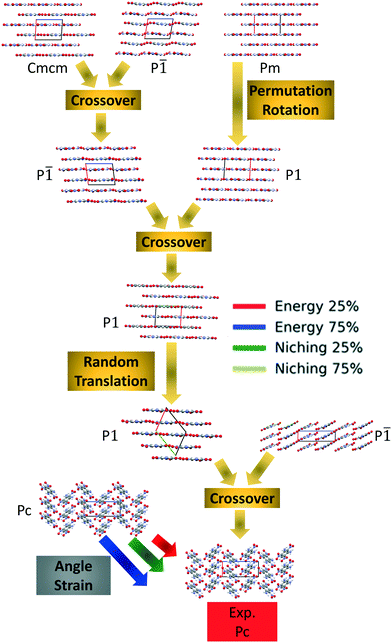
Fig. 10 shows the minimum energy structure as a function of GA iteration for all four runs, referenced to the total energy of the global minimum structure. All four GA runs generated the experimental structure, but not as quickly compared to TATB. Lower crossover probabilities, which correspond to higher mutation probabilities, resulted in faster generation of the experimental structure for both fitness functions, regardless of the crossover scheme used. The run using the niching fitness function with 25% crossover probability generated the experimental structure the fastest at GA iteration 86. The runs using the energy-based fitness function with crossover probabilities of 25% and 75% generated the experimental structure at GA iteration 172 and 222, respectively. The run using the niching fitness with 75% crossover probability generated the experimental structure after 275 GA iterations. This is explained by the evolutionary routes that led to the generation of the experimental structure, shown in Fig. 11. Three out of the four GA runs generated the experimental structure by applying the angle strain mutation to the same initial pool structure. Because mutation was the dominant route for generating the experimental structure of DATB, the lower crossover probability was advantageous in this case. The run that took the longest to generate the experimental structure traversed a more complex evolutionary route, comprising several crossover and mutation steps. This attests to the capability of the GA to generate the same structure in various ways.
The lattice parameter distributions of the structures generated in the four GA runs for DATB, shown in Fig. 12, are very different than those of TATB. For TATB, most of the low-energy structures are concentrated in one main basin, which corresponds to the sheet packing motif, and the experimental structure is found in that basin. For DATB, the low-energy structures produced by the GA are concentrated in two basins. The basin on the bottom right, which corresponds to the sheet packing motif (similar to TATB) is very heavily sampled. The basin in the top left, which corresponds to a relatively even mixture of herringbone, gamma, and sheet packing motifs, is also sampled frequently, particularly by the runs with 25% crossover probability. However, the experimental structure is found in a sparsely sampled region between these two basins, which explains why it took many GA iterations to generate it. Although all four runs explored similar regions of the configuration space, the niching runs generated a few more low-energy structures with herringbone packing motifs in the region between the two basins.
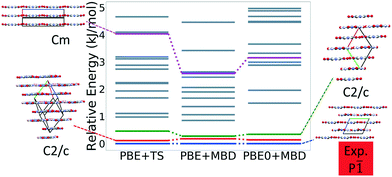
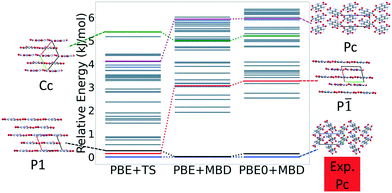
Fig. 13 shows the results of hierarchical reranking using increasingly accurate DFT functionals and dispersion methods for DATB. The experimental structure, shown in blue, is consistently ranked as the lowest energy structure by all methods. In contrast to TATB, significant changes in the relative energies occur upon switching from the TS pairwise dispersion method to the MBD method. A gap opens between the relative energies of the two lowest energy structures and the rest of the structures, which further widens upon switching from the PBE semi-local functional to the PBE0 hybrid functional. In particular, the structure colored in red is very close in energy to the experimental structure with PBE + TS. Switching to the MBD method increases its relative energy by about 3 kJ mol−1. The ranking of structures colored in green and purple is also significantly affected by the choice of dispersion method. The structure colored in purple is destabilized with MBD compared to TS, similar to the structure colored in red. In contrast, the structure colored in green is stabilized by MBD compared to TS. To reveal the origin of these differences we have performed an interaction chain analysis for these three structures, as shown in Fig. 14. The structures colored in red and purple are characterized by a similar hydrogen bonded chain motif between nitro and amino groups along their b and c axes. These interactions are overstabilized by the TS method compared to MBD.127–129 The structure colored in green exhibits π–π stacking along the a axis, which is treated relatively similarly by the three methods. Thus, the origin of the relative energy differences is primarily linked to the different energies of the hydrogen bonds produced by the TS and MBD methods for these three structures. The structure colored in black in Fig. 13 is ranked within less than 1 kJ mol−1 of the experimental structure by all three methods. Interestingly, this structure exhibits a β-sheet packing motif, similar to the experimental structure of TATB, as shown in Fig. 2c. This structure of DATB may be within experimental reach.
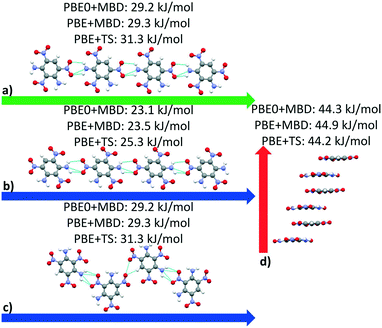 | ||
| Fig. 14 Interaction chain analysis for the structures colored in (a and b) red, (c) purple, and (d) green in Fig. 13. The interactions are shown along the respective lattice vectors, with the a, b, and c lattice vectors colored in red, green, and blue, respectively. Hydrogen bonds are shown in light blue. | ||
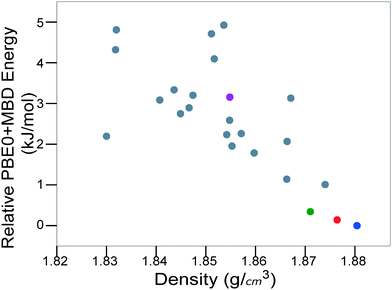
Fig. 15 shows the PBE0 + MBD relative energy as a function of the density for DATB. The putative beta-sheet structure, shown in black, is slightly less dense than the experimental structure, shown in blue. The stability of DATB crystal structures is not as strongly correlated with their density as compared to TATB. For DATB, structures with a higher density than the experimental structure appear within the polymorph energy range. The structures colored in green and purple have a particularly high density. The most dense structure adopts a gamma packing motif with a smaller relative angle between nearest neighbors, shown in Fig. 2d. This motif is between the experimental herringbone structure and the planar beta-sheet structure and possesses a nearly 2D hydrogen bonding network. This structure is also distinct because the nitro groups that are not participating in hydrogen bonding are non-planar to the rest of the molecule. This feature allows the molecules to pack closer together, increasing the density. This structure was generated in the GA run that used the niching fitness function with crossover probability of 75%. It is located in the basin on the top left of Fig. 12d. The putative high-density structures produced by GAtor could be related to a proposed high pressure phase of DATB.120 These high-density structures are within the upper end of the lattice energy range for viable polymorphs, therefore it may be possible to synthesize them by high-pressure crystallization.130–132 However, the explosive nature of EMs may make high pressure experiments too hazardous.133
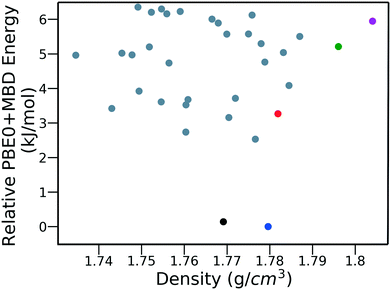 | ||
| Fig. 15 PBE0 + MBD relative energy as a function of density for DATB structures produced by GAtor. Colored markers correspond to structures shown in the same colors in Fig. 13. | ||
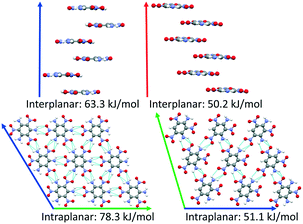
DATB and TATB only differ by one amino group, however this gives rise to markedly different potential energy landscapes. For TATB the sheet packing motif is strongly preferred, whereas for DATB low-energy putative structures comprise both the sheet packing motif and the herringbone packing motif. To elucidate the origin of these differences, we compare the intermolecular interactions in the beta-sheet structure of TATB and the putative beta-sheet structure of DATB. TATB and DATB are capable of forming strong hydrogen bonds between their amino and nitro groups, as well as cofacial π–π interactions. Fig. 16 shows the interplanar and intraplanar interactions in both structures with the corresponding interaction energies, calculated with PBE0 + MBD. For TATB the intraplanar interaction energy of 78.3 kJ mol−1 is significantly stronger than the interplanar interaction energy of 63.3 kJ mol−1. This explains the strong preference of TATB for forming layered structures. For the putative beta-sheet structure of DATB, the intraplanar interaction energy of 51.1 kJ mol−1 is similar to the interplanar interaction energy of 50.2 kJ mol−1. The weaker intraplanar interactions in DATB may be attributed to the missing amino group, which reduces the connectivity of the hydrogen-bonded network compared to TATB. The similar strength of the intraplanar and interplanar interactions in DATB may explain why the low-energy structures of DATB exhibit both layered packing motifs and herringbone packing motifs.
3.3 PCA analysis of DATB and TATB
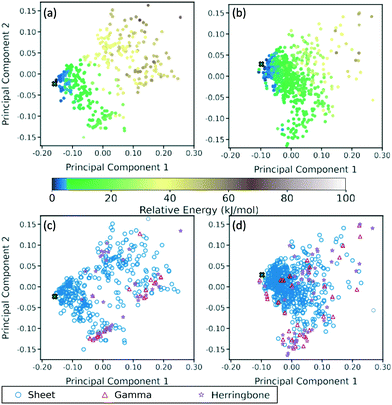
A two-dimensional representation of the TATB and DATB crystal structure landscapes is shown in Fig. 17. The landscapes were constructed by calculating the first two principal components of the RSF descriptors for the TATB and DATB crystal structures generated by GAtor. We note that the plots for TATB and DATB were constructed using the same principal components. This enables quantitative comparison between loci on the crystal structure landscapes. The first two principal components capture nearly 90% of the variance in the data for DATB and 96% for TATB (see Fig. S13 in the ESI†). To provide a chemically meaningful interpretation, correlations between the principal components and different features of the molecular crystals are identified. The first principal component is found to be inversely correlated with the crystal density with an R2 value of 0.75 (see Fig. S15 in the ESI†). The second principal component is found to be inversely correlated with the frequency of C–O interactions, with an R2 of 0.87, and directly correlated with the frequency of O–O interactions, with an R2 of 0.55 (see Fig. S16 in the ESI†). Therefore, structures on the computed crystal landscapes with a more negative second principal component possess more edge-to-face interactions.The correlation of the principal components with the relative energy calculated by PBE + TS using lower-level numerical settings is shown in panels (a) and (b) of Fig. 17. By constructing a linear model based on the two-dimensional crystal landscape, a R2 of 0.92 and 0.88 and a mean absolute error of 3.26 kJ mol−1 and 2.49 kJ mol−1 are achieved for TATB and DATB, respectively (see Fig. S14 in the ESI†). This demonstrates good correlation between the constructed landscapes and the lattice energies. The correlation between the crystal landscapes and crystal packing motif is shown in panels (c) and (d) of Fig. 17 for TATB and DATB, respectively. The gamma and herringbone structures of TATB are concentrated in two main regions, one relatively localized region at the bottom of the distribution in Fig. 17c, which has moderate density (based on the first principal component) and moderate lattice energy (as seen in Fig. 17a), and another relatively dispersed region on the right side of the distribution in Fig. 17c, which is characterized by low density and high lattice energy. The gamma and herringbone structures of DATB are more dispersed throughout the distribution in Fig. 17d with some, including the experimental structure, appearing in the high-density low-energy region on the left side of the distribution. The lowest energy structures of DATB are found to have a somewhat larger second principal component than the low-energy structures of TATB. This region of the distribution is characterized by structures that have a relatively large number of O–O interactions. Because DATB has one less amino group than TATB and is capable of forming fewer hydrogen bonds, the lowest energy DATB crystal structures form a larger number of stabilizing intermolecular nitro group interactions134–137 compared to TATB.
3.4 4,5-Dimethylphenanthrene
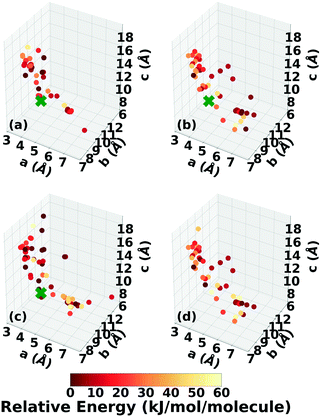
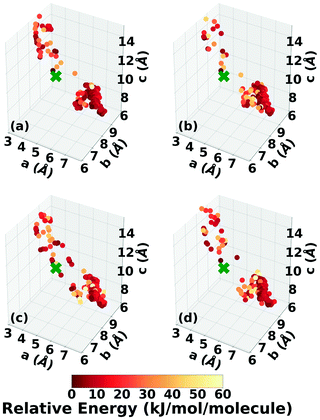
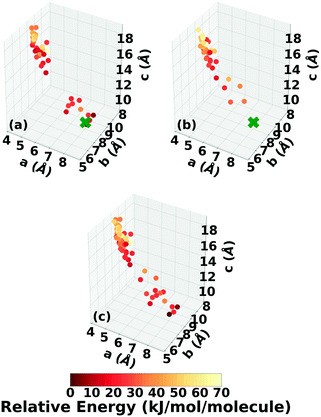
The gas phase molecular geometry of 4,5-dimethylphenanthrene exhibits inherent chirality due to its twisted backbone.96 Other chiral PHAs with twisted backbones, such as [6]helicene and 1-aza[6]-helicene are known to crystallize in either chiral or racemic forms.138,139 4,5-Dimethylphenanthrene is experimentally known to crystallize in the chiral space group P21 with 2 molecules per unit cell.140Two Genarris runs were conducted for 4,5-dimethylphenanthrene, generating 5000 structures each with sr values of 0.70 and 0.75. The mean generated unit cell volume was set to 555 Å3 and the volume standard deviation was set to 36 Å3. Because of this target's inherent chirality, the chiral setting of Genarris were used, such that structures were generated only in compatible chiral space groups, which do not have inversion or mirror symmetry operations. In each run, the raw pool was down-selected using the Robust workflow to 50 final structures, which were optimized with PBE + TS and lower-level settings. The volume and space group distributions of the generated structures throughout the workflow are shown in Fig. S9 and S10 in the ESI.†Fig. 18 shows the lattice parameter distributions of the final relaxed structures obtained from both runs. Genarris generated the experimental structure, indicated by a green cross, using both sr values. The higher sr value of 0.75 resulted in more sampling around the experimental structure than the lower sr value of 0.70. We attribute this to the lower density of 4,5-dimethylphenanthrene compared to the energetic materials studied here. The structures produced by both runs are clustered in a region in the top left whereas the experimental structure is found in a sparsely sampled region on the bottom right. This indicates that the experimental structure has a packing motif that is difficult to generate and may be found in a narrow funnel of the potential energy surface. The GAtor initial pool was constructed by collecting all the relaxed structures from the two Genarris runs and then identifying and removing any duplicates. The resulting initial pool, shown in 18c contained 67 unique structures. The experimental structure was removed from the initial pool in order to assess GAtor's ability to generate it.
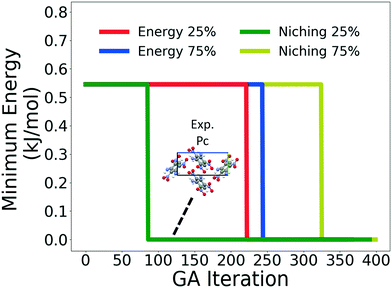
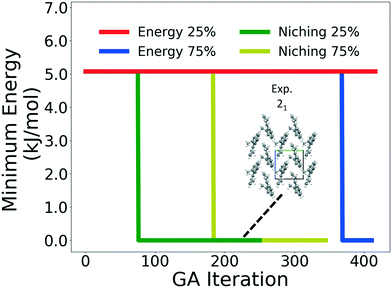
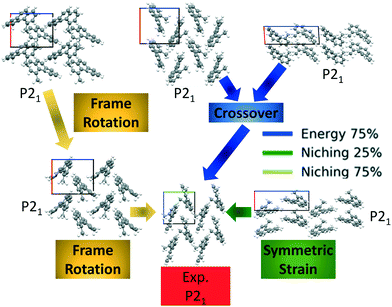
Four GAtor runs were conducted for 4,5-dimethylphenanthrene. The energy-based and niching fitness functions were used with crossover probabilities of 25% and 75%. The standard crossover scheme and standard mutation scheme were used for all runs. All runs were terminated when the average energy started increasing, as shown in Fig. S11 in the ESI.†Fig. 19 shows the minimum energy structure as a function of GA iteration for all four runs, referenced to the total energy of the global minimum structure. The experimental structure of 4,5-dimethylphenanthrene was relatively difficult to generate. We attribute this to the twisted backbone and sterically hindered methyl groups, which make 4,5-dimethylphenanthrene oddly shaped and difficult to pack densely. For this target, the niching fitness function performed significantly better than the traditional energy-based fitness function. The runs using the niching fitness function with crossover probabilities 25% and 75% found the experimental structure at iteration 76 and 184, respectively. The run using the energy-based fitness function with crossover probability of 75% found the experimental structure at iteration 369. The run using the energy-based fitness function with crossover probability of 25% did not generate the experimental structure within 412 iterations. Fig. 20 shows that the experimental structure was generated starting from different initial pool structures, via diverse evolutionary routes, involving both crossover and mutation.
Fig. 21 shows the lattice parameter distributions of the structures generated in the four GA runs. The runs using the energy-based fitness function predominantly sampled the region in the top left, in which most of the initial pool structures were concentrated, rather than the region of the experimental structure on the bottom right. In contrast, the runs using the niching fitness function explored both regions of the configuration space and thoroughly sampled the region of the experimental structure. The case of 4,5-dimethylphenanthrene illustrates the power of the niching fitness function to explore more diversely and overcome initial pool biases. Evolutionary niching can be particularly helpful in accessing narrow funnels of the configuration space that may be rarely sampled by the energy-based fitness function.68
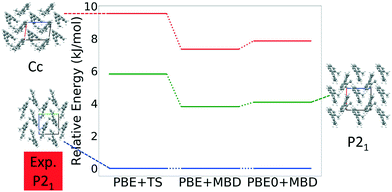
Fig. 22 shows the results of hierarchical reranking using increasingly accurate DFT functionals and dispersion methods. The experimental structure, shown in blue, is consistently ranked as the lowest energy structure by all methods. Furthermore, there is a large gap between the experimental structure and the next lowest energy structure. For 4,5-dimethylphenanthrene, only two putative structures are found within 10 kJ mol−1 from the experimental structure. This is consistent with the lower occurrence of polymorphism in chiral compounds.10 Most low energy structures adopt the same packing motif and space group as the experimental structure. We attribute this to the inherent chirality of the twisted backbone and steric hindrance of the methyl groups, which make it challenging to form diverse packing motifs. Rice et al. found similar results in their study of [6]helicene, where all but one of the eleven lowest energy structures adopted a similar packing motif to the experimentally observed structures.138 The main intermolecular interactions in 4,5-dimethylphenanthrene are methyl–methyl interactions. These weak van der Waals interactions are relatively stabilized with MBD compared to TS.127,141 The experimental structure of 4,5-dimethylphenanthrene has a relatively low density of 1.25 g cm3 due to the inability of this molecule to pack efficiently. The other two low-energy structures have lower densities of 1.23 g cm3 and 1.20 g cm3, respectively (see Fig. S12 in the ESI†). Other relatively dense structures are significantly higher in energy.
4 Conclusion
In summary, a crystal structure prediction workflow, based on the random structure generator, Genarris, and the genetic algorithm, GAtor, has been applied to the energetic materials TATB and DATB and the chiral arene, 4,5-dimethylphenanthrene. The experimental structures of all three materials were successfully generated multiple times by both Genarris and GAtor, and ranked as the most stable structures by dispersion-inclusive DFT methods.For TATB, the potential energy landscape is dominated by a single low-energy basin, which corresponds to layered structures with a sheet packing motif, characterized by a network of strong intralayer hydrogen bonds and weaker interlayer π–π interactions. This makes the experimental structure of TATB relatively easy to generate. For DATB, which has one less amino group than TATB, the intralayer hydrogen bonding interactions are weaker than in TATB, and about as strong as the interlayer π–π interactions. The potential energy landscapes of DATB and TATB are further illuminated by principal component analysis of RSF descriptors. We find that the intermolecular interactions between the nitro groups of DATB are important to stabilizing low energy structures in the absence of the third amino group found in TATB. The experimental crystal structure of DATB is located in a narrow energy basin on the potential energy surface which makes it more difficult to generate by CSP methods compared to TATB. A putative polymorph of DATB with a sheet packing motif, which is desirable because it is associated with lower sensitivity, is found to be very close in energy to the experimental structure. In addition, several structures with higher density than the experimental structure are found in the upper range of known polymorph lattice energy differences. The putative β-sheet polymorph of DATB may be accessible experimentally near ambient conditions, whereas the putative high-density structures may be stabilized under high pressure.
4,5-Dimethylphenanthrene has a twisted backbone, which makes it inherently chiral, and has two methyl groups that cause steric hindrance. This makes 4,5-dimethylphenanthrene non-planar and difficult to pack efficiently. This produces a sparse potential energy landscape with few low-energy minima. Only two putative structures are found within 10 kJ mol−1 of the experimental structure. For this target the evolutionary niching feature of GAtor was particularly helpful in generating the experimental structure. Evolutionary niching helps overcome initial pool biases and selection biases (genetic drift) by penalizing the fitness of over-sampled regions of the potential energy surface and steering the GA to under-sampled regions.
In general, the effect of the choice of exchange–correlation functional and dispersion method on the energy ranking of generated crystal structures is system dependent, owing to the balance between different types of intermolecular interactions that manifest in different packing motifs.67,72,73,112 Of the systems studied here, the energy ranking of TATB and 4,5-dimethylphenanthrene structures is not significantly affected by the choice of DFT method. The relative energies of DATB structures are somewhat more sensitive to the choice of dispersion method because the TS method over-stabilizes the hydrogen bonded chain motif between nitro and amino groups compared to the MBD method. Finite temperature effects may further affect the energy ranking of generated crystal structures.69,72,73
In conclusion, we have demonstrated the ability of Genarris and GAtor to produce the experimental crystal structures of diverse targets. In addition to finding the experimental structure, CSP algorithms can help identify potentially viable polymorphs with desirable properties, such as the putative structure of DATB with the sheet packing motif. Incorporating CSP into the energetic materials development process can help guide experimental efforts in promising directions.
Conflicts of interest
There are no conflicts to declare.Acknowledgements
This work was performed under the auspices of the U.S. Department of Energy by Lawrence Livermore National Laboratory (LLNL) under Contract DE-AC52-07NA27344 and supported by LDRD 19-SI-001. LLNL release number: LLNL-JRNL-823582.Notes and references
- N. Schultheiss and A. Newman, Cryst. Growth Des., 2009, 9, 2950–2967 CrossRef CAS PubMed.
- S. Datta and D. Grant, Nat. Rev. Drug Discovery, 2004, 3, 42–57 CrossRef CAS PubMed.
- C. Reese and Z. Bao, Mater. Today, 2007, 10, 20–27 CrossRef CAS.
- C. Wang, H. Dong, W. Hu, Y. Liu and D. Zhu, Chem. Rev., 2012, 112, 2208–2267 CrossRef CAS.
- J. Mei, Y. Diao, A. L. Appleton, L. Fang and Z. Bao, J. Am. Chem. Soc., 2013, 135, 6724–6746 CrossRef CAS PubMed.
- C. Zhang, F. Jiao and H. Li, Cryst. Growth Des., 2018, 18, 5713–5726 CrossRef CAS.
- L. Fried, M. R. Manaa, P. Pagoria and R. Simpson, Annu. Rev. Mater. Res., 2001, 31, 291–321 CrossRef CAS.
- F. Fabbiani and C. Pulham, Chem. Soc. Rev., 2006, 35, 932–942 RSC.
- J. Bernstein, Polymorphism in Molecular Crystals, Oxford University Press, 2002 Search PubMed.
- A. Cruz-Cabeza, S. Reutzel-Edens and J. Bernstein, Chem. Soc. Rev., 2015, 44, 8619–8635 RSC.
- A. Lee, D. Erdemir and A. Myerson, Annu. Rev. Chem. Biomol. Eng., 2011, 2, 259–280 CrossRef CAS.
- L. Pfund and A. Matzger, ACS Comb. Sci., 2014, 16, 309–313 CrossRef CAS PubMed.
- A. Cote, D. Erdemir, K. Girard, D. Green, M. Lovette, E. Sirota and N. Nere, Cryst. Growth Des., 2020, 20, 7568–7581 CrossRef CAS.
- C.-H. Gu, V. Young Jr and D. J. Grant, J. Pharm. Sci., 2001, 90, 1878–1890 CrossRef CAS.
- E. H. Lee, Asian J. Pharm. Sci., 2014, 9, 163–175 CrossRef.
- N. Giordano, C. Beavers, K. Kamenev, W. Marshall, S. Moggach, S. Patterson, S. Teat, J. Warren, P. Wood and S. Parsons, CrystEngComm, 2019, 21, 4444–4456 RSC.
- I. Weissbuch, M. Lahav and L. Leiserowitz, Adv. Funct. Mater., 2003, 3, 125–150 CAS.
- I. Weissbuch, V. Yu Torbeev, L. Leiserowitz, M. Lahav, I. Weissbuch, V. Yu Torbeev, L. Leiserowitz and M. Lahav, Angew. Chem., Int. Ed., 2005, 44, 3226–3229 CrossRef CAS PubMed.
- V. Y. Torbeev, E. Shavit, I. Weissbuch, L. Leiserowitz and M. Lahav, Cryst. Growth Des., 2005, 5, 2190–2196 CrossRef CAS.
- W. Ma, et al. , Adv. Funct. Mater., 2015, 25, 3131–3137 CrossRef CAS.
- Y. Diao, K. M. Lenn, W.-Y. Lee, M. A. Blood-Forsythe, J. Xu, Y. Mao, Y. Kim, J. A. Reinspach, S. Park, A. Aspuru-Guzik, G. Xue, P. Clancy, Z. Bao and S. C. B. Mannsfeld, J. Am. Chem. Soc., 2014, 136, 17046–17057 CrossRef CAS PubMed.
- Q. Jiang and M. D. Ward, Chem. Soc. Rev., 2014, 43, 2066–2079 RSC.
- K. Zhang, N. Fellah, V. López-Mejías and M. D. Ward, Cryst. Growth Des., 2020, 20, 7098–7103 CrossRef CAS.
- A. Y. Lee, D. Erdemir and A. S. Myerson, Annu. Rev. Chem. Biomol. Eng., 2011, 2, 259–280 CrossRef CAS.
- Polymorphism in the Phar-maceutical Industry, ed. R. Hilfiker and M. V. Raumer, Wiley-VCH Verlag GmbH & Co. KGaA, Weinheim, Germany, 2018 Search PubMed.
- S. P. Velaga, V. R. Vangala, S. Basavoju and D. Boström, Chem. Commun., 2010, 46, 3562–3564 RSC.
- M. K. Mishra and C. C. Sun, Cryst. Growth Des., 2020, 20, 4764–4769 CrossRef CAS.
- C. Wang and C. C. Sun, CrystEngComm, 2020, 22, 1149–1153 RSC.
- P. Zhang, X. Zeng and J. Deng, Jpn. J. Appl. Phys., 2010, 49, 095501–095505 CrossRef.
- H. Chung and Y. Diao, J. Mater. Chem. C, 2016, 4, 3915–3933 RSC.
- E. K. Burnett, J. Ly, M. R. Niazi, L. Zhang, S. R. McCuskey, A. Amassian, D. Smilgies, S. C. B. Mannsfeld and A. L. Briseno, Adv. Mater. Interfaces, 2018, 5, 1701607 CrossRef.
- Y. Wang, Y. Liu, S. Song, Z. Yang, X. Qi, K. Wang, Y. Liu, Q. Zhang and Y. Tian, Nat. Commun., 2018, 9, 2444 CrossRef PubMed.
- G. Liu, R. Gou, H. Li and C. Zhang, Cryst. Growth Des., 2018, 18, 4174–4186 CrossRef CAS.
- L. Zhang, S. Jiang, Y. Yu, Y. Long, H. Zhao, L. Peng and J. Chen, J. Phys. Chem. B, 2016, 120, 11510–11522 CrossRef CAS PubMed.
- R. Podeszwa, B. Rice and K. Szalewciz, Phys. Chem. Chem. Phys., 2009, 11, 5512–5518 RSC.
- J. Evers, T. Klapotke, P. Mayer, G. Oehlinger and J. Welch, Inorg. Chem., 2006, 45, 4996–5007 CrossRef CAS PubMed.
- H. Zhang, Q. Jiao, W. Zhao, X. Guo, D. Li and X. Sun, Appl. Sci., 2020, 10, 2663 CrossRef CAS.
- J. Aaltonen, M. Allesø, S. Mirza, V. Koradia, K. C. Gordon and J. Rantanen, Eur. J. Pharm. Biopharm., 2009, 71, 23–37 CrossRef CAS PubMed.
- A. Newman, Org. Process Res. Dev., 2013, 17, 457–471 CrossRef CAS.
- D. I. Millar, H. E. Maynard-Casely, D. R. Allan, A. S. Cumming, A. R. Lennie, A. J. Mackay, I. D. Oswald, C. C. Tang and C. R. Pulham, CrystEngComm, 2012, 14, 3742–3749 RSC.
- B. M. Rice and D. C. Sorescu, J. Phys. Chem. B, 2004, 108, 17730–17739 CrossRef CAS.
- C. Wei, H. Huang, X. Duan and C. Pei, Propellants, Explos., Pyrotech., 2011, 36, 416–423 CrossRef CAS.
- D. Arputharaj, P. Srinivasan, S. Asthana, R. B. Pawar and P. Kumaradhas, Cent. Eur. J. Energ. Mater., 2012, 9, 201–217 Search PubMed.
- D. V. Khakimov, A. V. Dzyabchenko and T. S. Pivina, Propellants, Explos., Pyrotech., 2019, 44, 1528–1534 CrossRef CAS.
- B. A. Steele, S. M. Clarke, M. P. Kroonblawd, I.-F. W. Kuo, P. F. Pagoria, S. N. Tkachev, J. S. Smith, S. Bastea, L. E. Fried and J. M. Zaug, et al. , Appl. Phys. Lett., 2019, 114, 191901 CrossRef.
- S. Song, Y. Wang, K. Wang, F. Chen and Q. Zhang, J. Mater. Chem. A, 2020, 8, 5975–5985 RSC.
- A. A. Aina, A. J. Misquitta and S. L. Price, J. Chem. Phys., 2021, 154, 094123 CrossRef CAS PubMed.
- C. Wang, Y. Ni, C. Zhang and X. Xue, Cryst. Growth Des., 2021, 21, 3037–3046 CrossRef CAS.
- A. M. Reilly, et al. , Acta Crystallogr., Sect. B: Struct. Sci., Cryst. Eng. Mater., 2016, 72, 439–459 CrossRef CAS PubMed.
- G. M. Day, et al. , Acta Crystallogr., Sect. B: Struct. Sci., 2009, 65, 107–125 CrossRef CAS PubMed.
- G. M. Day, et al. , Acta Crystallogr., Sect. B: Struct. Sci., 2005, 61, 511–527 CrossRef CAS PubMed.
- J. P. Lommerse, W. D. Motherwell, H. L. Ammon, J. D. Dunitz, A. Gavezzotti, D. W. Hofmann, F. J. Leusen, W. T. Mooij, S. L. Price, B. Schweizer, M. U. Schmidt, B. P. Van Eijck, P. Verwer and D. E. Williams, Acta Crystallogr., Sect. B: Struct. Sci., 2000, 56, 697–714 CrossRef CAS.
- W. D. Motherwell, et al. , Acta Crystallogr., Sect. B: Struct. Sci., 2002, 58, 647–661 CrossRef PubMed.
- D. A. Bardwell, et al. , Acta Crystallogr., Sect. B: Struct. Sci., 2011, 67, 535–551 CrossRef CAS.
- J. R. Holden, Z. Du and H. L. Ammon, J. Comput. Chem., 1993, 14, 422–437 CrossRef CAS.
- C. Ouvrard and S. L. Price, Cryst. Growth Des., 2004, 4, 1119–1127 CrossRef CAS.
- M. Neumann, F. Leusen and J. Kendrick, Angew. Chem., 2008, 120, 2461 CrossRef.
- X. Li, F. S. Curtis, T. Rose, C. Schober, A. Vazquez-Mayagoitia, K. Reuter, H. Oberhofer and N. Marom, J. Chem. Phys., 2018, 148, 241701 CrossRef PubMed.
- R. Tom, R. Rose, I. Bier, H. O'Brien, A. Vazquez-Mayagoitia and N. Marom, Comput. Phys. Commun., 2020, 250, 107170 CrossRef CAS.
- C. J. Pickard and R. Needs, J. Phys.: Condens. Matter, 2011, 23, 053201 CrossRef PubMed.
- D. H. Case, J. E. Campbell, P. J. Bygrave and G. M. Day, J. Chem. Theory Comput., 2016, 12, 910–924 CrossRef CAS PubMed.
- P. G. Karamertzanis and C. C. Pantelides, J. Comput. Chem., 2005, 26, 304–324 CrossRef CAS PubMed.
- J. Kendrick, F. J. Leusen, M. A. Neumann and J. van de Streek, Chem. – Eur. J., 2011, 17, 10736–10744 CrossRef CAS.
- Q. Zhu, A. R. Oganov, C. W. Glass and H. T. Stokes, Acta Crystallogr., Sect. B: Struct. Sci., 2012, 68, 215–226 CrossRef CAS.
- A. M. Lund, G. I. Pagola, A. M. Orendt, M. B. Ferraro and J. C. Facelli, Chem. Phys. Lett., 2015, 626, 20–24 CrossRef CAS PubMed.
- M. Pakhnova, I. Kruglov, A. Yanilkin and A. R. Oganov, Phys. Chem. Chem. Phys., 2020, 22, 16822–16830 RSC.
- F. Curtis, X. Li, T. Rose, A. Vazquez-Mayagoitia, S. Bhattacharya, L. Ghiringhelli and N. Marom, J. Chem. Theory Comput., 2018, 14, 2246–2264 CrossRef CAS PubMed.
- F. Curtis, T. Rose and N. Marom, Faraday Discuss., 2018, 211, 61–77 RSC.
- J. Nyman and G. M. Day, CrystEngComm, 2015, 17, 5154–5165 RSC.
- A. M. Reilly and A. Tkatchenko, J. Phys. Chem. Lett., 2013, 4, 1028–1033 CrossRef CAS PubMed.
- N. Marom, R. A. DiStasio, V. Atalla, S. Levchenko, A. M. Reilly, J. R. Chelikowsky, L. Leiserowitz and A. Tkatchenko, Angew. Chem., Int. Ed., 2013, 52, 6629–6632 CrossRef CAS PubMed.
- J. Hoja and A. Tkatchenko, Faraday Discuss., 2018, 211, 253–274 RSC.
- J. Hoja, H. Ko, M. Neumann, R. Car and A. Tkatchenko, Sci. Adv., 2019, 5, eaau3338 CrossRef PubMed.
- R. Johnston, Dalton Trans., 2003, 4193–4207 RSC.
- M. Sierka, Prog. Surf. Sci., 2010, 85, 398 CrossRef CAS.
- S. Heiles and R. Johnston, Int. J. Quantum Chem., 2013, 113, 2091–2109 CrossRef CAS.
- A. Oganov, A. Lyakhov and M. Valle, Acc. Chem. Res., 2011, 44, 227–237 CrossRef CAS PubMed.
- S. Wu, K. Umemoto, M. Ji, C. Z. Wang, K. M. Ho and R. M. Wentzcovitch, Phys. Rev. B: Condens. Matter Mater. Phys., 2011, 83, 184102 CrossRef.
- G. Trimarchi and A. Zunger, Finding the lowest-energy crystal structure starting from randomly selected lattice vectors and atomic positions: First-principles evolutionary study of the Au-Pd, Cd-Pt, Al-Sc, Cu-Pd, Pd-Ti, and Ir-N binary systems, J. Condens. Matter Phys., 2008, 295212 CrossRef.
- G. H. Jóhannesson, T. Bligaard, A. V. Ruban, H. L. Skriver, K. W. Jacobsen and J. K. Nørskov, Phys. Rev. Lett., 2002, 88, 2555061–2555065 CrossRef PubMed.
- Z. Falls, P. Avery, X. Wang, K. P. Hilleke and E. Zurek, J. Phys. Chem. C, 2020, 125, 1601–1620 CrossRef.
- R. Wang, Y. Sun, V. Gvozdetskyi, X. Zhao, F. Zhang, L. H. Xu, J. V. Zaikina, Z. Lin, C. Z. Wang and K. M. Ho, J. Appl. Phys., 2020, 127, 094902 CrossRef CAS.
- T. Yokoyama, S. Ohuchi, E. Igaki, T. Matsui, Y. Kaneko and T. Sasagawa, J. Phys. Chem. Lett., 2021, 12, 2023–2028 CrossRef CAS PubMed.
- B. J. Frey and D. Dueck, Science, 2007, 315, 972–976 CrossRef CAS PubMed.
- J. Behler and M. Parrinello, Phys. Rev. Lett., 2007, 98, 146401 CrossRef PubMed.
- A. Sikder and N. Sikder, J. Hazard. Mater., 2004, 112, 1–15 CrossRef CAS PubMed.
- J. P. Agrawal, Cent. Eur. J. Energ. Mater., 2012, 9, 273–290 CAS.
- P. Pagoria, Propellants, Explos., Pyrotech., 2016, 41, 452–469 CrossRef CAS.
- Y. Kohno, K. Mori, R. Hiyoshi, O. Takahashi and K. Ueda, Chem. Phys., 2016, 472, 163–172 CrossRef CAS.
- J. Fu, G. Kyzas, Z. Cai, E. Deliyanni, W. Liu and D. Zhao, Chem. Eng. J., 2018, 335, 290–300 CrossRef CAS.
- W. Zhao, Q. Tang, H. Chan, J. Xu, K. Lo and Q. Miao, Chem. Commun., 2008, 4324–4326 RSC.
- T. Zhao, Z. Wei, Y. Song, W. Xu, W. Hu and D. Zhu, J. Mater. Chem., 2007, 17, 4377–4381 RSC.
- A. K. Sikder and N. Sikder, J. Hazard. Mater., 2004, 112, 1–15 CrossRef CAS PubMed.
- R. Goddard, M. W. Haenel, W. C. Herndon, C. Krueger and M. Zander, J. Am. Chem. Soc., 1995, 117, 30–41 CrossRef CAS.
- K. E. Maly, Cryst. Growth Des., 2011, 11, 5628–5633 CrossRef CAS.
- F. Imashiro, A. Saika and Z. Tairal, J. Org. Chem., 1987, 52, 5727–5729 CrossRef CAS.
- H. Gao, Q. Zhang and J. M. Shreeve, J. Mater. Chem. A, 2020, 8, 4193–4216 RSC.
- L. Barton, J. Edwards, E. Johnson, E. Bukowski, R. Sausa, E. Byrd, J. Orlicki, J. Sabatini and P. Baran, J. Am. Chem. Soc., 2019, 141, 12531–12535 CrossRef CAS PubMed.
- D. G. Piercey, D. R. Wozniak, B. Salfer, M. Zeller and E. F. Byrd, Org. Lett., 2020, 22, 9114–9117 CrossRef.
- N. Lease, L. M. Kay, G. W. Brown, D. E. Chavez, P. W. Leonard, D. Robbins and V. W. Manner, Cryst. Growth Des., 2019, 19, 6708–6714 CrossRef CAS.
- F. Musil, S. De, J. Yang, J. E. Campbell, G. M. Day and M. Ceriotti, Chem. Sci., 2018, 9, 1289–1300 RSC.
- R. M. Bhardwaj, J. A. McMahon, J. Nyman, L. S. Price, S. Konar, I. D. Oswald, C. R. Pulham, S. L. Price and S. M. Reutzel-Edens, J. Am. Chem. Soc., 2019, 141, 13887–13897 CrossRef CAS.
- C. Zhao, L. Chen, Y. Che, Z. Pang, X. Wu, Y. Lu, H. Liu, G. M. Day and A. I. Cooper, Nat. Commun., 2021, 12, 1–11 CrossRef.
- A. P. Bartók, R. Kondor and G. Csányi, Phys. Rev. B: Condens. Matter Mater. Phys., 2013, 87, 184115 CrossRef.
- S. De, A. P. Bartók, G. Csányi and M. Ceriotti, Phys. Chem. Chem. Phys., 2016, 18, 13754–13769 RSC.
- H. Huo and M. Rupp, 2017, arXiv preprint arXiv:1704.06439.
- L. Himanen, M. O. Jäger, E. V. Morooka, F. F. Canova, Y. S. Ranawat, D. Z. Gao, P. Rinke and A. S. Foster, Comput. Phys. Commun., 2020, 247, 106949 CrossRef CAS.
- V. Blum, R. Gehrke, F. Hanke, P. Havu, V. Havu, X. Ren, K. Reuter and M. Scheffler, Comput. Phys. Commun., 2009, 180, 2175 CrossRef CAS.
- J. Perdew, K. Burke and M. Ernzerhof, Phys. Rev. Lett., 1996, 77, 3865 CrossRef CAS.
- A. Tkatchenko and M. Scheffler, Phys. Rev. Lett., 2009, 102, 73005 CrossRef.
- I. Bier and N. Marom, J. Phys. Chem. A, 2020, 124, 10330–10345 CrossRef CAS.
- F. Curtis, X. Wang and N. Marom, Acta Crystallogr., Sect. B: Struct. Sci., Cryst. Eng. Mater., 2016, 72, 562–570 CrossRef CAS.
- A. Tkatchenko and M. Scheffler, Phys. Rev. Lett., 2012, 108, 236402 CrossRef PubMed.
- A. Ambrosetti, A. M. Reilly, R. A. Distasio and A. Tkatchenko, J. Chem. Phys., 2014, 140, 18A508 CrossRef PubMed.
- C. Adamo and V. Barone, J. Chem. Phys., 1999, 110, 6158 CrossRef CAS.
- S. Yang, I. Bier, W. Wen, J. Zhan, S. Moayedpour and N. Marom, J. Chem. Phys., 2020, 152, 244122 CrossRef CAS PubMed.
- I. Goodfellow, Y. Bengio, A. Courville and Y. Bengio, Deep learning, MIT Press Cambridge, 2016, vol. 1 Search PubMed.
- H. H. Cady and A. C. Larson, Acta Crystallogr., 1965, 18, 485–496 CrossRef CAS.
- J. R. Kolb and H. Rizzo, Propellants, Explos., Pyrotech., 1979, 4, 10–16 CrossRef CAS.
- Y. Kohno, R. Hiyoshi, Y. Yamaguchi, S. Matsumoto, A. Koeski, O. Takahashi, K. Yamasaki and K. Ueda, J. Phys. Chem. A, 2009, 113, 2251–2260 CrossRef PubMed.
- R. Bu, Y. Xiong and C. Zhang, Cryst. Growth Des., 2020, 20, 2824–2841 CrossRef CAS.
- M. J. Kamlet and S. J. Jacobs, J. Chem. Phys., 1968, 48, 23–35 CrossRef CAS.
- X. X. Zhao, S. H. Li, Y. Wang, Y. C. Li, F. Q. Zhao and S. P. Pang, J. Mater. Chem. A, 2016, 4, 5495–5504 RSC.
- W. Zhang, J. Zhang, M. Deng, X. Qi, F. Nie and Q. Zhang, Nat. Commun., 2017, 8, 1–7 CrossRef PubMed.
- J. Holden, Acta Crystallogr., 1967, 22, 545–550 CrossRef CAS.
- C. R. Groom, I. J. Bruno, M. P. Lightfoot and S. C. Ward, Acta Crystallogr., Sect. B: Struct. Sci., Cryst. Eng. Mater., 2016, 72, 171–179 CrossRef CAS PubMed.
- A. Otero-De-la Roza, L. M. LeBlanc and E. R. Johnson, Phys. Chem. Chem. Phys., 2020, 22, 8266–8276 RSC.
- Y. Liu, J. Zhao, F. Li and Z. Chen, J. Comput. Chem., 2013, 34, 121–131 CrossRef CAS PubMed.
- S. J. Cox, M. D. Towler, D. Alfè and A. Michaelides, J. Chem. Phys., 2014, 140, 174703 CrossRef.
- F. P. A. Fabbiani and C. R. Pulham, Chem. Soc. Rev., 2006, 35, 932–942 RSC.
- M. A. Neumann, J. Van De Streek, F. P. Fabbiani, P. Hidber and O. Grassmann, Nat. Commun., 2015, 6, 1–7 Search PubMed.
- S. Sobczak, P. Ratajczyk and A. Katrusiak, Chem. – Eur. J., 2021, 27, 1–6 CrossRef.
- D. I. Millar, W. G. Marshall, I. D. Oswald and C. R. Pulham, High-pressure structural studies of energetic materials, Crystallogr. Rev., 2010, 115–132 CrossRef CAS.
- E. Gagnon, T. Maris, K. E. Maly and J. D. Wuest, Tetrahedron, 2007, 63, 6603–6613 CrossRef CAS.
- A. Sikorski and D. Trzybiński, J. Mol. Struct., 2013, 1049, 90–98 CrossRef CAS.
- M. Daszkiewicz, CrystEngComm, 2013, 15, 10427–10430 RSC.
- A. Bauzá, A. V. Sharko, G. A. Senchyk, E. B. Rusanov, A. Frontera and K. V. Domasevitch, CrystEngComm, 2017, 19, 1933–1937 RSC.
- B. Rice, L. M. Leblanc, A. Otero-De-La-Roza, M. J. Fuchter, E. R. Johnson, J. Nelson and K. E. Jelfs, Nanoscale, 2018, 10, 1865–1876 RSC.
- Y. Yang, B. Rice, X. Shi, J. R. Brandt, R. Correa da Costa, G. J. Hedley, D.-M. Smilgies, J. M. Frost, I. D. W. Samuel, A. Otero-de-la Roza, E. R. Johnson, K. E. Jelfs, J. Nelson, A. J. Campbell and M. J. Fuchter, ACS Nano, 2017, 11, 8329–8338 CrossRef CAS PubMed.
- R. N. Armstrong, H. L. Ammon and J. N. Darnow, J. Am. Chem. Soc., 1987, 109, 2077–2082 CrossRef CAS.
- A. M. Reilly and A. Tkatchenko, Chem. Sci., 2015, 6, 3289–3301 RSC.
- F. Pedregosa, G. Varoquaux, A. Gramfort, V. Michel, B. Thirion, O. Grisel, M. Blondel, P. Prettenhofer, R. Weiss, V. Dubourg, J. Vanderplas, A. Passos, D. Cournapeau, M. Brucher, M. Perrot and E. Duchesnay, Scikit-learn: Machine Learning in {P}ython, J. Mach. Learn. Res., 2011, 12, 2825–2830 Search PubMed.
Footnotes |
| † Electronic supplementary information (ESI) available. See DOI: 10.1039/d1ce00745a |
| ‡ These authors contributed equally. |
| This journal is © The Royal Society of Chemistry 2021 |

