
PtPdCu cubic nanoframes as electrocatalysts for methanol oxidation reaction†
Wen
Liu
,
Peng
Wang
and
Zhenghua
Wang
 *
*
Key Laboratory of Functional Molecular Solids, Ministry of Education, College of Chemistry and Materials Science, Anhui Normal University, Wuhu 241000, P. R. China. E-mail: zhwang@ahnu.edu.cn
First published on 22nd July 2021
Abstract
Due to their unique open structural features, cubic nanoframes have a large specific surface area, which greatly increases their atomic utilization in catalytic reactions. In this study, PtPdCu cubic nanoframes were prepared via a one-pot wet-chemical process. Time-dependent experiments show that the formation of PtPdCu cubic nanoframes experienced a solid to hollow process, and the etching is performed by Br−/O2. As an electrocatalyst for the methanol oxidation reaction, the PtPdCu cubic nanoframes present 2.57 times higher mass activity than commercial Pt/C catalyst. Moreover, the as-prepared PtPdCu cubic nanoframes exhibit superior durability for electrocatalysis. This study provides a facile method for the preparation of cubic nanoframe-structured Pt-alloy electrocatalysts, and demonstrates that the rational design of electrocatalysts with specific morphology and composition can optimize their electrocatalytic performances.
1. Introduction
The large scale use of fossil fuels brings a set of problems including energy shortage, environmental pollution and greenhouse effect, so it is urgent to reduce the reliance on fossil fuels. Direct methanol fuel cell (DMFC) is a type of energy-converting device; it has the advantages of high efficiency, easy refueling and near-zero pollution,1–6 and has drawn a lot of attention over recent years. The performance of DMFCs primarily depends on the electrode catalyst. In DMFCs, the methanol oxidation reaction (MOR) occurs at the anode. Platinum (Pt) is an efficient electrocatalyst for MOR.7–13 Nevertheless, some shortcomings such as high price, scarcity and ease of poisoning of Pt catalysts, have limited the large-scale application in DMFCs. To overcome these shortcomings, researchers have developed some strategies such as the synthesis of Pt alloys and controlling the morphology of Pt and Pt-alloys with large surface-to-volume ratio architectures.14–20 The Pt alloy catalysts have several advantages over single Pt catalysts. First, the utilization ratio of Pt is higher, and the consumption of Pt is reduced. Second, the catalytic activity and CO tolerance ability of Pt alloy catalysts are improved due to synergistic effects.Among the Pt-alloys, the trimetallic Pt-alloys have shown superior electrocatalytic performances over bimetallic Pt-alloys and single Pt catalysts. The trimetallic Pt-alloys have the merits of more adjustable composition and lower Pt consumption.21,22 It has been reported that Pd atoms can help improve the catalytic properties of Pt for MOR through the bifunctional mechanism,23–27 and Cu atoms can enhance the durability for MOR.28 The price of both Pd and Cu is lower than that of Pt. Based on these advantages, trimetallic PtPdCu alloys with morphologies of hexameric octahedral nanocrystals,29 thin films,30 concave nanooctahedra31 and spherical porous networks32 have been applied as electrocatalysts for MOR. We have prepared PtPdCu alloys with morphologies of nanowires, hollow nanocubes and nanodendrites for the electrooxidation of methanol in acidic medium.33,34 These PtPdCu alloy catalysts have shown improved catalytic activity, lower Pt consumption and lower price than single Pt catalysts.
Apart from changing the composition, the design of Pt-alloys with elaborate morphologies can also increase their catalytic activity and durability. Nanoframe is an interesting structure with a highly open architecture, which provides the advantages of large surface area and a three-dimensional accessible surface.35,36 Numerous noble metal nanoframes have been synthesized via sacrificial templates, galvanic replacement, oxidative etching and electrodeposition.37–40 However, some of the above-mentioned preparation methods possess several shortcomings such as complicated procedures and time-consuming. Furthermore, reports on trimetallic Pt-alloy nanoframes are still not common. Therefore, it is still necessary to develop a simple and efficient method to synthesize trimetallic Pt-alloy nanoframes.
Inspired by the merits of trimetallic Pt-alloys and the structural advantages of nanoframes, herein, we report the synthesis of PtPdCu cubic nanoframes by a one-pot wet-chemical method. This method is simple, convenient and fast. The growth process of the nanoframe architecture is studied by a series of control experiments, and the results indicate that the product undergo a morphology change from solid nanocubes to porous nanocubes, and finally nanoframes. The presence of Br− and O2 is essential for the morphological evolution. As expected, the PtPdCu cubic nanoframes show higher electrocatalytic activity and stability than those of commercial Pt/C catalysts towards MOR. The superior electrocatalytic activity of the PtPdCu cubic nanoframes can be explained by the synergistic effect of the metals in the alloy and the open architecture that provide more active sites.
2. Experimental section
2.1 Synthesis of PtPdCu cubic nanoframes
First, 60 mg of cetyltrimethylammonium bromide (CTAB) was added into 3 mL of distilled water in a beaker under continuous stirring. Then, 0.1 mL of KOH (0.18 mol L−1) solution was injected into the solution. After that, 0.2 mL of PdCl2 (0.010 mol L−1), 0.4 mL of CuCl2 (0.020 mol L−1) and 1.0 mL of H2PtCl6 (0.0020 mol L−1) solutions were injected into the solution in sequence. After the solution was further stirred for 10 min, 4.5 mL of ascorbic acid (0.0057 mol L−1) was injected into the solution. Finally, the beaker was heated in a water bath at 90 °C and shook at a constant frequency of 60 rpm for 3 h. The final product was separated from the solution by centrifugation, and then it was washed with distilled water and ethanol for three times each, and vacuum dried.2.2 Characterizations
The characterization methods carried out were X-ray powder diffraction (XRD), X-ray photoelectron spectroscopy (XPS), transmission electron microscopy (TEM), high-resolution TEM (HRTEM), elemental mappings and energy dispersive X-ray spectroscopy (EDS). The instrument model used for XRD was Bruker D8 Advance with Cu Kα radiation, and that for XPS was ESCALab MKII with Al Kα radiation. A JEOL JEM-2100F is used for TEM, HRTEM and EDS characterizations.2.3 Electrochemical measurements
The electrooxidation of methanol was conducted on an electrochemical analyzer (CHI660E, CHI Ins. China) using a 3-electrode system. A saturated calomel electrode (SCE) was used as the reference electrode, a Pt plate was used as the counter electrode, and a catalyst loaded glassy carbon electrode (3 mm in diameter) was used as the working electrode. For preparing the working electrode, the catalyst was dispersed into 390 μL deionized water by sonication to obtain a homogeneous ink, and then 5 μL of the ink was coated on the surface of the glassy carbon electrode; after drying naturally, 5 μL of 0.5% Nafion was dropped onto the catalyst film, and the electrode was dried in air naturally. The electrolyte used was a N2-saturated 0.5 mol L−1 H2SO4 solution. Cyclic voltammetry (CV) was run at a scan rate of 50 mV s−1 in the potential range from −0.2 to 1.0 V (vs. SCE). Chronoamperometry was run at 0.60 V (vs. SCE) for 3600 s.For CO stripping, pure CO gas was introduced into a 0.5 mol L−1 H2SO4 electrolyte for 10 min while holding the working electrode potential at −0.16 V (vs. SCE). Afterwards, N2 gas was introduced for another 15 min to remove CO from the electrolyte. The CO stripping curves were gained by CV at 50 mV s−1 in the potential range from −0.2 to 1.0 V (vs. SCE).
3. Results and discussion
The sample composition is studied via XRD. Fig. 1 presents a typical XRD pattern of the sample. There are four broad peaks at 40.6°, 47.3°, 69.6° and 83.4° present in this pattern. These peaks are characteristic of a face-centered cubic (fcc) phase. No diffraction peaks of monocomponent Pt, Pd and Cu can be seen. The XRD pattern reveals that a single-phase PtPdCu alloy is formed. As compared to the standard XRD patterns of fcc Cu (JCPDS card no. 04-0836), fcc Pd (JCPDS card no. 46-1043) and fcc Pt (JCPDS card no. 04-0802), the diffraction peaks of the PtPdCu alloy are located at higher angles than those of Pt and Pd, but lower angles than those of Cu. This result can be explained by the crystal structure of the PtPdCu alloy. The atomic radius of Cu (0.128 nm) is less than that of Pd (0.137 nm) and Pt (0.139 nm). In the fcc PtPdCu alloy, the Pt, Pd and Cu atoms are randomly packed. The presence of smaller Cu atoms reduces the interplanar distance in the alloy and thus caused the shift of diffraction peaks to higher angles.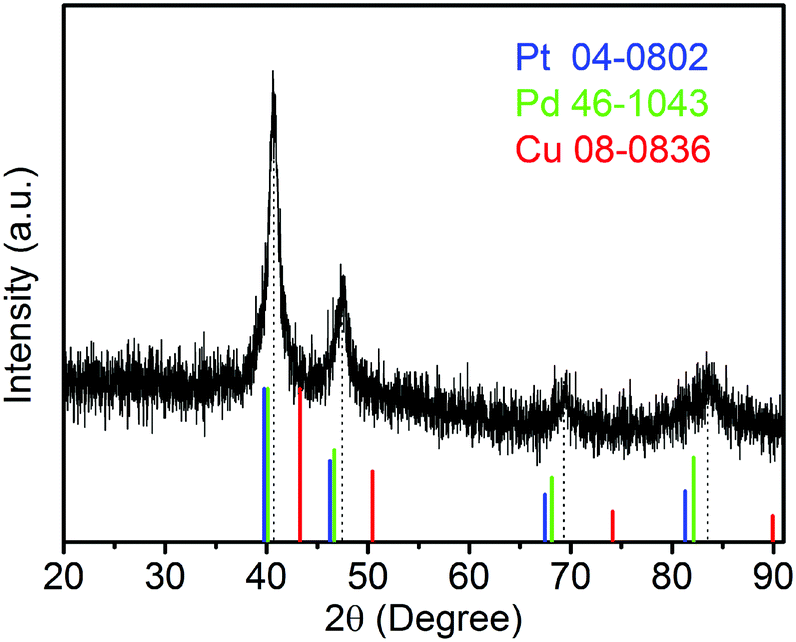 | ||
| Fig. 1 XRD pattern of the PtPdCu cubic nanoframes. | ||
The valence state of each metal element in the PtPdCu alloy is characterized by XPS. Fig. 2a presents a full-scan XPS spectrum of the PtPdCu alloy. The peaks belonging to Pt, Pd and Cu elements can be observed in this spectrum, which implies the co-existence of the three metal elements. Fig. 2b shows the Pt 4f XPS spectrum of the PtPdCu alloy. There are two peaks located at 71.7 and 75.0 eV, and they correspond to Pt 4f7/2 and Pt 4f5/2.41 Furthermore, both the Pt 4f7/2 and Pt 4f5/2 peaks can be deconvoluted into peaks that come from Pt0 and PtII, and Pt0 being the majority. The Pd 3d and Cu 2p XPS spectra are shown in Fig. 2c and d. Similar to that of Pt, Pd and Cu also have two valence states, e.g. zero valence and +2 valence, and the zero valence is the majority.33 The above results show that Pt0, Pd0 and Cu0 are the majority on the surface of the PtPdCu alloy.
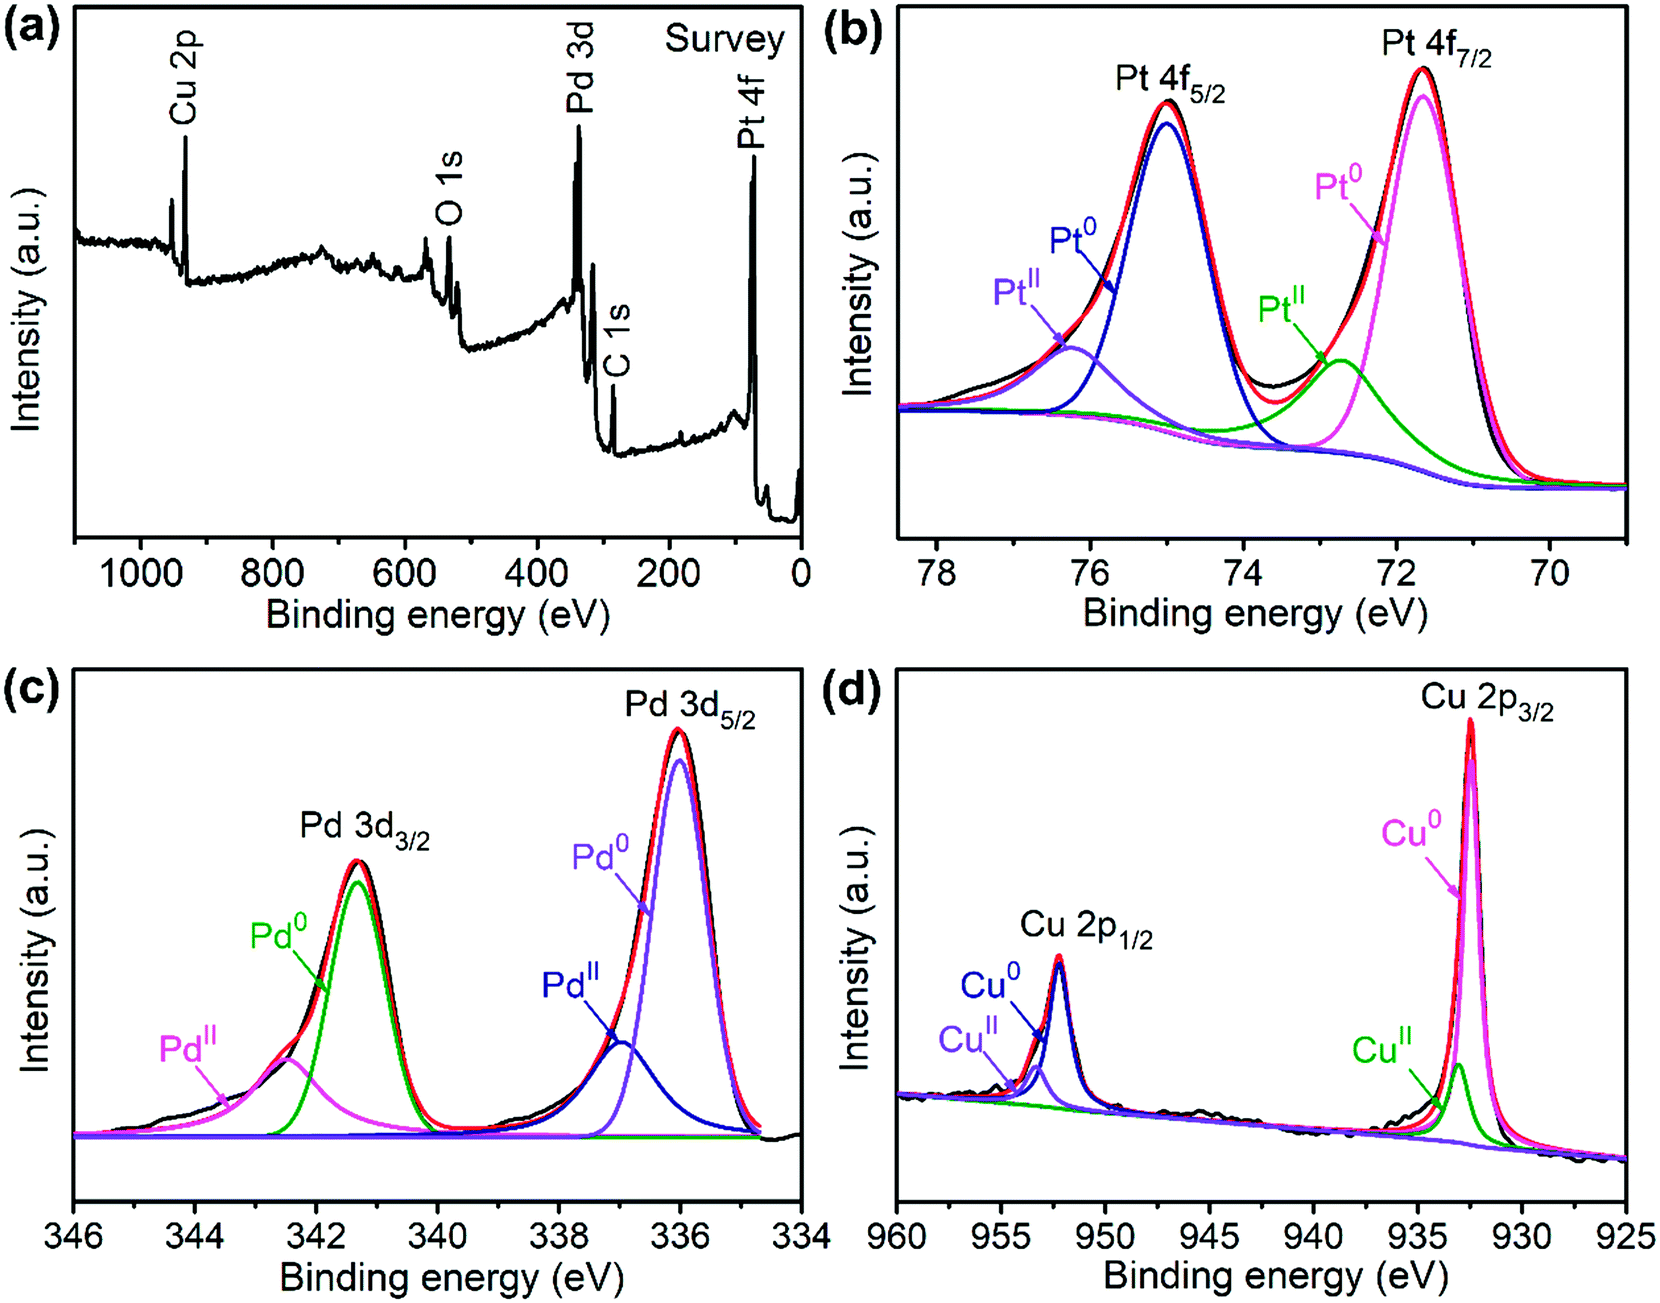 | ||
| Fig. 2 XPS spectra of the PtPdCu cubic nanoframes: (a) survey scan, (b) Pt 4f, (c) Pd 3d and (d) Cu 2p. | ||
The morphology of the PtPdCu sample is observed via TEM. Fig. 3a shows a TEM image of the PtPdCu sample at low magnification, in which numerous uniformly monodispersed cubic nanoframes can be seen. A size distribution histogram of the cubic nanoframes is shown in Fig. 3b. The average diameter of the cubic nanoframes is about 15.8 nm. Fig. 3c shows a magnified view of the PtPdCu cubic nanoframes. The PtPdCu cubic nanoframes are hollow interior. The shell thickness is about 3 nm. Furthermore, the PtPdCu cubic nanoframes constitute of small nanocrystals. Inset in Fig. 3c is a selected-area electron diffraction (SAED) pattern. The diffraction rings further indicate the polycrystalline nature of the PtPdCu cubic nanoframes. The HRTEM image of the PtPdCu cubic nanoframes is shown in Fig. 3d, and the lattice fringes with an interplanar spacing of about 0.182 nm corresponds to the (200) plane of fcc PtPdCu.
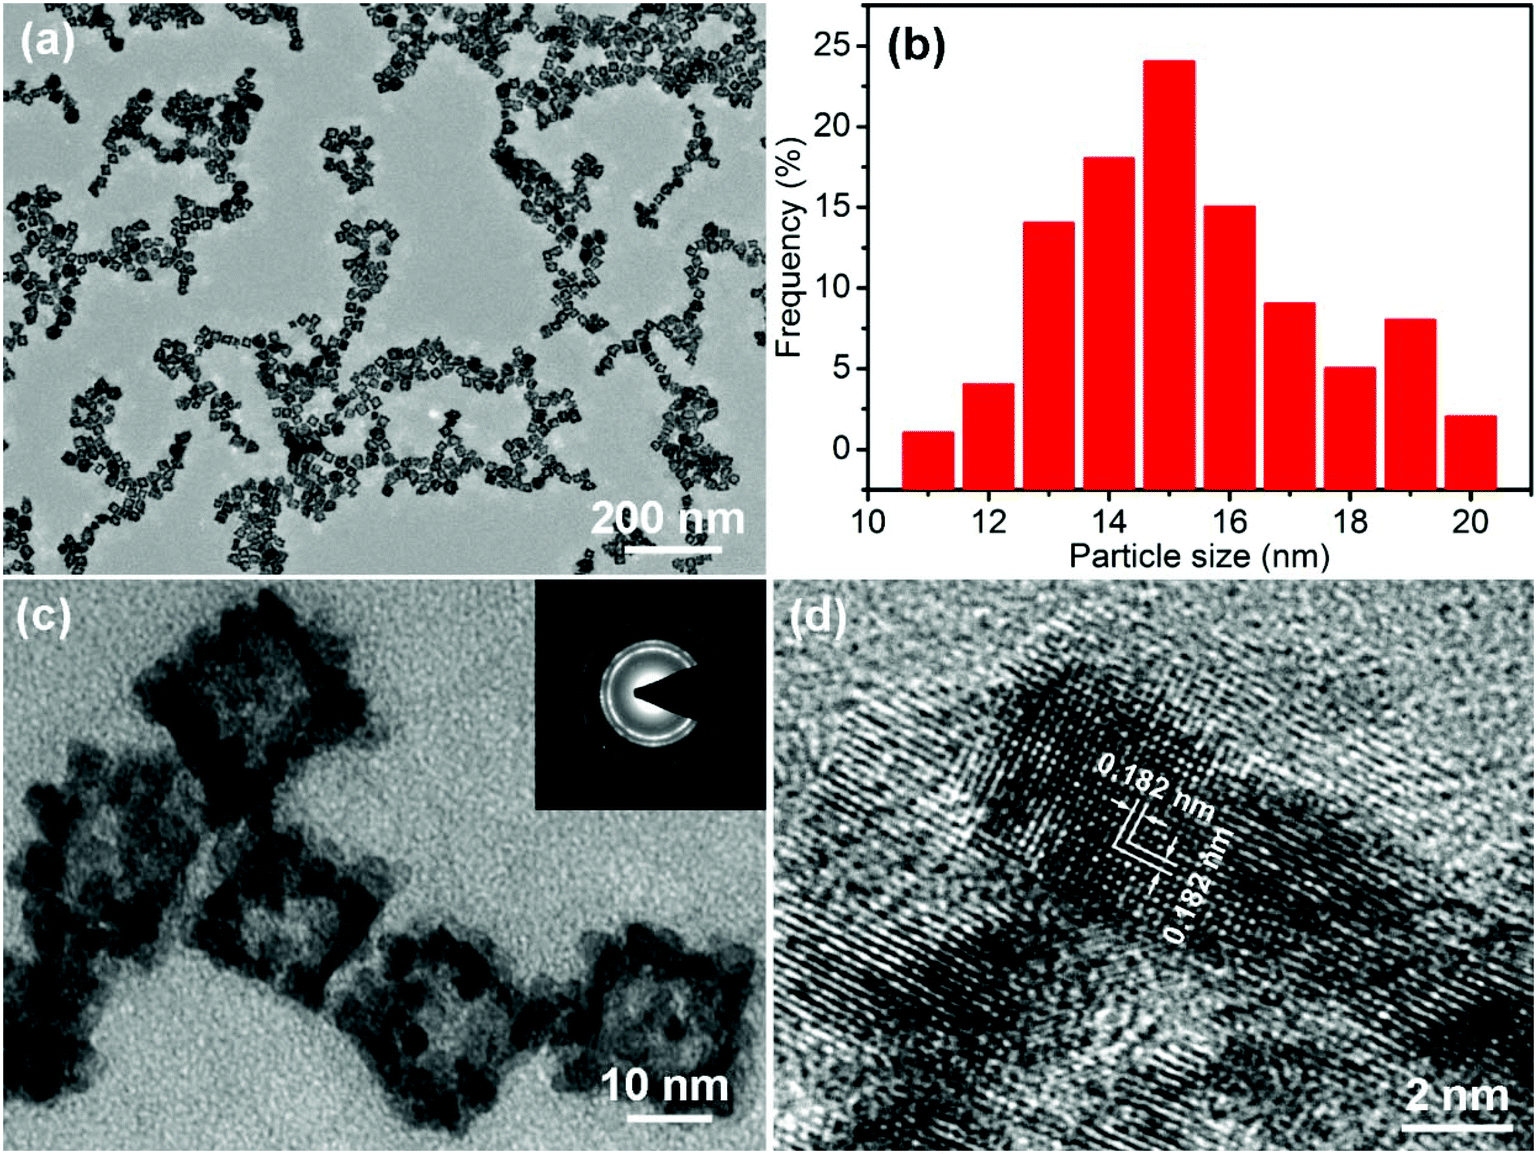 | ||
| Fig. 3 (a and c) TEM images, (b) size distribution histogram and (d) HRTEM image of the PtPdCu cubic nanoframes, inset in (c) is a SAED pattern of the PtPdCu cubic nanoframes. | ||
The distribution of each metal elements in the PtPdCu cubic nanoframes is characterized by EDS elemental mapping and EDS line scan, as shown in Fig. 4. The EDS maps clearly exhibit the uniform distribution of Pt, Pd, and Cu elements in the PtPdCu cubic nanoframes, which proves the formation of a trimetallic alloy. The EDS line scan analysis of the PtPdCu cubic nanoframes also reveals that Pt, Pd, and Cu elements evenly distributed in the PtPdCu cubic nanoframes. The mole percentage of Pt, Pd and Cu measured by EDS is 33%, 21% and 46% in the PtPdCu alloy.
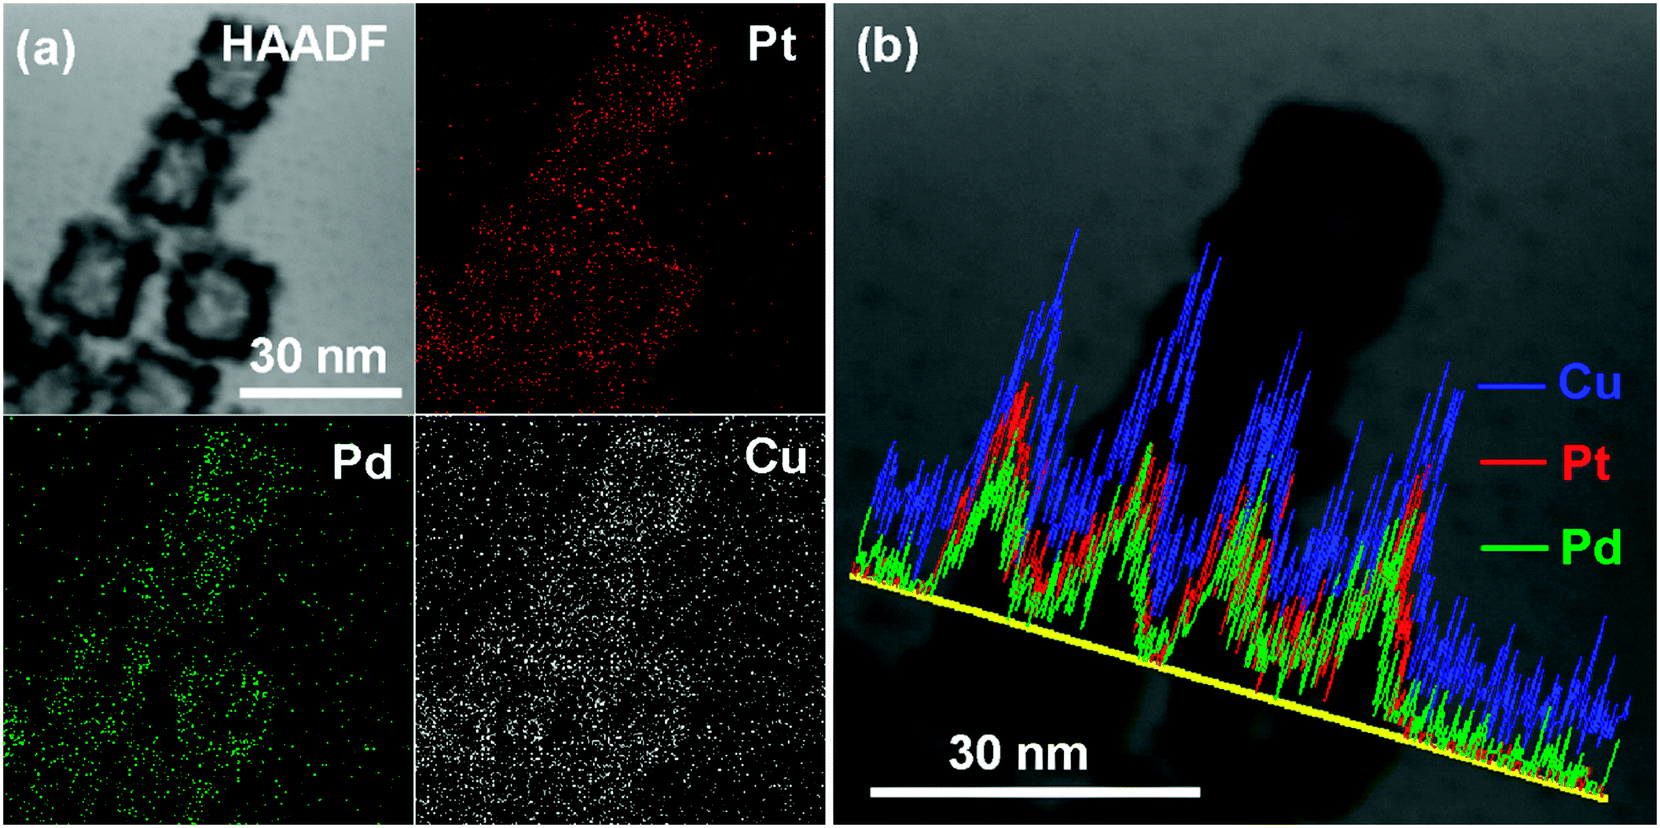 | ||
| Fig. 4 (a) HAADF and elemental mapping images, and (b) EDS line scan image of the PtPdCu cubic nanoframes. | ||
In order to understand the formation of the PtPdCu cubic nanoframes, a set of control experiments are performed. First, the influence of the reaction time on the products is studied. A series of products are prepared by varying the reaction time in the water bath at 90 °C while keep other parameters constant. The morphologies of the products are characterized by TEM, as shown in Fig. 5. The product is solid nanocubes at the initial stage of the reaction, as shown in Fig. 5a. As the reaction proceeds, pores appear on the surface and inside of the nanocubes. These pores gradually expand, and finally form a whole hole inside the nanocubes, resulting in the formation of cubic nanoframes. The mole percentage of Pt, Pd and Cu in the intermediate products is monitored by EDS, and the results reveal that the mole ratio of Pt, Pd and Cu is almost constant (Fig. S1†). The above results show that the PtPdCu cubic nanoframes are formed by etching the initially formed solid nanocubes.
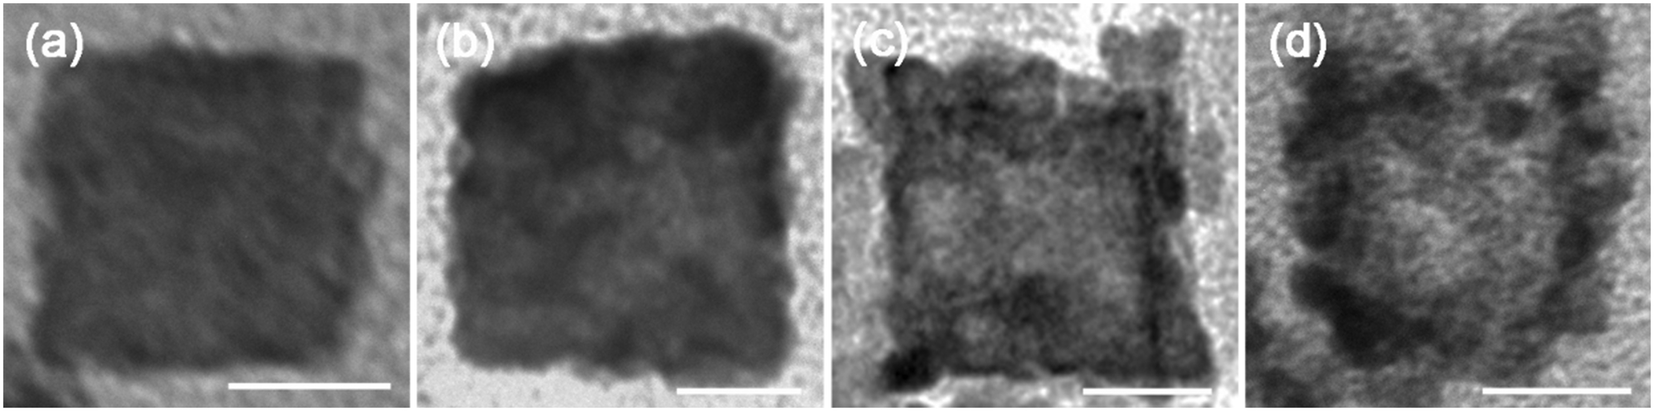 | ||
| Fig. 5 TEM images of the products obtained at different reaction times: (a) 10 min, (b) 50 min, (c) 120 min and (d) 160 min. All the scale bars are 100 nm. | ||
According to literature reports, Br−/O2 can be used as an etchant to prepare Pt–M (M = transition metals) alloys with hollow structure.42,43 During the synthesis of PtPdCu cubic nanoframes, CTAB is added as a morphology control agent, and the synthesis is carried out in air. The coexistence of Br− and O2 in the reacting system can etch the initially formed nanocubes, which result in the formation of PtPdCu cubic nanoframes. In order to verify this idea, some control experiments were performed. When the synthesis is carried out under the protection of N2 gas, the product obtained is solid nanocubes (Fig. S2a†). This result verifies that O2 is essential for the etching process. Furthermore, we have substituted CTAB by cetyltrimethylammonium chloride (CTAC), and the resultant product is mainly composed of solid nanospheres (Fig. S2b†). If CTAC together with KBr is used to replace CTAB, cubic nanoframes can still be obtained (Fig. S2c†). Therefore, the Br− ions also play an important role in the etching process. The above results confirm that Br− and O2 in the reacting system together act as the etchant, which result in the formation of the PtPdCu cubic nanoframes.
The PtPdCu cubic nanoframes were used as electrocatalysts for MOR. First, cyclic voltammograms (CVs) of the PtPdCu cubic nanoframes and the commercial Pt/C in 0.5 mol L−1 N2-saturated H2SO4 solution were obtained, as shown in Fig. 6a. According to the hydrogen adsorption/desorption area in these CVs, the electrochemically active surface area (ECSA) of these catalysts are calculated.44 The ECSA of PtPdCu cubic nanoframes and commercial Pt/C are 51.5 and 48.6 m2 g−1Pt, respectively. The PtPdCu cubic nanoframes have a larger ECSA than the commercial Pt/C. Then, the MOR catalyzed by these catalysts are carried out in 0.5 mol L−1 H2SO4 mixed with 0.5 mol L−1 methanol at ambient temperature. Fig. 6b shows the typical CV profiles of MOR catalyzed by these catalysts. In these CVs, anodic peaks appear in both the forward and the backward scan. The catalytic activities are determined by dividing the peak current in the forward sweep by the total mass of Pt and Pd in the catalysts. The activities of the PtPdCu cubic nanoframes and Pt/C are 455 and 177 mA mg−1Pt+Pd′ respectively. The PtPdCu cubic nanoframes present 2.57 times higher mass activity than the commercial Pt/C. From Fig. 6c, it can be seen that the PtPdCu cubic nanoframes can reach the peak current at a potential of 0.582 V, which is 13 mV lower than the commercial Pt/C. This result indicates that methanol oxidation reactions are facilitated on PtPdCu cubic nanoframes. The electrocatalytic activity of the PtPdCu cubic nanoframes is comparable or even superior to some other recently reported PtPdCu catalysts (Table S1†).29–34
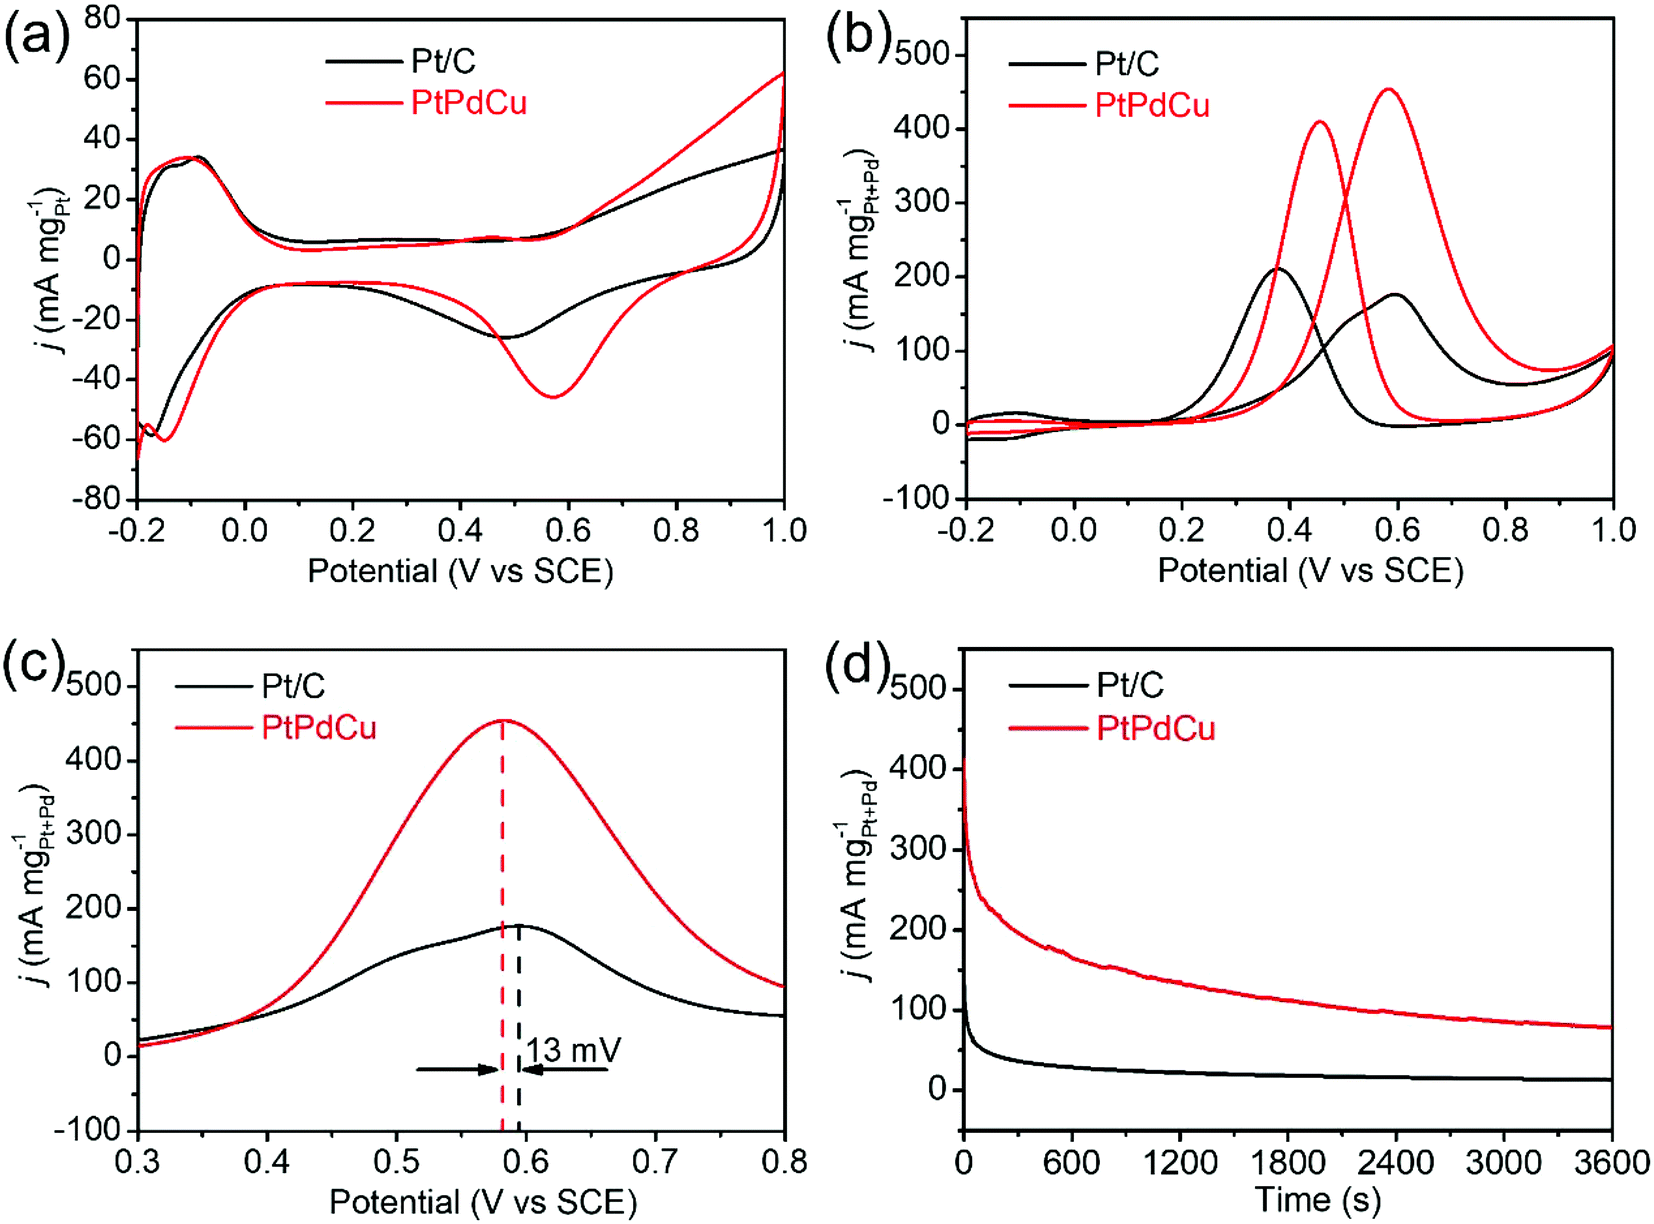 | ||
| Fig. 6 (a and b) CVs of Pt/C and PtPdCu cubic nanoframes in 0.5 mol L−1 N2-saturated H2SO4 solution and in 0.5 mol L−1 H2SO4 mixed with 0.5 mol L−1 methanol; (c) enlarged view of the peaks at 0.6 V in (b); (d) chronoamperograms of Pt/C and PtPdCu cubic nanoframes in 0.5 mol L−1 H2SO4 mixed with 0.5 mol L−1 methanol. | ||
Chronoamperograms of the PtPdCu cubic nanoframes and Pt/C are recorded in 0.5 mol L−1 H2SO4 mixed with 0.5 mol L−1 methanol at ambient temperature. The potential is fixed at 0.60 V and the time span is set at 3600 s. The results are shown in Fig. 6d. Initially, the current densities of both the PtPdCu cubic nanoframes and the Pt/C quickly decrease. The current decrease is caused by the consumption of methanol around the catalyst surface and the poison effect of the intermediates. The current density of the PtPdCu cubic nanoframes is obviously higher than that of the commercial Pt/C, confirming that the PtPdCu cubic nanoframes possess better durability than the commercial Pt/C.
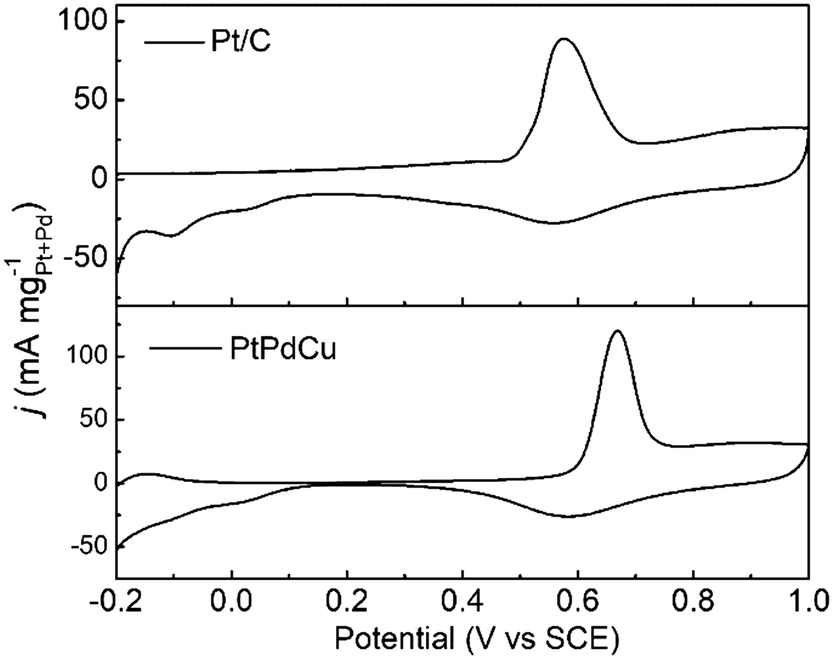
The anti-CO poisoning property of the PtPdCu cubic nanoframes is researched by the CO stripping experiment. Fig. 7 shows the CO stripping profiles of PtPdCu cubic nanoframes and Pt/C catalyst in 0.5 mol L−1 H2SO4 at 50 mV s−1. The CO stripping peak of the PtPdCu cubic nanoframes is at 0.668 V, which is higher than that of Pt/C (0.576 V). Therefore, the anti-CO poisoning ability of the PtPdCu cubic nanoframes is weaker than that of Pt/C. The higher peak potential of CO stripping might be caused by Cu in the PtPdCu cubic nanoframes, as reported in lietrature.34,45
 | ||
| Fig. 7 CO stripping voltammograms of PtPdCu and Pt/C catalysts in 0.5 mol L−1 H2SO4 at 50 mV s−1. | ||
The better electrocatalytic performances of the PtPdCu cubic nanoframes can be explained by the following two aspects: first, the structural advantage of the PtPdCu cubic nanoframes makes them suitable for the electrocatalysis reactions. The open structural feature of the nanoframes is favorable to the diffusion of the electrolyte and enables the full contact between electrolyte and electrocatalyst. Furthermore, the nanoframe morphology can expose numerous active sites for MOR. This viewpoint can be verified by the large ECSA of the PtPdCu cubic nanoframes. Second, the synergistic effect of Pd and Cu can enhance the electrocatalytic activity of Pt. In the PtPdCu cubic nanoframes, the Pt, Pd and Cu atoms are closely contacted with each other. Due to the difference in electronegativity, electron transfer occurs among these metal atoms. The higher electronegativity of Pt makes Pt accept electrons from other metals. As a result, the electronic state of Pt atoms is changed. The change in the electronic state can affect the adsorption of methanol molecule and CO on Pt, and further affect the catalytic activity.46 Furthermore, Pd atoms can help to improve the electrocatalytic activity of Pt by the bifunctional mechanism. It is reported that the Pd atoms can form Pd–OH through the dehydrogenation of water molecule.47 The –OH group can react with CO on Pt and recover the active sites on the catalysts.
4. Conclusions
In summary, we have synthesized PtPdCu cubic nanoframes by a one-pot wet-chemical method. Control experiments revealed that the morphology of the product is solid nanocubes at first, then porous nanocubes, and finally cubic nanoframes. The etching action of Br−/O2 leads to the formation of cubic nanoframes. Impressively, the as-synthesized PtPdCu cubic nanoframes exhibit good electrocatalytic activities towards MOR. The PtPdCu cubic nanoframes present 2.57 times higher mass activity than the Pt/C catalyst. The better electrocatalytic performance of the PtPdCu cubic nanoframes arise from the synergetic effects of the Pt, Pd and Cu atoms, as well as the unique nanoframe structure that possess rich active sites. This study confirms that the rational design of Pt-alloy electrocatalysts with specific morphology and composition can optimize their electrocatalytic performances.Conflicts of interest
There are no conflicts to declare.Acknowledgements
The financial support from the National Natural Science Foundation of China (No. 21671007) is gratefully acknowledged.References
- J. N. Tiwari, R. N. Tiwari, G. Singh and K. S. Kim, Nano Energy, 2013, 2, 553–578 CrossRef CAS.
- M. M. Liu, R. Z. Zhang and W. Chen, Chem. Rev., 2014, 114, 5117–5160 CrossRef CAS.
- A. Kaur, G. Kaur, P. P. Singh and S. Kaushal, Int. J. Hydrogen Energy, 2021, 46, 15820–15849 CrossRef CAS.
- M. S. Alias, S. K. Kamarudin, A. M. Zainoodin and M. S. Masdar, Int. J. Hydrogen Energy, 2020, 45, 19620–19641 CrossRef CAS.
- Z. X. Xia, X. M. Zhang, H. Sun, S. L. Wang and G. Q. Sun, Nano Energy, 2019, 65, 104048 CrossRef CAS.
- E. Antolini, Appl. Catal., B, 2018, 237, 491–503 CrossRef CAS.
- L. Huang, X. P. Zhang, Q. Q. Wang, Y. J. Han, Y. X. Fang and S. J. Dong, J. Am. Chem. Soc., 2018, 140, 1142–1147 CrossRef CAS PubMed.
- T. O. He, W. C. Wang, X. L. Yang, F. L. Shi, Z. Y. Ye, Y. Z. Zheng, F. Li, J. B. Wu, Y. D. Yin and M. S. Jin, ACS Nano, 2021, 15, 7348–7356 CrossRef CAS PubMed.
- H. Y. Li, X. S. Wu, X. L. Tao, Y. Lu and Y. W. Wang, Small, 2020, 16, 2001135 CrossRef CAS PubMed.
- J. P. Zhong, L. L. Li, M. Waqas, X. Q. Wang, Y. J. Fan, J. H. Qi, B. Yang, C. Y. Rong, W. Chen and S. G. Sun, Electrochim. Acta, 2019, 322, 134677 CrossRef CAS.
- P. Li, C. Du, X. H. Gao, Z. H. Zhuang, D. Xiang, C. M. Zhang and W. Chen, Nanoscale, 2020, 12, 13688–13696 RSC.
- J. P. Zhong, C. Hou, L. Li, M. Waqas, Y. J. Fan, X. C. Shen, W. Chen, L. Y. Wan, H. G. Liao and S. G. Sun, J. Catal., 2020, 381, 275–284 CrossRef CAS.
- J. P. Zhong, K. X. Huang, W. T. Xu, H. G. Tang, M. Waqas, Y. J. Fan, R. X. Wang, W. Chen and Y. X. Wang, Chin. J. Catal., 2021, 42, 1205–1215 CrossRef CAS.
- S. Chen, J. K. Zhao, H. Y. Su, H. L. Li, H. L. Wang, Z. P. Hu, J. Bao and J. Zeng, J. Am. Chem. Soc., 2021, 143, 496–503 CrossRef CAS PubMed.
- H. S. Chen, T. M. Benedetti, J. X. Lian, S. Cheong, P. B. O'Mara, K. O. Sulaiman, C. H. W. Kelly, R. W. J. Scott, J. J. Gooding and R. D. Tilley, ACS Catal., 2021, 11, 2235–2243 CrossRef CAS.
- R. Ryoo, J. Kim, C. Jo, S. W. Han, J. C. Kim, H. Park, J. Han, H. S. Shin and J. W. Shin, Nature, 2020, 585, 221–224 CrossRef CAS PubMed.
- X. L. Tian, X. Zhao, Y. Q. Su, L. J. Wang, H. M. Wang, D. Dang, B. Chi, H. F. Liu, E. J. M. Hensen, X. W. Lou and B. Y. Xia, Science, 2019, 366, 850–856 CrossRef CAS PubMed.
- W. J. Lei, M. G. Li, L. He, X. Meng, Z. J. Mu, Y. S. Yu, F. M. Ross and W. W. Yang, Nano Res., 2020, 13, 638–645 CrossRef CAS.
- S. P. Chen, M. F. Li, M. Y. Gao, J. B. Jin, M. A. van Spronsen, M. B. Salmeron and P. D. Yang, Nano Lett., 2020, 20, 1974–1979 CrossRef CAS.
- Z. J. Li, X. Jiang, X. R. Wang, J. R. Hu, Y. Y. Liu, G. T. Fu and Y. W. Tang, Appl. Catal., B, 2020, 277, 119135 CrossRef CAS.
- J. Li, H. M. Yin, X. B. Li, E. Okunishi, Y. L. Shen, J. He, Z. K. Tang, W. X. Wang, E. Yucelen, C. Li, Y. Gong, L. Gu, S. Miao, L. M. Liu, J. Luo and Y. Ding, Nat. Energy, 2017, 2, 17111 CrossRef CAS.
- S. H. Han, H. M. Liu, P. Chen, J. X. Jiang and Y. Chen, Adv. Energy Mater., 2018, 8, 1801326 CrossRef.
- G. L. Zhang, C. D. Huang, R. J. Qin, Z. C. Shao, D. An, W. Zhang and Y. X. Wang, J. Mater. Chem. A, 2015, 3, 5204–5211 RSC.
- H. G. Zhao, W. H. Qi, X. F. Zhou, H. F. Wu and Y. J. Li, Chin. J. Catal., 2018, 39, 342–349 CrossRef CAS.
- Y. Z. Lu, Y. Y. Jiang, H. B. Wu and W. Chen, J. Phys. Chem. C, 2013, 117, 2926–2938 CrossRef CAS.
- Y. Z. Lu, Y. Y. Jiang and W. Chen, Nanoscale, 2014, 6, 3309–3315 RSC.
- P. T. Qiu, S. M. Lian, G. Yang and S. C. Yang, Nano Res., 2017, 10, 1064–1077 CrossRef CAS.
- H. H. Li, Q. Q. Fu, L. Xu, S. Y. Ma, Y. R. Zheng, X. J. Liu and S. H. Yu, Energy Environ. Sci., 2017, 10, 1751–1756 RSC.
- J. J. Mao, T. Cao, Y. J. Chen, Y. Wu, C. Chen, Q. Peng, D. S. Wang and Y. D. Li, Chem. Commun., 2015, 51, 15406–15409 RSC.
- S. Jiang, B. Yi, Q. Zhao, H. Zhang, Y. Su, H. Yu and Z. Shao, RSC Adv., 2016, 6, 82370–82375 RSC.
- M. X. Gong, X. Jiang, T. Y. Xue, T. Y. Shen, L. Xu, D. M. Sun and Y. W. Tang, Catal. Sci. Technol., 2015, 5, 5105–5109 RSC.
- Y. Fan, Y. Zhang, Y. Cui, J. L. Wang, M. M. Wei, X. K. Zhang and W. Li, RSC Adv., 2016, 6, 83373–83379 RSC.
- P. Wang, Y. Y. Zhang, R. Shi and Z. H. Wang, New J. Chem., 2018, 42, 19083–19089 RSC.
- P. Wang, Y. Y. Zhang, R. Shi and Z. H. Wang, ACS Appl. Energy Mater., 2019, 2, 2515–2523 CrossRef CAS.
- A. E. Alvarez, J. M. Sieben and M. M. E. Duarte, ChemCatChem, 2017, 9, 853–861 CrossRef CAS.
- H. Y. Shang, H. Xu, L. J. Jin, C. Y. Chen, C. Wang, T. X. Song and Y. K. Du, J. Colloid Interface Sci., 2019, 556, 360–365 CrossRef CAS.
- S. Ham, H.-J. Jang, Y. Song, K. L. Shuford and S. Park, Angew. Chem., Int. Ed., 2015, 54, 9025–9028 CrossRef CAS.
- B. Y. Xia, H. B. Wu, X. Wang and X. W. Lou, J. Am. Chem. Soc., 2012, 134, 13934–13937 CrossRef CAS.
- A. Oh, H. Baik, D. S. Choi, J. Y. Cheon, B. Kim, H. Kim, S. J. Kwon, S. H. Joo, Y. Jung and K. Lee, ACS Nano, 2015, 9, 2856–2867 CrossRef CAS.
- K. I. Okazaki, J. I. Yasui and T. Torimoto, Chem. Commun., 2009, 2917–2919 RSC.
- S. M. Kim, Y. G. Jo and S. Y. Lee, Electrochim. Acta, 2015, 174, 1244–1252 CrossRef CAS.
- S. Luo and P. K. Shen, ACS Nano, 2017, 11, 11946–11953 CrossRef CAS PubMed.
- H. Shan, W. Gao, Y. Xiong, F. Shi, Y. Yan, Y. Ma, W. Shang, P. Tao, C. Song, T. Deng, H. Zhang, D. Yang, X. Pan and J. Wu, Nat. Commun., 2018, 9, 1011 CrossRef PubMed.
- L. Sun, H. Wang, K. Eid, S. M. Alshehri, V. Malgras, Y. Yamauchi and L. Wang, Electrochim. Acta, 2016, 188, 845–851 CrossRef CAS.
- J. Zheng, D. A. Cullen, R. V. Forest, J. A. Wittkopf, Z. Zhuang, W. Sheng, J. G. Chen and Y. Yan, ACS Catal., 2015, 5, 1468–1474 CrossRef CAS.
- S. T. Chen, S. Thota, X. D. Wang and J. Zhao, J. Mater. Chem. A, 2016, 4, 9038–9043 RSC.
- B. A. Kakade, T. Tamaki, H. Ohashi and T. Yamaguchi, J. Phys. Chem. C, 2012, 116, 7464–7470 CrossRef CAS.
Footnote |
| † Electronic supplementary information (ESI) available. See DOI: 10.1039/d1ce00710f |
| This journal is © The Royal Society of Chemistry 2021 |