DOI:
10.1039/D1CE00270H
(Paper)
CrystEngComm, 2021,
23, 4833-4839
Bridgman growth and characterization of a HoCa4O(BO3)3 crystal
Received
24th February 2021
, Accepted 31st May 2021
First published on 24th June 2021
Abstract
RCa4O(BO3)3 crystals (RCOB, R stands for rare earth elements) are an excellent class of nonlinear optical crystals. Herein, a 1 inch b-direction HoCa4O(BO3)3 (HoCOB) crystal has been grown with the Bridgman method for the first time. The rocking curve was used to study the crystalline quality of the crystal, and the full width at half maximum (FWHM) of the rocking curve was 86.4′′. The monoclinic unit cell parameters were found to be a = 8.0792 Å, b = 16.0114 Å, c = 3.5314 Å, and β = 101.26°, and the unit cell volume was calculated to be 448.0262 Å3. The Raman spectra of HoCOB with different orientations were used to analyze the structure. According to the transmission spectrum of the HoCOB crystal, the wavelength of quasi-parametric chirped-pulse amplification (QPCPA) technology application was set. The wavelengths of the three interacting waves were set at 1060 nm (pump), 2255 nm (signal), and 2000 nm (idler), respectively. In addition, the specific heat, thermal diffusion coefficient, and thermal conductivity of the HoCOB crystal were investigated, and it can satisfy the requirements for QPCPA application.
1. Introduction
Since the advent of the first laser in 1960,1 nonlinear optics has developed rapidly. In order to expand the wavelength range of lasers, the frequency conversion of lasers based on second-harmonic generation (SHG), sum-frequency generation (SFG), difference frequency generation (DFG) or other nonlinear processes has become an important and widely adopted technology.2 A series of nonlinear optical crystals such as LN (LiNbO3),3 BBO (β-BaB2O4), KDP (KH2PO4), LBO (LiB3O5) etc. have been discovered for practical applications. As a new type of nonlinear optical crystal, RCOB series crystals possess outstanding features such as high effective nonlinear coefficient, high laser damage threshold, stable chemical properties, etc.,4–6 and thus have broad application prospects due to their most comprehensive performance. What's more, these crystals have been proven to be used in laser amplification systems such as optical parametric chirped pulse amplification (OPCPA). In 2006, Z. M. Liao et al. have demonstrated OPCPA in YCOB for the first time, producing 40 mJ pulses at 1.053 μm.7 In 2011, a YCOB crystal element with an aperture of 68 mm × 64 mm was used in an OPCPA experiment, and the OPCPA experiment verified that BBO and LBO in low energy OPCPA can be replaced by the YCOB crystal.8 Besides, the piezoelectric properties of these crystals have been studied and become important research objects for high-temperature piezoelectric sensors.9–11
RCOB series crystals belong to a non-centrosymmetric monoclinic system, m point group, and Cm space group. As early as 1974, Kindermann et al.12 studied the rare earth-calcium-borate ternary system and synthesized a series of compounds, but in 1992, Norrestam et al.13 synthesized many borate crystals with trivalent rare earth elements, also known as RCa4O(BO3)3 (RCOB, R = Y, Gd, La, Nd, Sm, etc.). In 1997, GdCOB and YCOB single crystals were finally grown by the Czochralski method, and researchers demonstrated that these crystals have excellent nonlinear optical properties.14,15 Over the next ten years, RCOB crystals16–21 with other components had also been grown.
In 2015, Qian and Zheng et al. proposed the idea of quasi-parametric chirped-pulse amplification (QPCPA) technology based on the OPCPA technology.22 In this new technology, by changing a traditional nonlinear optical crystal to a special crystal, through which the idler light is absorbed to suppress its inverse conversion process, the energy conversion efficiency can approach the theoretically highest value. However, only Sm3+ doped YCOB crystals have thus far been verified for QPCPA application with the wavelength of the three interacting waves being set at 532 nm (pump), 810 nm (signal) and 1550 nm (idler).22–24 Compared with other common nonlinear crystals, such as BBO, LBO, KDP, etc., RCOB crystals have a moderate effective nonlinear coefficient and laser-damaged threshold. In RCOB crystals, the position of R3+ ions can be partially or completely substituted by other rare earth elements, which is not feasible for other commonly used nonlinear crystals. This is beneficial to the application of RCOB crystals to the QPCPA system. Besides these features, RCOB crystals also have the following advantages: (1) a wider transmittance band of RCOB than those of BBO, LBO or KDP, etc.; (2) a shorter crystal growth cycle; (3) stable physical and chemical properties and being not deliquescent.
As one type of popular rare earth ion, Ho3+ is mainly used in solid laser materials. For example, YAG materials doped with Ho3+ ions can emit 2.09–2.12 μm of continuous tunable laser light, which is an ideal surgical laser source;25,26 from a high-power Ho:YAG laser in-band pumped by a Tm-doped fiber laser, the highest output power of 142.2 W was directly generated in the 2.1 μm spectral region;27 holmium laser glass, like neodymium glass, is also an important solid laser material with a large output energy and high output power;28 Ho ion-doped LN (LiNbO3) and LT (LiTaO3) optical superlattice materials have excellent nonlinear optical properties and are expected to play an important role in many fields such as laser medical treatment and optical communication.29–31
In 2006, Nakao et al. reported the growth of a series of crystals including HoCOB, NdCOB and PrCOB.32 So far, there has been no report on detailed research on the HoCOB crystal. In this paper, we report the first successful growth of a HoCOB crystal by the Bridgman method. Besides, the structure and thermal and optical properties of the HoCOB crystal are studied. Furthermore, the application wavelength of the HoCOB crystal has been set for QPCPA application.
2. Experiment
A polycrystalline precursor was synthesized by using CaCO3 (4N), H3BO3 (4N), and Ho2O3 (4N) as raw materials. Ho2O3 was pre-treated by sintering at 1000 °C for 12 h and then dried at 150 °C for 12 h to get rid of moisture before use. CaCO3 was also dried at 150 °C for 12 h before use. The three raw materials were mixed at the stoichiometric ratio of CaCO3![[thin space (1/6-em)]](https://www.rsc.org/images/entities/char_2009.gif) :H3BO3:Ho2O3 = 8:6:1, with the addition of an extra 1 mol% H3BO3 to compensate the volatilization of H3BO3 during the crystal growth. The above complex powder was fully mixed in a grinding miller for 24 h. The obtained uniformly mixed powder was then subjected to a high temperature solid-state reaction at 1150 °C for 24 h to prepare the HoCOB polycrystalline precursor. The reaction equation is as follows.
:H3BO3:Ho2O3 = 8:6:1, with the addition of an extra 1 mol% H3BO3 to compensate the volatilization of H3BO3 during the crystal growth. The above complex powder was fully mixed in a grinding miller for 24 h. The obtained uniformly mixed powder was then subjected to a high temperature solid-state reaction at 1150 °C for 24 h to prepare the HoCOB polycrystalline precursor. The reaction equation is as follows.| | | Ho2O3 + 8CaCO3 + 6H3BO3 → 2HoCa4O(BO3)3 + 8CO2↑ + 9H2O↑ | (1) |
Since the polycrystalline precursor usually contains many impurities, it was further subjected to a recrystallization process with the Bridgman method, and high-purity crystal grains were selected to be used for the final crystal growth.
Both the Czochralski technique and the Bridgman method are commonly being used to grow RCOB crystals. The Bridgman method has the following advantages: (1) the cost of the furnace for the Bridgman method is cheaper than that for the Czochralski method; (2) the Bridgman method has a higher efficiency for crystal growth compared with the Czochralski technique because the Bridgman method allows the use of multiple crucibles for growing several crystals at the same time, which is more conducive to the realization of industrialized production. Due to the above reasons, we chose the Bridgman method to grow a HoCOB crystal. A self-designed vertical Bridgman furnace was used to grow HoCOB single crystals. MoSi2 bars were used as heating elements. Four MoSi2 bars were evenly distributed in the furnace wall, so that the furnace cavity could be divided into three temperature zones in the vertical direction, namely the high temperature zone, gradient zone, and low temperature zone. The three temperature zones were adjusted according to the requirements of the crystal growth. The dimensions of the cylindrical platinum crucible used in the crystal growth were r = Ø25–30 mm and h = 200–240 mm. The selected seed crystal had the crystallographic direction [010], and the length was about 10 mm. The crucible descended at a rate of 0.3 mm h−1 during the crystal growth process, with an automatic lowering apparatus controlled with a computer. The crystal growth process lasted for 10–15 days, and the cooling process was carried out at a rate of about 30–60 °C h−1.
The crystal finally went through the orientation of crystal planes followed by the cutting and polishing process. Since the HoCOB crystal doesn't have exact structure data, the orientation process of the HoCOB crystal was based on the orientation data of the YCOB crystal. The relationship between the crystal and optical axes of YOCB is shown in Fig. 1.
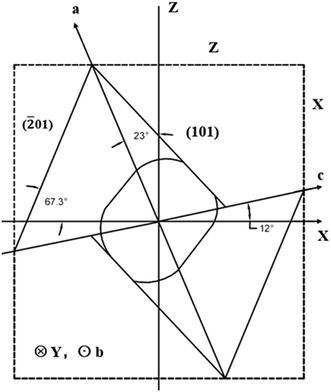 |
| | Fig. 1 Relationship between the crystal axes (a, b, c) and the optical axes (X, Y, Z) of the YCOB crystal. | |
X-ray powder diffraction (XRPD) was used to investigate the phase composition of the obtained HoCOB crystal on a Rigaku D/max 2550 V diffractometer, and lattice parameters were calculated. A series of wafers were cut, polished, and used for testing. The X-ray diffraction rocking curve was measured with a D8 Discover Davinci high resolution X-ray diffractometer. Raman spectra were obtained by using 473 nm radiation from an Ar-ion laser, rather than the commonly used 514 nm radiation which could cause the fluorescence of the crystal, resulting in strong noise interference in the Raman spectra. The specific heat was determined on an MHTC96 high-temperature specific heat instrument, and the sample size was 4 mm × 4 mm × 0.5 mm. The thermal diffusion coefficient was measured on a TA DLF2800 high-temperature laser thermal instrument, and the sample size was 10 mm × 10 mm × 1 mm.
3. Results and discussion
3.1 Crystal growth
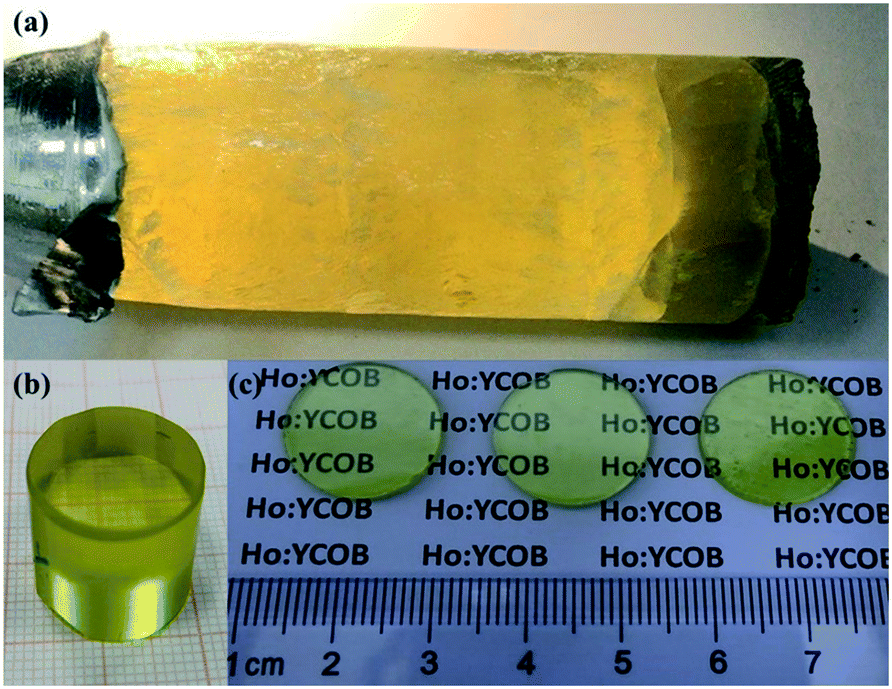
The as-grown HoCOB crystal appears yellow, as shown in Fig. 2a. A He–Ne laser beam was used to examine the optical scattering inside the crystal, and a subtle scattered light path was observed at the bottom of the HoCOB crystal, indicating the existence of defects inside the crystal. The top part of the HoCOB crystal was transparent without an inclusion defect, and thus was selected for the subsequent process. The selected part was cut into a cylinder followed by rounding and polishing (Fig. 2b) and then further sliced into wafers (Fig. 2c). Several wafers were processed for subsequent property testing. The X-ray diffraction rocking curve was measured to precisely examine the crystalline quality. As shown in Fig. 3, the full width at half maximum (FWHM) value of the [010] oriented crystal wafer is 86.4′′. Owing to the lower temperature gradient for the crystal growth with the Bridgman method, the driving force for crystal growth is not enough, resulting in poor crystallinity. The diffraction peak is wide and asymmetric, and a shoulder peak exists at the low-angle side of the rocking curve, which indicates that there are a lot of crystal defects such as vacancies and dislocations. The crystal lattice will thus deviate from the ideal situation due to the existence of defects.
 |
| | Fig. 2 Photographs of (a) the as-grown 1 inch HoCOB crystal, (b) polished HoCOB cylinder, and (c) polished HoCOB wafers with [010] orientation. | |
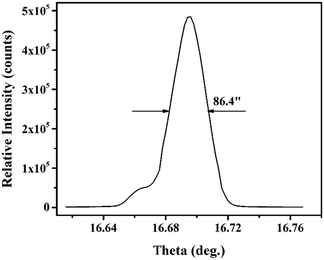 |
| | Fig. 3 X-ray diffraction rocking curve from a typical [010] oriented HoCOB crystal wafer. | |
3.2 Structure characterization
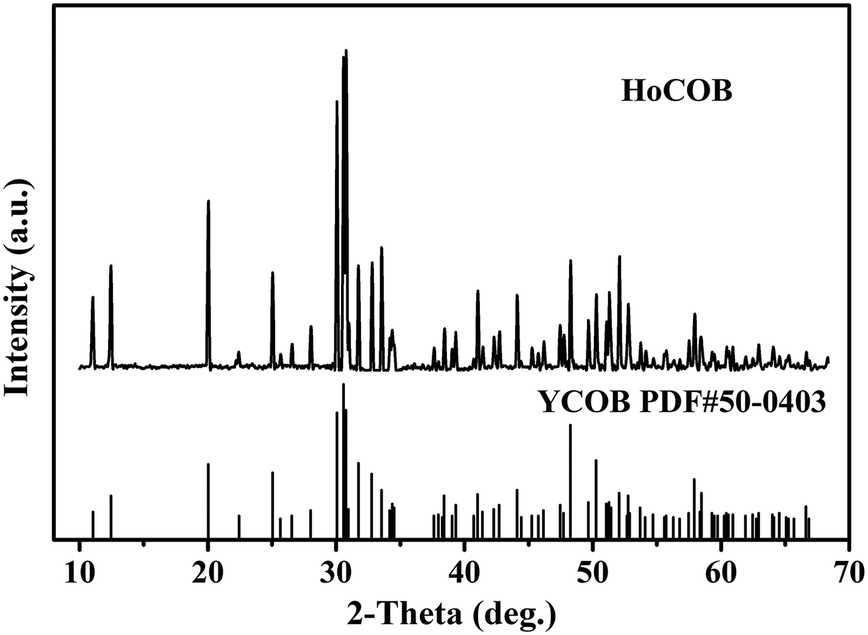
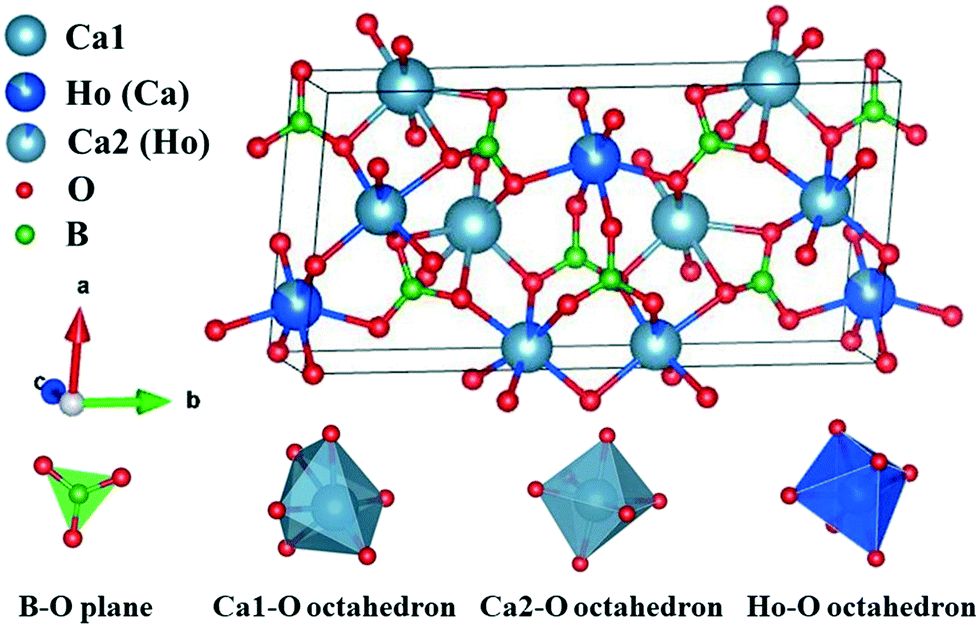
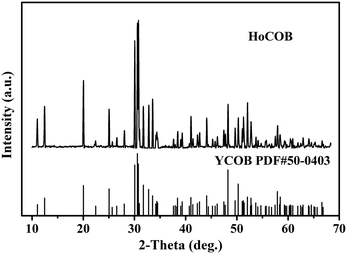
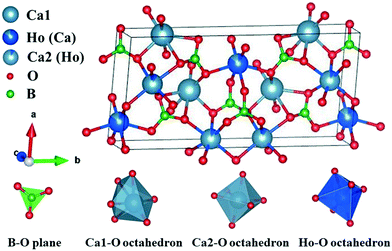
The X-ray powder diffraction (XRPD) patterns of the as-grown HoCOB crystal were compared with the standard PDF card of YCOB (PDF# 50-0403). As shown in Fig. 4, the crystal structure of the HoCOB crystal is similar to that of YCOB, belonging to a monoclinic system with point group m and space group Cm. Taking advantage of the diffractometer, the crystal structure of HoCOB was studied. As shown in Fig. 5, it was observed that the lattice position of Ho and Ca is distributed disorderly in the HoCOB structure. Through an in-depth analysis of the structure, nearly 15% of the Ho sites were occupied by Ca, while about 7.5% Ca2 sites were occupied by Ho. The lattice parameters of the HoCOB crystal were found to be a = 8.0913 Å, b = 16.0423 Å, c = 3.5367 Å, α = γ = 90° and β = 101.16°, and these parameters are listed in Table 1. The ion radii of Ho3+ and Y3+ are 0.0894 and 0.0893 nm, respectively, very close to each other, and therefore the difference in the lattice parameters between HoCOB and YCOB is very small. The unit cell volume of the HoCOB crystal calculated by using the lattice parameters is 450.39998 Å3, and the theoretical density of the HoCOB crystal is 3.837 g cm−3. This value is very close to the actual density 3.809 g cm−3, which was measured by the Archimedes drainage method.
 |
| | Fig. 4 XRPD pattern of the HoCOB crystal. | |
 |
| | Fig. 5 The structure of the HoCOB crystal. | |
Table 1 Lattice parameters of the HoCOB crystal
|
|
a/Å |
b/Å |
c/Å |
α/° |
β/° |
γ/° |
Volume/Å3 |
| HoCOB |
8.0913 |
16.0423 |
3.5367 |
90 |
101.16 |
90 |
450.39998 |
| YCOB |
8.1140 |
16.0610 |
3.5790 |
90 |
101.38 |
90 |
457.24198 |
3.3 Spectral properties
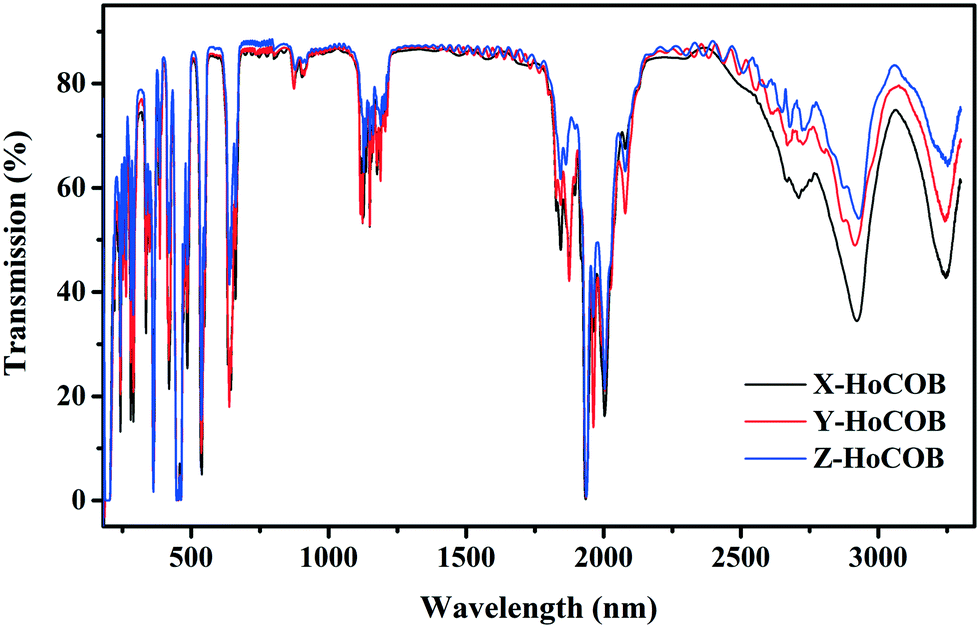
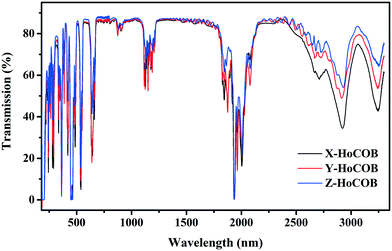
The transmission spectra of the X, Y, and Z-oriented HoCOB crystal wafers measured in the wavelength range from 200 to 3300 nm are shown in Fig. 6. The UV absorption cut-off wavelength of HoCOB is 210 nm, and the absorption peaks of the X, Y, and Z-oriented HoCOB crystal wafers don't show any wavelength shift. Compared with YCOB (cut-off: 220 nm), the UV absorption cut-off wavelength of HoCOB slightly shifts to the left, which indicates that the laser damage threshold of the HoCOB crystal is close to that of YCOB (61.54 J cm−2 at 532 nm, 8.5 ns).33 Due to the anisotropy of the crystal, the absorption intensity at different wavelengths is related to the orientation of the wafer. Taking the two strong absorption peaks around 3000 nm as an example, the intensity of the X-axis-oriented HoCOB crystal wafer is stronger than those of the other two wafers. These two absorptions are attributed to the intrinsic absorption of RCOB crystals and have nothing to do with the rare earth ions in the crystals. There are abundant absorptions in the range 200–650 nm, and high transmission bands are observed between from 670–870, 920–1100, 1220–1780, and 2150–2550 nm, endowing the HoCOB crystal with a wide range of applications in multiple fields such as laser emission, laser frequency doubling, etc. Moreover, this crystal can be used in the QPCPA system, and the wavelengths of the three interacting waves are 1060 nm (pump), 2255 nm (signal), and 2000 nm (idler), respectively.
 |
| | Fig. 6 Transmission spectra of HoCOB crystal wafers with X-, Y-, and Z-orientations. | |
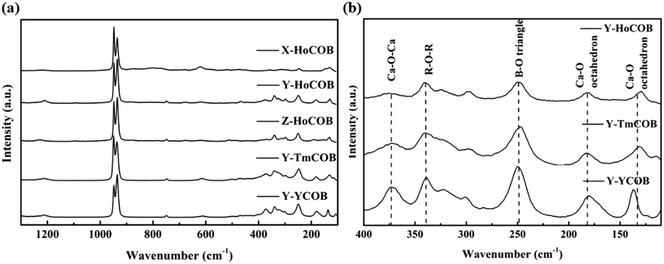
RCOB is composed of three subunits (BO3, CaO6 and RO6), among which BO3 acts as a bond between distorted RO6 and CaO6 octahedra. The regular B–O triangular plane has four internal vibration modes: (1) the symmetric stretching mode at wavenumbers between 900 and 1000 cm−1, (2) the out-of-plane B–O symmetric bonding mode at wavenumbers between 650 and 800 cm−1, (3) the asymmetric stretching mode at wavenumbers between 1250 and 1450 cm−1, and (4) the in-plane O–B–O asymmetric bending mode at wavenumbers between 590 and 680 cm−1.34 These vibration modes can be recognized in the Raman spectra of the HoCOB crystal wafers (Fig. 7a). Within the wavenumber range of <500 cm−1, in addition to the translational (T) and rotational (R) vibrations of BO3 groups, there are vibration peaks belonging to Ca2+, Re3+, and O2− ions. For the HoCOB crystal, the vibration modes can be divided into the following categories: (1) T-like Ho3+ modes at wavenumbers <120 cm−1, (2) both the T-like Ca2+ and R-like BO3 modes at wavenumbers of 120–200 cm−1, (3) both the T-like Ca2+ and T-like BO3 modes at wavenumbers of 200–300 cm−1, and (4) T-like BO3 modes at wavenumbers of 300–400 cm−1.35 In order to compare the structural differences between YCOB, HoCOB, and TmCOB, the Raman spectra of these crystals were analyzed. As shown in Fig. 7a, the discrepancies are mainly over the wavenumber range of 100–400 cm−1. In the partial enlarged Raman spectra of YCOB, HoCOB, and TmCOB (Fig. 7b), most of the peak positions and peak shapes are relatively close, except for those around 130 cm−1, which have a large deviation attributed to the rare earth elements. In the crystal structure of RCOB (Fig. 5), there are two different lattice positions for Ca2+. The peaks at 130 and 180 cm−1 are related to Ca1–O and Ca2–O octahedra, respectively. Both Ca1–O and Ca2–O octahedra can be influenced by the surrounding R–O octahedra and B–O triangles, but the distortion of the Ca1–O octahedra is more serious. Therefore, when different rare earth ions occupy the position of an R3+ ion, the R–O octahedra shrink or expand to different degrees according to the different radii of the rare earth ions (the radius of Y3+ is 89.3 pm, Tm3+ is 87 pm, and Ho3+ is 89.4 pm),36 causing the large deviation in the peak positions and shapes around 130 cm−1 in the Raman spectra.
 |
| | Fig. 7 (a) Raman spectra of the HoCOB crystal wafers with X-, Y-, and Z-orientations. (b) Partial enlarged Raman spectra of HoCOB, TmCOB, and YCOB crystals with Y-orientation. | |
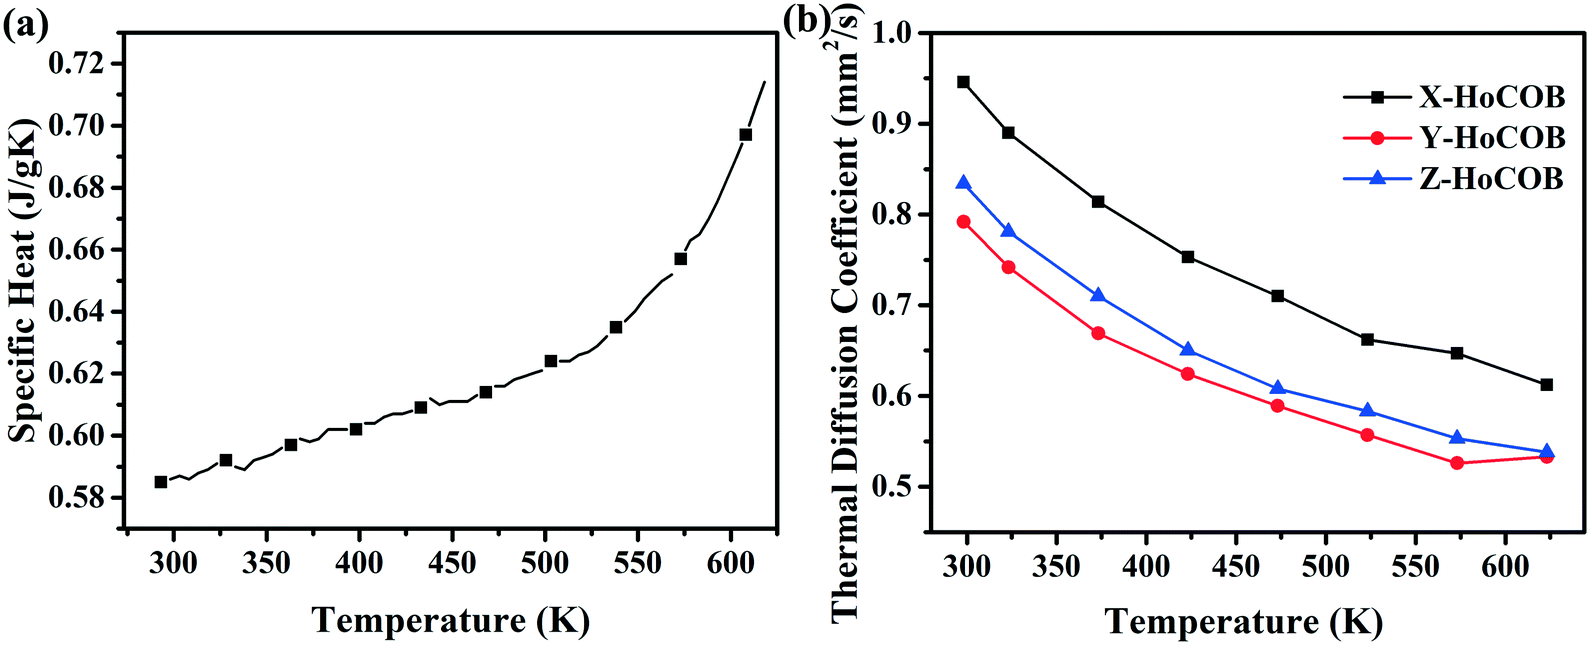
3.4 Thermal properties
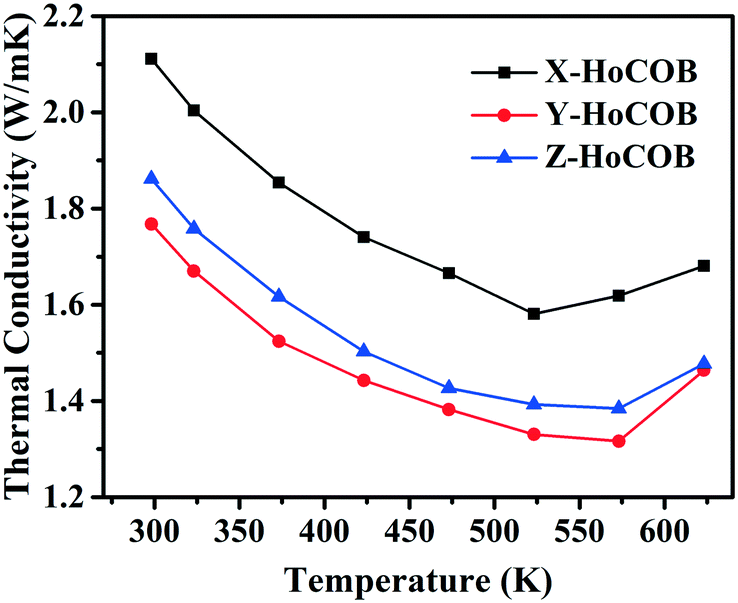
Fig. 8a shows the specific heat of the HoCOB crystal. It is 0.585 J gK−1 at 293.15 K, and then increases to 0.69 J gK−1 as the temperature rises to 600 K. The specific heat of the HoCOB crystal at 298.15 K is lower than that of the YCOB crystal (0.72 J gK−1). The thermal diffusion coefficient of the HoCOB crystal is dependent on the crystal orientation due to the anisotropy of the crystal. As shown in Fig. 8b, the X-oriented HoCOB crystal wafer has a higher thermal diffusion coefficient in the whole testing temperature range. For all the X-, Y-, and Z-oriented HoCOB crystal wafers, the thermal diffusion coefficient decreases with the increase of temperature. The thermal conductivity of each crystal wafer (Fig. 9) was calculated by using the following formula: k = λρc, where k is the thermal conductivity, while λ, ρ, and c are the thermal diffusion coefficient, density, and specific heat of the crystal, respectively. Based on the calculation, the X-oriented HoCOB crystal wafer has the highest thermal conductivity. The HoCOB crystal belongs to a non-centrosymmetric monoclinic system. The low symmetry of the structure results in strong anisotropy. At room temperature, the thermal conductivity of the X-oriented HoCOB crystal wafer can reach 2.11 W mK−1. Compared with BBO (1.64 W mK−1),37 LBO (3.95 W mK−1),38 KDP (1.67 W mK−1)39 and other nonlinear optical crystals, HoCOB has a moderate thermal conductivity.
 |
| | Fig. 8 (a) Specific heat and (b) thermal diffusion coefficients of the HoCOB crystal. | |
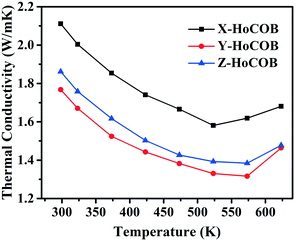 |
| | Fig. 9 Thermal conductivity of the HoCOB crystal wafers with X-, Y-, and Z-orientations. | |
4. Conclusion
A 1 inch b-direction HoCOB crystal was successfully grown with the Bridgman method, and a series of characterization techniques were carried out. The obtained HoCOB crystal shows good crystal quality, and no macroscopic defects were observed. The FWHM of the X-ray diffraction rocking curve is 86.4′′. The transmission spectra of HoCOB exhibit abundant absorptions, which is beneficial to the laser application. With the wavelengths of the three interacting waves set at 1060 nm (pump), 2255 nm (signal), and 2000 nm (idler), respectively, the HoCOB crystal should be able to be used in a 2255 nm QPCPA system. The specific heat of the HoCOB crystal increases with temperature (0.69 J gK−1 at 600 K), while the thermal diffusion coefficient decreases with temperature. Due to the anisotropy of the crystal, the X-oriented HoCOB crystal wafer shows the highest thermal diffusion coefficient. At room temperature, its thermal diffusion coefficient is 0.946 mm2 s−1.
Conflicts of interest
There are no conflicts to declare.
Acknowledgements
This work was supported by the National Natural Science Foundation of China (grant numbers 51832009, 51772150), the NSAF (grant number U1930126), and the Strategic Priority Research Program of Chinese Academy of Sciences (grant number XDA25020311).
References
- T. H. Maiman, Nature, 1960, 493–494 CrossRef.
- H. H. Yu, Z. B. Pan, H. J. Zhang and J. Y. Wang, J. Materiomics, 2016, 2, 55–65 CrossRef.
- S. Wang, C. Ji, P. Dai, L. M. Shen and N. Z. Bao, CrystEngComm, 2020, 22, 794–801 RSC.
- M. Iwai and T. K. H. Furuya, Appl. Phys., 1997, 36, 276–279 Search PubMed.
- S. J. Zhang, H. Yuan, Z. X. Cheng, X. S. Liu and H. C. Chen, J. Cryst. Growth, 2000, 208, 482–486 CrossRef.
- X. N. Tu, S. Wang, K. N. Xiong, Y. Q. Zheng and E. W. Shi, J. Cryst. Growth, 2018, 488, 23–28 CrossRef CAS.
- Z. M. Liao, I. Jovanovic and C. A. Ebbers, Opt. Lett., 2006, 31, 1277–1279 CrossRef CAS PubMed.
-
Y. Q. Zheng, A. H. Wu, P. Gao, X. N. Tu, X. Y. Liang, J. Hou, L. M. Yang, T. Wang, L. J. Qian and E. W. Shi, Pacific Rim Laser Damage 2011: Optical Materials for High Power Lasers, 2011, 8206, G1–G17 Search PubMed.
- F. P. Yu, S. J. Zhang, X. Zhao, S. Y. Guo, X. L. Duan, D. R. Yuan and T. R. Shrout, J. Phys. D: Appl. Phys., 2011, 44, 135405 CrossRef.
- F. P. Yu, X. L. Duan, S. J. Zhang, Q. M. Liu and X. Zhao, Crystals, 2014, 4, 241–261 CrossRef.
- F. P. Yu, S. J. Zhang, X. Zhao, D. R. Yuan, Q. M. Wang and T. R. Shrout, IEEE Trans. Ultrason. Ferroelectr. Freq. Control, 2011, 58, 868–873 Search PubMed.
-
B. Kindermann, PhD thesis, Fachbereich Chemie - Universität Münster, 1974 Search PubMed.
- R. Norrestam and M. Nygren, Chem. Mater., 1992, 4, 737–743 CrossRef CAS.
- T. Kobayashi, H. Furuya and M. Iwai, Appl. Phys., 1997, 276–279 Search PubMed.
- G. Aka, A. Kahn-Harari, F. Mougel, D. Vivien, F. Salin, P. Coquel, P. Colin, D. Pelenc and J. P. Damelet, J. Opt. Soc. Am. B, 1997, 9, 2238–2247 CrossRef.
- Q. Ye and B. H. T. Chai, J. Cryst. Growth, 1999, 228–235 CrossRef.
- S. J. Zhang, H. Yang, Z. X. Cheng, X. S. Liu and H. C. Chen, J. Cryst. Growth, 2000, 208, 482–486 CrossRef.
- G. M. K. Micheva, A. Y. Ageev, V. B. Rybakov, V. L. Panyutin, Y. M. Yu and V. I. Chizhikov, Inorg. Mater., 2001, 10, 1235–1245 Search PubMed.
- J. J. Adams, C. A. Ebbers, K. I. Schaffers and S. A. Payne, Opt. Lett., 2001, 4, 217–219 CrossRef PubMed.
- H. D. Jiang, J. Y. Wang, X. B. Hu, H. Liu, C. Q. Zhang, B. Teng and J. Li, J. Cryst. Growth, 2002, 234, 699–703 CrossRef CAS.
- E. Antic-Fidancev, A. Lupei, A. Caramanian and G. Aka, J. Alloys Compd., 2004, 380, 141–145 CrossRef CAS.
- J. G. Ma, J. Wang, P. Yuan, G. Q. Xie, K. N. Xiong, Y. F. Tu, X. N. Tu, E. W. Shi, Y. Q. Zheng and L. J. Qian, Optica, 2015, 11, 1006–1009 CrossRef.
- J. G. Ma, J. Wang, B. J. Zhou, P. Yuan, G. Q. Xie, K. N. Xiong, Y. Q. Zheng, H. Y. Zhu and L. J. Qian, Opt. Express, 2017, 21, 25149–25164 CrossRef PubMed.
- X. Y. Guo, X. N. Tu, S. Tokita, Y. Q. Zheng and J. Kawanaka, Laser Phys., 2018, 28, 085402 CrossRef.
- T. Y. Fan, G. Huber, R. L. Byer, C. A. Stanford and U. Ginzton, Opt. Lett., 1987, 678–680 CrossRef CAS.
- M. Schellhorn, A. Hirth and C. Kieleck, Opt. Lett., 2003, 28, 1933 CrossRef CAS PubMed.
- W. C. Yao, E. H. Li, Y. J. Shen, C. Y. Ren, Y. G. Zhao, D. Y. Tang and D. Y. Shen, Laser Phys. Lett., 2019, 16, 1–4 Search PubMed.
- P. R. Watekar, S. Ju and W. T. Han, J. Non-Cryst. Solids, 2008, 354, 1453–1459 CrossRef CAS.
- L. Arizmendi, J. M. Cabrera and F. Agullo-Lopez, J. Phys. C: Solid State Phys., 1984, 17, 515 CrossRef CAS.
- L. Xing, Y. Xu, R. Wang and W. Xu, Opt. Lett., 2013, 38, 2535–2537 CrossRef CAS.
- L. Dai, C. R. Liu, C. Tan, Z. H. Yan and Y.-H. Xu, Chin. Phys. B, 2017, 26, 44207 CrossRef.
- H. Nakao, M. Nishida, T. Shikida, H. Shimizu, H. Takeda and T. Shiosaki, J. Alloys Compd., 2006, 408–412, 582–585 CrossRef CAS.
- X. N. Tu, S. Wang, K. N. Xiong, Y. Q. Zheng and E. W. Shi, J. Cryst. Growth, 2020, 535, 125527 CrossRef CAS.
- G. Barros, E. N. Silva, A. P. Ayala, I. Guedes, C. K. Loong, J. Wang, X. Hu and H. Zhang, Vib. Spectrosc., 2008, 46, 100–106 CrossRef CAS.
- M. M. Czka, J. Hanuza, A. Paj Czkowska, Y. Morioka and J. H. van der Maas, J. Raman Spectrosc., 2004, 35, 266–273 CrossRef.
- S. W. Tian, L. L. Li, F. F. Chen, C. Jiang, F. P. Yu, Y. L. Li, X. L. Duan, W. Z. Ping, S. J. Zhang and X. Zhao, J. Materiomics, 2019, 5, 363–371 CrossRef.
- P. A. Popov, N. V. Moiseev, A. E. Kokh and K. A. Kokh, Inorg. Mater., 2011, 2, 163–166 CrossRef.
- S. G. Grechin, A. V. Zuev, A. E. Kokh, N. V. Moiseev, P. A. Popov, A. A. Sidorov and A. S. Fokin, Quantum Electron., 2010, 40, 509–512 CrossRef CAS.
- D. L. Wang, C. Y. Shen, J. J. Lan, P. P. Huang, Z. X. Cui, T. T. Kang, Y. Niu, S. L. Wang, J. Y. Wang and R. I. Boughton, J. Alloys Compd., 2019, 790, 212–220 CrossRef CAS.
|
| This journal is © The Royal Society of Chemistry 2021 |
Click here to see how this site uses Cookies. View our privacy policy here.