A small molecule with a big scissoring effect: sodium dodecyl sulfate working on two-dimensional metal–organic frameworks†
Qing
Luo
a,
Zhen
Ding
a,
Huamin
Sun
a,
Zhen
Cheng
ab,
Naien
Shi
 *a,
Chuanyuan
Song
a,
Min
Han
 b,
Daqing
Gu
a,
Mingdong
Yi
a,
Yujie
Sun
a,
Linghai
Xie
a and
Wei
Huang
 *ac
*ac
aKey Laboratory for Organic Electronics and Information Displays, Institute of Advanced Materials (IAM), Nanjing University of Posts & Telecommunications, 9 Wenyuan Road, Nanjing, China. E-mail: iamneshi@njupt.edu.cn
bJiangsu Key Laboratory of Biofunctional Materials, School of Chemistry and Materials Science, Nanjing Normal University, Nanjing 210023, Jiangsu, China
cFrontiers Science Center for Flexible Electronics, Xi'an Institute of Flexible Electronics (IFE), Xi'an Institute of Biomedical Materials & Engineering, Northwestern Polytechnical University, 127 West Youyi Road, Xi'an 710072, China. E-mail: iamwhuang@nwpu.edu.cn
First published on 8th January 2021
Abstract
Ultrathin two-dimensional (2D) metal–organic framework (MOF) nanosheets are promising advanced materials due to their particularly thin thickness and exposed active sites. The difficulty in the controlled synthesis of 2D MOFs and the limited effective synthetic routes greatly limit further extension of their applications. In this work, a solution-processed approach based on the direction of sodium dodecyl sulfate (SDS) is developed, by which a series of well-dispersed square non-layered MOF and layered MOF nanosheets have been synthesized successfully. Dynamic light scattering analysis suggests that the negative charge of SDS induces the pre-assembly of metal ions, which further leads to the 2D self-assembly process in the growth of MOF nanocrystals. The approach would be sure to push forward the effective shape control and mass production of MOF 2D nanomaterials and stimulate further research in the fields of electronic nanodevices, energy storage, catalysis and biosensing.
1. Introduction
Controlling the dimensionality of nanostructures is of great importance to get a deep insight into their physicochemical properties and structure-related functionalities.1 2D materials, including graphene, graphene oxide (GO), transition metal dichalcogenides and noble metal nanosheets, have been a research focus in recent years.2–10 As we know, MOFs are a class of materials periodically constructed from metal ions (and clusters for some MOFs) with polytopological organic ligands, and nanoscale 2D MOFs exhibit good conductivity, high surface areas, and good processing adaptability as compared to their bulk counterparts.11–13 However, the controlled synthesis of 2D MOFs is still going around the state of serendipity. Most of the current syntheses of nanoscale MOFs have produced zero-dimensional (0D) MOF nanoparticles, one-dimensional (1D) MOF nanowires and three-dimensional (3D) crystals.14–16 The classical sonication exfoliation17 or chemical exfoliation18 technique has been developed to obtain nanosheets of MOFs possessing a layered structure by overcoming the weak interactions among the layers. But this approach has low yields with uncontrollable size due to the particle fragmentation and reaggregation during the exfoliation process, which restrict them in both batch production and microfabrication.17,19 Recently, Zhang and co-authors have proposed a PVP (polyvinylpyrrolidone) assisted approach and obtained a series of porphyrinoid MOF nanosheets with a layered structure in their bulk counterparts.12 In addition, it should be pointed that lots of MOFs are of non-layered structure, and until now the lack of effective 2D synthetic methods for non-layered MOFs greatly limits the further extension of non-layered MOFs and their further applications, such as in chemical sensors, catalysis and micro-devices. It is of great value to explore an effective and generalized 2D-MOF nanosheet synthetic method for both layered and non-layered MOF structures.Herein, we develop a solution-processed approach based on the direction of sodium dodecyl sulfate (SDS), by which a series of good quality square non-layered MOF and layered MOF nanosheets can be synthesized successfully. Well dispersed regular square non-layered zeolitic imidazolate framework (ZIF) nanosheets and layered CuBDC (BDC: 1,4-benzenedicarboxylic acid) and ZnTCPP (TCPP: tetrakis(4-carboxy-phenyl)porphyrin) nanosheets were synthesized. Further studies showed that the negative charge of SDS helps the assembly of metal ions via electrostatic and intermolecular van der Waals forces, and thus induces the 2D self-assembly process in the growth of MOF nanocrystals. It is believed that this method may open the door to uni-morphology control for 2D MOFs and stimulate their further applications in the fields of micro- or nano-devices, chemical sensors and catalysis.
2. Experimental
2.1 Chemicals and reactants
Zinc(II) acetate dihydrate (ZnAc2·2H2O, 99.0%), 2-methylimidazole (2-MIM, 99.0%), N,N-dimethylformamide (DMF), acetonitrile (MeCN), ethanol (EtOH), methanol, and lauric acid were all bought from Shanghai Sinopharm Chemical Reagent Co., Ltd. Tetrakis(4-carboxyphenyl)porphyrin (TCPP, 97%) was bought from Tokyo Chemical Industry Co., Ltd. Copper nitrate trihydrate (Cu(NO3)2·3H2O, 98%) was bought from Shanghai Xinbao Fine Chemical Factory. Zinc(II) nitrate hexahydrate (Zn(NO3)2·6H2O, 99.99%), polyvinylpyrrolidone (PVP) and 1,4-benzenedicarboxylate (H2BDC, 99.0%) were bought from Shanghai Aladdin Chemistry Co., Ltd. Sodium dodecyl sulfate (SDS, 99.0%) was bought from US Alfa Aesar Reagent. Ultrapure water with a resistivity of 18.2 MΩ cm was obtained from a Millipore S. A. apparatus. All reagents and solvents were used as received without further purification.2.2 Synthesis of ZIF-8 nanosheets (NSs)
1 mL aqueous solution of ZnAc2·2H2O (0.06 g, 0.273 mmol) and 1 mL aqueous solution of sodium dodecyl sulfate (0.0394 g, 0.137 mmol) were mixed to form a homogeneous solution. Next, 1 mL 2-MIM aqueous solution (0.224 g, 2.73 mmol) was added dropwise to the above mixture under stirring for 20 s. Finally, the mixed solution was left to stand for 24 hours at 25 °C. The product was obtained as a white precipitate, washed three times with fresh methanol and centrifuged at 8000 rpm for 3 minutes.For the preparation of ZIF-67 nanosheets, CoAc2·4H2O (0.048 g, 0.193 mmol) was utilized as the metal ion source. Other processes are the same as the above for ZIF-8.
2.3 Synthesis of CuBDC nanosheets (NSs)
Cu(NO3)2·3H2O (30 mg, 0.167 mmol), lauric acid (5 mg, 0.025 mmol) and sodium dodecyl sulfate (20 mg, 0.07 mmol) were dissolved in 3 mL DMF and MeCN (VDMF![[thin space (1/6-em)]](https://www.rsc.org/images/entities/char_2009.gif) :
:![[thin space (1/6-em)]](https://www.rsc.org/images/entities/char_2009.gif) VMeCN = 2
VMeCN = 2![[thin space (1/6-em)]](https://www.rsc.org/images/entities/char_2009.gif) :
:![[thin space (1/6-em)]](https://www.rsc.org/images/entities/char_2009.gif) 1). Next, H2BDC (30 mg, 0.180 mmol) in 3 mL DMF and MeCN (VDMF
1). Next, H2BDC (30 mg, 0.180 mmol) in 3 mL DMF and MeCN (VDMF![[thin space (1/6-em)]](https://www.rsc.org/images/entities/char_2009.gif) :
:![[thin space (1/6-em)]](https://www.rsc.org/images/entities/char_2009.gif) VMeCN = 2
VMeCN = 2![[thin space (1/6-em)]](https://www.rsc.org/images/entities/char_2009.gif) :
:![[thin space (1/6-em)]](https://www.rsc.org/images/entities/char_2009.gif) 1) was added dropwise into the above solution under stirring. Then the mixed solution was left to stand at 25 °C for 4 days. The resulting blue precipitate was washed three times with DMF and centrifuged at 8000 rpm. for 3 minutes.
1) was added dropwise into the above solution under stirring. Then the mixed solution was left to stand at 25 °C for 4 days. The resulting blue precipitate was washed three times with DMF and centrifuged at 8000 rpm. for 3 minutes.
2.4 Synthesis of ZnTCPP nanosheets (NSs)
Zn(NO3)2·6H2O (4.5 mg, 0.015 mmol) and SDS (20.0 mg, 0.07 mmol) were dissolved in a 25 mL Teflon-lined autoclave containing 12 mL DMF and EtOH (VDMF![[thin space (1/6-em)]](https://www.rsc.org/images/entities/char_2009.gif) :
:![[thin space (1/6-em)]](https://www.rsc.org/images/entities/char_2009.gif) VEtOH = 3
VEtOH = 3![[thin space (1/6-em)]](https://www.rsc.org/images/entities/char_2009.gif) :
:![[thin space (1/6-em)]](https://www.rsc.org/images/entities/char_2009.gif) 1). TCPP (4.0 mg, 0.005 mmol) in 4 mL DMF and EtOH (VDMF
1). TCPP (4.0 mg, 0.005 mmol) in 4 mL DMF and EtOH (VDMF![[thin space (1/6-em)]](https://www.rsc.org/images/entities/char_2009.gif) :
:![[thin space (1/6-em)]](https://www.rsc.org/images/entities/char_2009.gif) VEtOHl = 3
VEtOHl = 3![[thin space (1/6-em)]](https://www.rsc.org/images/entities/char_2009.gif) :
:![[thin space (1/6-em)]](https://www.rsc.org/images/entities/char_2009.gif) 1) was added dropwise into the above solution under stirring. Then the autoclave was kept in an oven at 120 °C for 24 h. Finally, the resulting dark purple precipitate was washed three times with fresh EtOH and centrifuged at 8000 rpm for 3 minutes.
1) was added dropwise into the above solution under stirring. Then the autoclave was kept in an oven at 120 °C for 24 h. Finally, the resulting dark purple precipitate was washed three times with fresh EtOH and centrifuged at 8000 rpm for 3 minutes.
2.5 Characterization
Field emission scanning electron microscopy (FESEM) images were taken on a Hitachi S-4800 field emission scanning electron microscope. Selected area electron diffraction (SAED) patterns were recorded on a probe aberration-corrected JEM ARM 200F apparatus. Transmission electron microscopy (TEM) images were obtained on a Hitachi HT-7700 transmission electron microscope. X-ray diffraction (XRD) patterns were recorded on a Bruker D8 ADVANCE X-ray diffractometer using Cu Kα radiation (1.54056 Å). Thermal gravimetric analysis (TGA) measurements were conducted on a Pyris 1 TGA under the protection of argon (PerkinElmer, American) and the samples were centrifuged and dried in a vacuum at 80 °C for 24 h before TGA measurement. The N2 adsorption–desorption tests were executed on a Micromeritics ASAP 2050 analyzer. Dynamic light scattering (DLS) was performed using a laser particle size analyzer model ZetaPALS.As for the DLS analysis, 3 mL of pure SDS solution was poured into a cuvette, and then it was put into a sample tank of a laser particle size analyzer to measure the particle size distribution. The particle size distribution test of the ZIF nanosheets: as for ZIF-8, an aqueous solution of 1 mL of ZnAc2·2H2O (0.06 g, 0.273 mmol) and 1 mL of SDS (0.0394 g, 0.137 mmol) were mixed under magnetic stirring to form a homogeneous solution. Then, 1 mL aqueous solution of 2-MIM (0.224 g, 2.73 mmol) was added dropwise to the above mixed solution. The mixture was quickly poured into a cuvette, and then put into the sample tank of the laser particle size analyser for data collection. As for the analysis of the ZIF-67 system, 0.048 g of CoAc2·4H2O was used as the metal ion source.
3. Results and discussion
3.1 Non-layered and layered MOF nanosheets
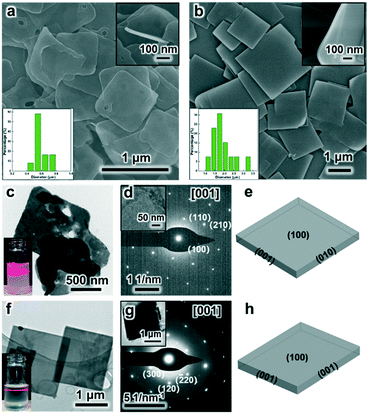
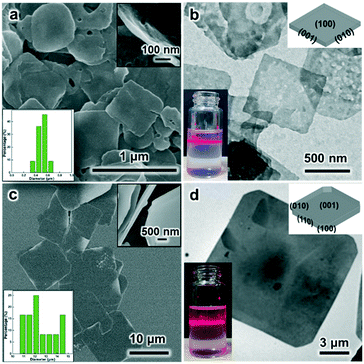
Under the SDS-directed solution approach, ZIF-8 and CuBDC nanosheets were formed. As seen in Fig. 1a, the ZIF-8 NSs exhibit a uniform square-like shape with a lateral size of about 600 nm and a thickness of 10–20 nm (Fig. 1a and S1a†). The Tyndall effect observed in the methanol solution of ZIF-8 nanosheets confirms their well-dispersed colloidal structure (Fig. 1c). Moreover, the TEM image also shows that the NSs mostly exhibit a square shape and some nanosheets are broken or have some pores (Fig. 1c). The pores may have formed from the Ostwald ripening process during the growth. The SAED pattern collected along the [001] axis gives the diffraction spots, which shows that the nanosheets are of single-crystalline structure and the bright spots are attributed to the (110) and (100) planes (Fig. 1d). The XRD pattern of the obtained ZIF-8 nanosheets (Fig. 2) gives typical peaks indexed to the (110), (200), (211), and (310) crystal planes corresponding to those of their single crystal (CCDC number: 287180).20 Notably, the relative intensity of (110) of the ZIF-8 nanosheets weakens, while the intensity of the (200) peak strengthens, indicating the preferential growth of the (100) surface. This is consistent with the simulated crystal morphology using WinXMorph (Fig. 1e and S2c†). Furthermore, the morphology and size of the ZIF-8 nanocrystals can be adjusted by changing the concentration of SDS (Fig. 3). When the SDS concentration was relatively low (4 mM), 3D cubic nanocrystals with a size of about 200–300 nm were formed (Fig. 3a). If the SDS concentration increased to 16 mM, immature defected ZIF-8 nanosheets were formed (Fig. 3b). As the SDS concentration increased to a higher concentration of 45.5 mM or 91 mM (Fig. 3c), ZIF-8 was obtained as regular and uniform nanosheets (Fig. 1a). N2 adsorption–desorption measurements were performed, and the curves of ZIF-8 are convex in the low P/P0 region, whereas in the high P/P0 region, the isotherm shows a rapid rise due to capillary condensation of the adsorbate, which indicates a typical type IV Langmuir isotherm with a H3 hysteresis (Fig. S3†). Moreover, the Brunauer–Emmett–Teller (BET) specific surface area of the ZIF-8 nanosheets is 1192 m2 g−1, which is significantly higher than those of ZIF-8 3D dodecahedra reported in the literature.21–23 The TGA of the ZIF-8 nanosheets (Fig. S4a†) shows that the weight loss is only about 5 wt% at 0–300 °C, which mainly indicates that SDS didn't remain in the nanocrystals and had a negligible effect on the thermal stability of the nanosheets.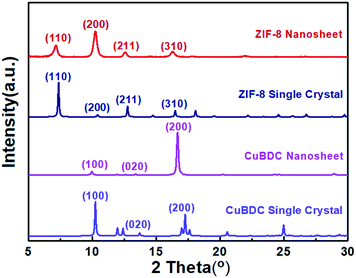 | ||
| Fig. 2 XRD patterns of the ZIF-8 and CuBDC nanosheets and simulated XRD patterns of their corresponding single crystals. | ||
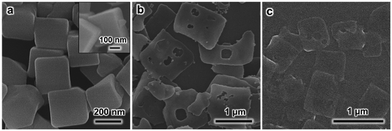 | ||
| Fig. 3 FESEM images of the ZIF-8 products at SDS concentrations of (a) 4, (b) 16 and (c) 91 mM, respectively. The inset is the cross-sectional FESEM image of the obtained ZIF-8 cubic crystals. | ||
On the other hand, as for the prepared CuBDC nanosheets, they have a square shape, uniform size with a lateral size of 1–3 μm and a thickness of about 25 nm (Fig. 1b and S1b†). The TEM image in Fig. 1f clearly shows their regular square shape and smooth surface (Fig. 1f). The Tyndall effect observed in the DMF solution of the CuBDC nanosheets also confirms their colloidal structure (inset in Fig. 1f). The bright diffraction spots in the SAED pattern show that they are single crystalline and the (100) surface is the preferential growth for the CuBDC nanosheets (Fig. 1g). The XRD pattern shows three reflections, which can be indexed to the (100), (020) and (200) crystal facets (Fig. 2) corresponding to the reported pattern of the CuBDC single crystal (CCDC number: 687690).24 The crystal morphology of the nanosheets given using WinXMorph indicates that the largest plane of the CuBDC nanosheets is also the (100) facet (Fig. 1h and S5c†), which is consistent with the XRD and SAED results. Besides, the TGA diagram shows that the weight loss is about 15 wt% at 0–300 °C, which may be due to the loss of guest molecules and unreacted substances (such as BDC2−) or the residual trace amount of SDS (Fig. S4b and 4c†).
3.2 Proposed mechanism
As shown above, both the ZIF-8 and CuBDC nanosheets were successfully obtained by the developed SDS directed solution processed method. In order to further investigate the special role of sodium dodecyl sulfate, classical polyvinylpyrrolidone was investigated in a control experiment under similar experimental conditions. Three different mass concentration levels of PVP, 10 mg mL−1, 20 mg mL−1 and 80 mg mL−1, were explored. The FESEM images show that the produced products are all 3D dodecahedral nanocrystals with a lateral size of about 1.5 μm (Fig. S6†). Similarly, ZIF-67 nano-dodecahedra can be also clearly seen in the presence of PVP (Fig. S7†). Since it is under similar experimental conditions, the influence of the factors of solvent, temperature and the reactant concentrations is excluded.25 Without a surfactant, dodecahedral ZIF-8 nanocrystals are also formed (Fig. S8†). In comparison with PVP, SDS consists of a long carbon chain and an anionic head group. As we know, generally, surfactants would selectively adsorb on specific surfaces of nanocrystals, thus controlling the growth rate of specific surfaces of nanocrystals, and further determining the nanocrystal size and morphology.26,27 So, as for SDS, aside from its adsorption on the hydrophobic plane via hydrophobic alkyl chains, there are strong electrostatic interactions between –OSO3− (the negatively charged sulfate head group of SDS) and the bare metal ion nodes. They should play a key role in producing the 2D-MOF nanostructures.In order to further investigate the growth process, the dynamic growth process of ZIF-8 under SDS was proposed. Firstly, when the zinc acetate solution was mixed with SDS, the solution turned slightly turbid (Fig. S9a and b†). And after 2-MIM ligands were added, the solution became strongly turbid immediately (Fig. S9c†), indicating the fast coordination of Zn2+ ions and 2-MIM.28,29 The FESEM image shows that small ZIF-8 particles were formed at this stage (Fig. S10a,† 0 min).
Subsequently, ZIF-8 changed to an irregular lamellar structure (Fig. S10b,† 2 hours). After about 4 hours, uniform regular nanosheets were obtained, and it was expected that there are some obvious defects in the obtained nanosheets (Fig. S10c,† 4 hours). After that, square crystalline nanosheets were formed gradually (Fig. S10d,† 24 hours).
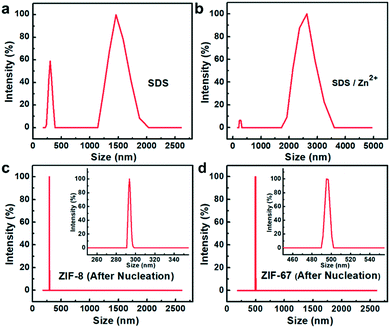
Based on the above results, the formation process can be deduced (Fig. 4b). As mentioned above, electrostatic interactions produced the 2D-MOF nanostructures. At first, since the valence of Zn2+ is higher than that of Na+, Zn2+ and –OSO3− have stronger electrostatic attraction in the mixed solution of zinc acetate solution and sodium dodecyl sulfate, and Zn2+ ions substitute Na+ and interact with the head group –OSO3− of SDS, and subsequently, the solution turned slightly turbid. They undergo a pre-assembly process via the electrostatic attractions driven by van de Waals forces among SDS (Fig. 4b, stage I), and this is studied afterwards by DLS analysis. Next, when the ligands are added, the metal cations coordinate with the ligands to form small crystal nuclei (stage II, Fig. 4b, nuclei structure is shown therein), and the small crystal nuclei are transformed into small ZIF-8 nanoparticles (Fig. S10a†), and the solution simultaneously turned turbid (Fig. S9c†). Subsequently, with the increase of time, the nanoparticles further assembled into 2D nanosheets in 24 hours. This process is electrostatically driven by SDS and SDS preferentially adsorbs on Zn2+ ion-abundant planes. As shown in Fig. S2c,† the preferential crystal plane in the ZIF-8 nanosheets (100) is the Zn2+ abundant facet (Fig. S2c†). Similarly, as shown in Fig. S5c,† SDS preferentially adsorbs on the Cu2+ abundant facet (100) in the CuBDC nanosheets. The interaction between Zn2+ and SDS was further studied by dynamic light scattering (DLS). As for the SDS solution, it can be seen that the particle size is mainly located in the two particle size ranges of 200–300 nm and 1300–1600 nm (Fig. 5a). Since the SDS solution is 45.5 mM, the spherical micelles can be transformed into larger rod-shaped micelles driven by intermolecular van de Waals forces, and due to the coexistence of spherical and rod-shaped SDS micelles, the DLS diagram shows the two different particle size ranges.30–32 Next, when zinc acetate solution and SDS are mixed, the DLS diagram shows that the particle size of the mixture increased (Fig. 5b). This indicates an assembly process between Zn2+ ions and SDS, the transformation of the micelle structure into a lamellar one.33–35 After the 2-MIM ligands were added, the particle size changed abruptly to 290–300 nm for ZIF-8, which arose from the formation of nanocrystalline nuclei in the solution (Fig. 5c). By this method, ZIF-67 nanosheets were also obtained. The obtained square ZIF-67 nanosheets exhibit a lateral size of about 400–500 nm and a thickness of 20 nm (Fig. 6). As for the DLS curve, the particle size of ZIF-67 changed abruptly to 490–510 nm after the addition of the ligand, which also evidences the changes in this stage (Fig. 5d). The changes in the above DLS curves at different stages prove the structure transformations during the growth process. Besides, other MOF nanosheets of ZnTCPP were synthesized with a lateral length of 10–15 μm and a thickness of about 140 nm (Fig. 6 and S11†). The XRD patterns confirm the same crystal phase for these nanosheets as those of ZIF-67 and bulk ZnTCPP (Fig. S12†). Furthermore, similar to that of ZIF-8, the size or morphology of the ZIF-67 NSs and ZnTCPP NSs can also be influenced by the concentration of SDS (Fig. S13†).
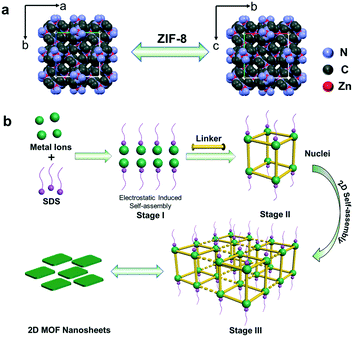 | ||
| Fig. 4 (a) The crystal structure of ZIF-8. (b) Schematic diagram of the SDS-directed self-assembly of 2D MOF nanosheets. | ||
4. Conclusion
In summary, we developed a simple and efficient SDS-directed solution processed approach to obtain well-dispersed flat square MOF nanosheets with both non-layered and layered structures. The size of the obtained MOF nanostructures can be tuned by the SDS concentration. Further studies indicated that SDS molecules should pre-assemble with metal ions via electrostatic interaction and adsorb on the crystal surface (rich in metal ions), thereby limiting the direction of crystal growth and forming a 2D sheet structure. This work is the first to attempt to synthesize uni-morphological 2D-MOF nanomaterials, which is of great importance to their future applications in the precise and quantitative preparation of electronic nanodevices, chemical sensors, gas storage materials and catalysts.Conflicts of interest
There are no conflicts of interest to declare.Acknowledgements
This work was supported by the National Natural Science Foundation of China for the project (21471082, 21671106, 61775100 and 11874334), the Natural Science Foundation of the Education Committee of Jiangsu Province of China (18KJA510003), the Synergetic Innovation Center for Organic Electronics and Information Displays, the National Natural Science Foundation of China (61935017), the Projects of International Cooperation and Exchanges NSFC (51811530018), the Priority Academic Program Development of Jiangsu Higher Education Institutions (PAPD, YX030003), the Six Talent Peaks Project in Jiangsu Province (XCL-CXTD-009), and the opening research foundations of State Key Laboratory of Coordination Chemistry.Notes and references
- Y. Jun, J. Choi and J. Cheon, Angew. Chem., Int. Ed., 2006, 45, 3414–3439 CrossRef CAS PubMed.
- D. Li and R. B. Kaner, Science, 2008, 320, 1170–1171 CrossRef CAS PubMed.
- J. Chen, Z. Mao, L. Zhang, D. Wang, R. Xu, L. Bie and B. D. Fahlman, ACS Nano, 2017, 11, 12650–12657 CrossRef CAS PubMed.
- M. Chhowalla, Z. Liu and H. Zhang, Chem. Soc. Rev., 2015, 44, 2584–2586 RSC.
- P. Miro, M. Ghorbaniasl-Asl and T. Heine, Angew. Chem., Int. Ed., 2014, 53, 3015–3018 CrossRef CAS PubMed.
- R. Ma and T. Sasaki, Acc. Chem. Res., 2015, 48, 136–143 CrossRef CAS PubMed.
- A. Liu, M. Gao, X. Ren, F. Meng, Y. Yang, Q. Yang, W. Guan, L. Gao, X. Liang and T. Ma, Nanoscale, 2020, 12, 10933–10938 RSC.
- H. Li, Z. Song, X. Zhang, Y. Huang, S. Li, Y. Mao, H. J. Ploehn, Y. Bao and M. Yu, Science, 2013, 342, 95–98 CrossRef CAS PubMed.
- F. Song and X. Hu, Nat. Commun., 2014, 5, 4477 CrossRef CAS PubMed.
- M. Wu, P. Liu, L. Li, H. Dong, Y. Cheng, H. Chen, W. Wang, H. Liu, F. Lu, W.-H. Wang and K. Cho, Nanoscale, 2020, 12, 7188–7195 RSC.
- F.-Y. Yi, R. Zhang, H. Wang, L.-F. Chen, L. Han, H.-L. Jiang and Q. Xu, Small Methods, 2017, 1, 1700187 CrossRef.
- M. Zhao, Y. Wang, Q. Ma, Y. Huang, X. Zhang, J. Ping, Z. Zhang, Q. Lu, Y. Yu, H. Xu, Y. Zhao and H. Zhang, Adv. Mater., 2015, 27, 7372–7378 CrossRef CAS PubMed.
- M. Zhao, Y. Huang, Y. Peng, Z. Huang, Q. Ma and H. Zhang, Chem. Soc. Rev., 2018, 47, 6267–6295 RSC.
- S. Wang, C. M. Mcguirk, A. I. Daquino, J. A. Mason and C. A. Mirkin, Adv. Mater., 2018, 30, 1800202 CrossRef PubMed.
- A. Carne, C. Carbonell, I. Imaz and D. Maspoch, Chem. Soc. Rev., 2011, 40, 291–305 RSC.
- T. Gong, P. Li, Q. Sui, J. Chen, J. Xu and E.-Q. Gao, J. Mater. Chem. A, 2018, 6, 9236–9244 RSC.
- Y. Peng, Y. Li, Y. Ban, H. Jin, W. Jiao, X. Liu and W. Yang, Science, 2014, 346, 1356–1359 CrossRef CAS PubMed.
- Y. Ding, Y. P. Chen, X. Zhang, L. Chen, Z. Dong, H. L. Jiang, H. Xu and H. C. Zhou, J. Am. Chem. Soc., 2017, 139, 9136–9139 CrossRef CAS PubMed.
- P.-Z. Li, Y. Maeda and Q. Xu, Chem. Commun., 2011, 47, 8436–8438 RSC.
- X.-C. Huang, Y.-Y. Lin, J.-P. Zhang and X.-M. Chen, Angew. Chem., Int. Ed., 2005, 45, 1557–1559 CrossRef PubMed.
- Y. Pan, Y. Liu, G. Zeng, L. Zhao and Z. Lai, Chem. Commun., 2011, 47, 2071–2073 RSC.
- A. F. Gross, E. Sherman and J. J. Vajo, Dalton Trans., 2012, 41, 5458–5460 RSC.
- Y. Li, K. Zhou, M. He and J. Yao, Microporous Mesoporous Mater., 2016, 234, 287–292 CrossRef CAS.
- C. G. Carson, K. I. Hardcastle, J. Schwartz, X. T. Liu, C. Hoffmann, R. A. Gerhardt and R. Tannenbaum, Eur. J. Inorg. Chem., 2009, 16, 2338–2343 CrossRef.
- G. Zhan and H. C. Zeng, Adv. Funct. Mater., 2016, 26, 3268–3281 CrossRef CAS.
- Z.-Q. Lin, P.-J. Sun, Y.-Y. Tay, J. Liang, Y. Liu, N.-E. Shi, L.-H. Xie, M.-D. Yi, Y. Qian, Q.-L. Fan, H. Zhang, H. H. Hng, J. Ma, Q. Zhang and W. Huang, ACS Nano, 2012, 6, 5309–5319 CrossRef CAS PubMed.
- J. Zhao, Y. Wang, W. Dong, Y. Wu, D. Li, B. Liu and Q. Zhang, Chem. Commun., 2015, 51, 9479–9482 RSC.
- Z. Liu, Y. Fan and Y. Wang, Soft Matter, 2018, 14, 9830–9837 RSC.
- K. Hąc-Wydro, A. Mateja, A. Ożóg and P. Miśkowiec, J. Mol. Liq., 2017, 240, 514–521 CrossRef.
- J. Zhao and B. M. Fung, Langmuir, 1993, 9, 1228–1231 CrossRef CAS.
- K. Din, U. S. Siddiqui and G. Ghosh, J. Dispersion Sci. Technol., 2009, 30, 1310–1319 CrossRef.
- Z. Zhang and H. Liu, Zhongguo Keji Lunwen Zaixian, 2011, 201107-93 Search PubMed (in Chinese).
- C. Chi, X. Wang, Y. Peng, Y. Qian, Z. Hu, J. Dong and D. Zhao, Chem. Mater., 2016, 28, 2921–2927 CrossRef CAS.
- A. Pustovarenko, M. G. Goesten, S. Sachdeva, M. Shan, Z. Amghouz, Y. Belmabkhout, A. Dikhtiarenko, T. Rodenas, D. Keskin, I. K. Voets, B. M. Weckhuysen, M. Eddaoudi, L. d. Smet, E. J. R. Sudhölter, F. Kapteijn, B. Seoane and J. Gascon, Adv. Mater., 2018, 30, 1707234 CrossRef PubMed.
- M. Sammalkorpi, M. Karttunen and M. Haataja, J. Phys. Chem. B, 2009, 113, 5863–5870 CrossRef CAS PubMed.
Footnote |
| † Electronic supplementary information (ESI) available. See DOI: 10.1039/d0ce01751e |
| This journal is © The Royal Society of Chemistry 2021 |

