 Open Access Article
Structure–property correlations in piracetam polytypes†
Pratik P.
Upadhyay
 a,
Manish Kumar
Mishra
b,
Upadrasta
Ramamurty
cd and
Andrew D.
Bond‡
 *a
*a
aDepartment of Pharmacy, University of Copenhagen, Denmark
bDepartment of Pharmaceutics, College of Pharmacy, University of Minnesota, Minneapolis, Minnesota 55455, USA
cSchool of Mechanical and Aerospace Engineering, Nanyang Technological University, Singapore 639798, Republic of Singapore
dInstitute of Materials Research and Engineering, Agency for Science, Technology and Research (A *STAR), 138634 Singapore
First published on 23rd December 2020
Abstract
Polymorphs II and III of piracetam exhibit a polytypic relationship comprising identical layers of molecules with different relative arrangements. Polymorph II has an interlayer structure in which the piracetam molecules adopt face-to-face and edge-to-edge alignments, while polymorph III adopts a herringbone type arrangement in the interlayer region. The structures are analysed using energy-vector models derived from PIXEL pairwise intermolecular interaction energies. Thermal expansion measurements show that the principal expansion axes are approximately aligned with the unit-cell axes in polymorph III, corresponding to directions within the polytypic layers and perpendicular to them. Expansion perpendicular to the layers is almost twice as large as that along any direction within the layers. Polymorph II shows greater volumetric expansion than polymorph III, and its principal expansion axes are aligned parallel and perpendicular to the planes of the piracetam molecules, rather than along the unit-cell axes. Nanoindentation experiments performed on single crystals along the direction perpendicular to the polytypic layers show that the polymorphs have similar hardness (H) values, but polymorph III has a significantly larger elastic modulus (E). Along the direction nearly parallel to the polytypic layers, polymorph II shows a very similar E value to that perpendicular to the layers, but a significantly smaller H value, implying easier slip between the polytypic layers. The tableting behaviour of bulk polymorph II is superior to that of polymorph III, suggesting greater plasticity for polymorph II, which is likely due to a greater degree of slip.
Introduction
Developing a robust understanding of the relationships between crystal structure and macroscopic physical properties can provide a rational basis for the design of crystalline chemical products for enhanced processability and performance, for example in the pharmaceutical industry.1 To achieve this in any general sense requires understanding and control over a range of scales, from the single-crystal to particle and bulk levels. Concepts of crystal engineering can often be applied at the single-crystal level to modify, and sometimes specifically to enhance, relevant materials properties.2–5 To build knowledge in this area, it can be especially useful to study polymorphs, since these provide an opportunity to experiment with the same chemical system in different crystalline arrangements. Often, polymorphs exhibit structural differences in three dimensions, but in some cases, they retain a greater degree of structural similarity. For example, we have studied several pharmaceutically-relevant polytypic systems, in which consistent two-dimensional layers of molecules are arranged in different ways, including aspirin,6 felodipine7 and piroxicam.8 We have observed twinning and “intergrowth polymorphism” in these systems, which can lead to variations in the physical properties of crystals on account of differing microstructures.Over the last decade or so, nanoindentation has emerged as a powerful technique to examine the mechanical properties of molecular single crystals.9–11 With it, one can determine elastic modulus (E) and hardness (H) of crystals obtained from typical small-scale crystallization trials. The results obtained have been correlated to bulk properties for a range of molecular crystals, including active pharmaceutical ingredients (APIs).12–15 In the context of tableting of APIs, average H and E values are typically compared with elastic recovery or tabletability of a bulk powder.16,17 One advantage of nanoindentation is that it can probe crystals from several directions (dependent on the crystal faces that can be developed during crystallization), allowing an examination of the interaction anisotropy.6 Measuring H and E values by nanoindentation for structurally related polymorphs provides experimental data that can be used to relate mechanical properties to crystal structure, and hopefully to link this understanding to bulk tableting behaviour.
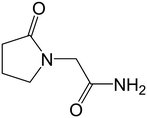
In this paper, we examine the connections between structure and the physical and mechanical properties of a model API: piracetam (Fig. 1). Several polymorphs of piracetam have been reported,18–28 of which forms II and III (denoted FII and FIII hereafter) are known to be stable at room temperature. Other polymorphs (forms I, IV, and V) are stable only at higher temperatures and/or pressures. The crystal structures of FII and FIII (CSD refcodes: BISMEV11 and BISMEV12) have previously been examined in detail.29 They display a polytypic relationship, and our aim here is to examine the physical and mechanical properties of these polytypes. The relationship between the indentation responses and the closely-related crystal structures are considered using energy-vector models derived from PIXEL pairwise intermolecular interaction energies.30 Thermal expansion measurements are also made to provide an additional experimental probe of the interaction anisotropy, which can add to the static picture of the energy-vector model. The results are finally compared to measurements of powder tabletability for the bulk samples.
Experimental
Materials
Piracetam was purchased from Fagron, Denmark and was received as FIII, as confirmed by powder X-ray diffraction (PXRD). HPLC grade solvents were used for crystallisation of single crystals and bulk powder samples.Crystallisation of the piracetam polytypes
Single crystals of FII (block morphology) and FIII (plate morphology) were concomitantly grown by slow cooling of a hot saturated solution of piracetam in n-propanol at room temperature. The bulk powder of FII was prepared by heating the as-supplied FIII in an oven at 120 °C for 24 hours followed by slow cooling to room temperature. The powder was allowed to stand at room temperature for 48 hours, and the polymorphic purity of FII was confirmed by PXRD (ESI†).Single-crystal X-ray diffraction
The identity of single crystals of FII and FIII was confirmed by comparing the experimentally measured unit-cell parameters to those reported in the Cambridge Structural Database (CSD).31 X-ray diffraction was carried out on a Bruker D8-QUEST instrument equipped with an Incoatec IμS Cu microsource. Face indexing was performed within the APEX3 software (ESI†).Powder X-ray diffraction (PXRD)
Powder X-ray diffraction (PXRD) data were collected on a Panalytical X'Pert Pro instrument equipped with a PIXcel detector using non-monochromated CuKα radiation (λave = 1.5418 Å). Samples were placed on a zero-background Si holder and measured in reflection geometry, with sample spinning, over a 2θ range of 5 to 35°.Thermal expansion measurements
Lattice parameters were measured for single crystals of FII and FIII over the temperature range ca. 100–300 K at 50 K intervals on a Bruker D8-QUEST single-crystal instrument (ESI†). Thermal expansion coefficients and directions of the principal expansion axes were calculated using the PASCal web tool.32 Thermal expansion coefficients are quoted in ppm with units K−1.Nanoindentation
Good quality dried single crystals of FII and FIII, identified using a polarising microscope, were fixed on metal discs using a thin layer of epoxy resin (ESI†). Nanoindentation was performed in the direction normal to the crystal surface using a nanoindenter (Hysitron Triboindenter, Minneapolis, USA), equipped with an in situ AFM imaging capability. A three-sided pyramidal Berkovich diamond indenter (Poisson's ratio = 0.07, tip radius ≈ 100 nm) was used. A maximum force of 5 mN was applied with a loading indentation speed of 0.5 mN s−1. At the maximum peak load of 5 mN, the tip was held for 30 s to ensure complete plastic deformation of the material, then unloading was applied at a rate of 0.5 mN s−1. At least 15 indentations were performed on each crystal face to obtain consistent and reliable average data. The elastic modulus (E) and indentation hardness (H) were calculated from the unloading curve using the Oliver–Pharr method.33,34 Where significant pile-up was observed during indentation, the H value was determined from the maximum load (5 mN) divided by the contact area, A, estimated from the AFM images of the indentation impressions (ESI†).35,36Tablet preparation
Tablets of approx. 100 mg were prepared by compressing pure piracetam powders using a Gamlen single-punch laboratory tablet press. Flat-faced punches of 6 mm diameter were used with a compression speed of 60 mm min−1 using a 500 kg load cell. Prior to compression, the punch and die cavity were pre-lubricated using 1% magnesium stearate in acetone. The crushing strength of the tablets was measured on the same instrument using a 50 kg load cell. The strength (σc) of the tablets was calculated from the force required for crushing, F (N):| σc = (2F)/(π·d·t) |
Computational methods
As a preliminary step, the crystal structures29 of FII and FIII were energy-minimised using dispersion-corrected density functional theory (DFT-D) calculations. Prior to minimisation, the positions of all H atoms were normalised using the default settings in Mercury.37 The calculations were made using CASTEP38via the interface in Materials Studio.39 The PBE exchange–correlation functional40 was applied, with a dispersion correction according to Grimme.41 The plane-wave basis-set cut-off was set to 340 eV and all other parameters were set to the “Fine” defaults in Materials Studio. Unit-cell parameters were constrained to the reported values and the space-group symmetry was imposed. Neither structure produced any significant deviation on minimisation, consistent with high-quality crystal structures. The optimised structures are provided in the ESI.†Pairwise intermolecular interaction energies were calculated using the PIXEL program.30 The calculations were applied to the DFT-D minimised structures, retaining the H atom positions from those structures. The PIXEL output was converted to energy-vector diagrams using processPIXEL,42 and subsequent visualisation was carried out in Mercury. The energy-vector diagrams are based on the concepts developed by Shishkin and co-workers,43 and the approach is comparable to the energy frameworks implemented by Spackman and co-workers in the program Crystal Explorer.44
Results and discussion
Crystal structures of piracetam polytypes
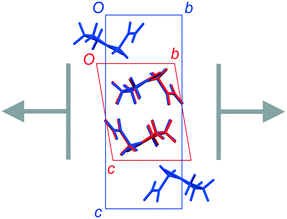
FII and FIII crystallize in space groups P![[1 with combining macron]](https://www.rsc.org/images/entities/char_0031_0304.gif) and P21/n, respectively, with a single molecule in the asymmetric unit (Table 1). The structure of FII is available in the CSD in its standard reduced unit-cell setting, but it can be more directly aligned with FIII if it is transformed using the matrix [1 0 0 / 0−1 0 / 0 0−1]. This produces the unit cells shown in Table 1, and the overlaid structures indicated in Fig. 2. Throughout this paper, we refer to FII in this transformed setting.
and P21/n, respectively, with a single molecule in the asymmetric unit (Table 1). The structure of FII is available in the CSD in its standard reduced unit-cell setting, but it can be more directly aligned with FIII if it is transformed using the matrix [1 0 0 / 0−1 0 / 0 0−1]. This produces the unit cells shown in Table 1, and the overlaid structures indicated in Fig. 2. Throughout this paper, we refer to FII in this transformed setting.
| Polymorph | Symmetry | Unit-cell parameters [Å, °] |
|---|---|---|
| FII | Triclinic | a = 6.353, b = 6.528, c = 8.372 |
| (BISMEV11, transformed) |
P![[1 with combining macron]](https://www.rsc.org/images/entities/char_0031_0304.gif) |
α = 80.30, β = 101.77, γ = 90.95 |
| FIII | Monoclinic | a = 6.454, b = 6.386, c = 16.181 |
| (BISMEV12) | P21/n | β = 92.06 |
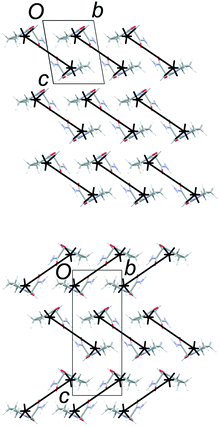
The common 2-D layers in the polytypes lie parallel to the (001) planes. Within these layers, the piracetam molecules are linked into centrosymmetric pairs through their amide groups (graph set R22(8)), and the pairs are linked along the a axis by further N–H⋯O interactions to the carbonyl O atom of the 5-membered ring (Fig. 3). Thus, the H-bonding network defines columns of R22(8) dimers along the a axis. Molecules in neighbouring H-bonded columns adopt face-to-face arrangements of their rings. Along the b axis, the molecules are related by inversion centres, defining the consistent polytypic layers (Fig. 3). In FII, neighbouring layers are related by translation along the defined c axis. Molecules adopt face-to-face arrangements of rings and edge-to-edge interactions involving pairs of C–H⋯O contacts, both across crystallographic inversion centres. The rings in all piracetam molecules are approximately aligned in parallel planes. In FIII, adjacent layers are related by 21 screw axes parallel to the b axis, which leads to doubling of the c axis compared to FII. Neighbouring molecules adopt edge-to-face interactions between rings, involving C–H⋯O contacts, to produce a herringbone type arrangement. In terms of the C–H⋯O contacts between molecules, the alternative interlayer arrangements represent a classic “dimer vs. catemer” case.
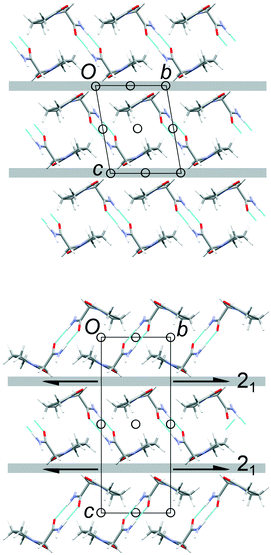 | ||
| Fig. 3 Structures and selected symmetry elements of FII (top) and FIII (bottom) viewed along the a axis. The grey bars indicate the interlayer regions between the common polytypic layers. | ||
Intermolecular interaction energies
The total lattice energies, calculated by PIXEL, suggest that FIII (Elatt = −134.0 kJ mol−1) is marginally more stable than FII (Elatt = −132.0 kJ mol−1).§ Lists of pairwise intermolecular interaction energies are given in the ESI.† The derived energy-vector models (Fig. 4) comprise lines linking the molecular centroids, scaled in length according to the magnitude of the interaction energy between the molecules. The most stabilising interaction in the structure is displayed as a complete line, and less stabilising interactions are scaled proportionally to produce gaps within the lines. Larger gaps indicate less stabilising interactions, and it is intuitive to see the directions in which molecules are most strongly and least strongly bound. The energies refer to the total interaction between molecules, rather than any specific interactions such as hydrogen bonds.Fig. 4 confirms the expectation that the most stabilising interaction in each structure occurs between molecules linked by the R22(8) hydrogen-bonded dimer between amide groups. This is ca. −64 kJ mol−1 in both structures, which places the two diagrams on approximately the same scale. Since FII and FIII contain identical layers, the energy-vector diagrams appear identical in the ab planes, and the main point of interest is the difference between the interactions in neighbouring layers. To amplify these regions, the models in Fig. 5 show only the interlayer interactions, scaled to the most stabilising interlayer interaction in each case. Again, these have very similar energies (see below), so the diagrams are on a comparable scale.
The simplest interlayer arrangement is seen for form III, where there is only one type of interaction with any significant interaction energy (magnitude >3 kJ mol−1). This is the edge-to-face interaction noted between rings, with total interaction energy −27.0 kJ mol−1. The resulting framework in the interlayer region comprises regular zig-zag patterns along the b axis, confined within the bc planes. In form II, the noted face-to-face and edge-to-edge interactions across the interlayer region have closely comparable interaction energies (−29.8 and −29.1 kJ mol−1, respectively), and adopt a similar zig-zag pattern. Some further interactions of the order of 6–8 kJ mol−1 are formed between molecules in adjacent bc planes, including one destabilising coulombic interaction at +8.0 kJ mol−1. However, the overall picture in the interlayer region is very similar in FII and FIII, and there is little in the details of the energy-vector diagrams to distinguish the two cases. The picture provided in Fig. 4 is the best summary: the networks are very closely comparable, including in the interlayer region, but differ in orientation in neighbouring layers on account of the polytypism.
Thermal expansion measurements
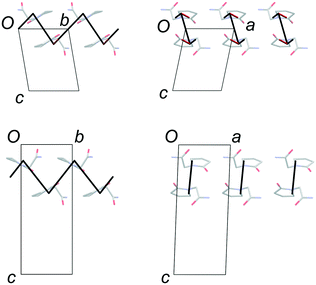
Lattice parameters were measured for single crystals of FII and FIII over the temperature range 100–300 K in 50 K steps (ESI†). The change in unit-cell volume over the range is effectively linear for both polymorphs. The volumetric thermal expansion coefficient (Table 2) is larger for FII (211(5) ppm K−1) than for FIII (154(5) ppm K−1). In the latter, the principal expansion axes are approximately aligned with the a, b and c axes of the unit cell (Fig. 6). The associated expansion coefficients (Table 2) indicate broadly isotropic expansion within the polytypic layers, with greater expansion occurring perpendicular to the layers. In FII, the principal expansion axes are not directly aligned with the unit-cell axes, but rather appear to be aligned with the piracetam molecules (Fig. 6). The axis with the largest coefficient lies approximately normal to the planes of the piracetam molecules, while that with the second largest coefficient is aligned roughly parallel to the side-on interaction involving the C–H⋯O contacts. For comparison with FIII, the expansion coefficients calculated for FII along the a and b axes and perpendicular to the polytypic layers (given by the change in d(001)) are 32, 76 and 87 ppm K−1, respectively. These values indicate that the expansion of FIII is largely uniaxial, with greatest expansion perpendicular to the polytypic layers. This is the picture that might be expected from the energy-vector models in Fig. 4. In FII, however, expansion in the bc planes is closer to isotropic. Since the polytypic layers are identical in the two structures, this difference must reflect the different nature of the face-to-face vs. edge-to-face arrangements of the piracetam rings at the interlayer regions.| EV1 | EV2 | EV3 | Volumetric | |
|---|---|---|---|---|
| FII | 20 (2) | 71 (2) | 116 (4) | 211 (5) |
| FIII | 30 (3) | 44 (1) | 78 (3) | 154 (5) |
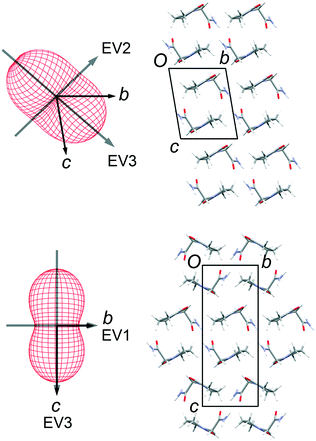 | ||
| Fig. 6 Thermal expansion tensors and orientation of the principal expansion axes in FII (top) and FIII (bottom). The expansion coefficients along each axis are indicated in Table 2. The third principal axis is approximately perpendicular to the page. The axis directions are averaged over the temperature range 100–300 K. | ||
Nanoindentation
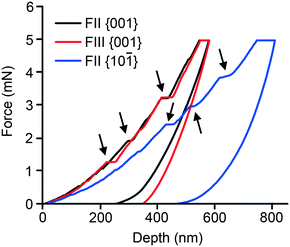
Nanoindentation was performed on well-formed single crystals of both polymorphs. While both the {001} and {10−1} faces of FII could be indented, only the {001} face of FIII was sufficiently well developed for indentation experiments (see ESI† for face identification). Representative indentation force (P) versus the depth of penetration (h) responses are displayed in Fig. 7. As seen, the P–h responses obtained on the {001} faces of FII and FIII are similar. However, {001} and {10−1} of FII differ substantially. All the P–h curves indicate significant plastic deformation, as inferred from the residual indentation depth upon complete unloading. Serrations on the loading segments (highlighted by arrows), which are often referred to as ‘pop-ins’ and indicate intermittent plastic deformation events, are seen in all the three P–h responses. The average values of the displacements associated with the pop-ins are often correlated with integer multiples of the relevant interplanar spacing (dhkl) of the crystal structure. For FII, the pop-ins occur with approximate displacement magnitudes of 4, 8, 16 and 40 nm for {001}, and 6, 18, 24 and 36 nm for {10−1}. For FIII {001}, the magnitudes are ca. 8, 32 and 40 nm. These values are consistent with the expected integer multiples of the respective dhkl values, as listed in Table 3.6,7,9,45,46 The serrations on the loading segments are more pronounced for FII {10−1} and the residual depth is considerably larger. These observations generally imply that the plastic response of the FII crystal is significantly anisotropic, which is consistent with the anisotropy observed in the thermal expansion measurements. Images of the indentation impressions (ESI†) obtained on both examined faces of FII show material pile-up along two (out of three) edges, whereas pile-up occurs along all three edges of the indents made on FIII {001}. This observation implies that FIII is less anisotropic in terms of plastic flow.| Polymorph | Indented face | d hkl (Å) | Elastic Modulus (E) GPa | Hardness (H) MPa |
|---|---|---|---|---|
| FII | {001} | 4.04 | 8.7 ± 0.32 | 513 ± 42 |
| {10−1} | 6.07 | 8.1 ± 0.34 | 363 ± 18 | |
| FIII | {001} | 8.08 | 10.6 ± 0.36 | 532 ± 29 |
Values of E and H, estimated using the Oliver–Pharr method, are listed in Table 3. Before discussing these properties, it is instructive to note that E reflects the resistance of a material to elastic deformation that recovers fully upon complete unloading (i.e. the shape of the material prior to deformation is completely restored).45,46 For molecular crystals, elasticity is sensitive to the nature and number of the intermolecular interactions.10 On the other hand, H broadly reflects the resistance of a material to plastic deformation that leads to irreversible shape change.45,46 For organic crystals, the presence or absence of facile slip planes in their crystal structures typically determines whether or not they are susceptible to plasticity.47–49 Slip planes are characterised by crystallographic molecular planes with smooth topology, which are often strengthened in-plane by specific interactions such as hydrogen bonds, whereas the inter-planar interactions are weak and hence permit easy and irreversible shear sliding of the planes past each other.50,51
Data presented in Table 3 show that indentation on {001} yields similar H values for both FII and FIII (within the errors of the measurement), but different E values. The loading segment of the curve shows distinct pop-ins, which have also been noted for other polytypic systems, such as aspirin6 and felodipine,7 for indentation perpendicular to the polytypic layers. For the piracetam polymorphs, it is evident from the energy-vector models (Fig. 4) that the interlayer regions parallel to {001} are most likely to act as slip planes due to their topologically flat nature. Hence, indentation on the {001} face results in the maximum shear stress perpendicular to the slip planes. The larger value of E for FIII is nominally consistent with the smaller thermal expansion coefficient along that direction. Both indicate that the edge-to-face interlayer interactions in FIII are stiffer than the face-to-face and edge-to-edge interactions in FII. Indentation on the {10−1} face of FII yielded an E value comparable to that of {001} (within the errors of the measurement), but a significantly smaller value of H. The loading curve of {10−1} also shows slightly less well-defined pop-ins. These observations are consistent with indentation at a smaller angle relative to the suggested interlayer slip planes.
Tabletability
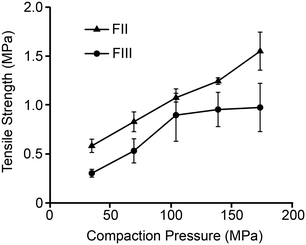
Tabletability, referring to the plot of tablet tensile strength (σc) against compaction pressure, is widely used to estimate materials performance during compression.52 For a given pressure, a material with higher σc is said to have better tabletability. Fig. 8 shows that σc of FII is considerably better than FIII at all the studied compaction pressures and therefore exhibits better tabletability. While σc of both polymorphs increases linearly with F up to 100 MPa, it appears to plateau out for FIII for F > 100 MPa while continuing to increase for FII. Since σc indicates how well the particles bond together mechanically during compaction, the lower E and H of FII facilitate higher contact area between the particles (due to lower stiffness) followed by higher adhesion due to plastic flow. The face-to-face and edge-to-edge alignments of all the piracetam ring planes in form II appears to be the structural reason for the lower E and H in FII. The herringbone type arrangement in the interlayer region of FIII, with edge-to-face alignment of molecules, imparts higher resistance to both elastic and plastic deformations. It is also noteworthy that a higher E could lead to tensile stress development at the particle interfaces during unloading and, in the process, reduce the strength of the tablet. This could be the reason not only for the lower σc in FIII, but also its stagnation at higher compaction pressures.Conclusions
This analysis of the piracetam polytypes produces a plausible link between the crystal structures of FII and FIII, and their established tableting behaviour. Interaction energies and derived energy-vector models give some static indication of the nature of the intermolecular interactions, while thermal expansion measurements add a useful indicator of how the structures respond differently under stress. Alignment of the principal thermal expansion axes with the intermolecular interactions at the interface between the polytypic layers seems especially informative in this example. Nanoindentation measurements confirm the anticipated anisotropic nature of plastic deformation for FII. This analysis of piracetam adds another example to the list of polytypic structures that have been studied, whose close similarity should assist derivation of robust structure–property correlations in this type of (pharmaceutical) molecular materials.Conflicts of interest
There are no conflicts to declare.Acknowledgements
We are grateful to the Danish Council for Independent Research | Natural Sciences (DFF-1323-00122), and to the Department of Pharmacy, University of Copenhagen, for funding this work.Notes and references
- C. C. Sun, J. Pharm. Sci., 2009, 98, 1671 CrossRef CAS.
- C. Sun and D. J. W. Grant, Pharm. Res., 2004, 21, 382 CrossRef CAS.
- A. V. Trask, W. D. S. Motherwell and W. Jones, Cryst. Growth Des., 2005, 5, 1013 CrossRef CAS.
- K. Chow, H. H. Y. Tong, S. Lum and A. H. L. Chow, J. Pharm. Sci., 2008, 97, 2855 CrossRef CAS.
- S. Karki, T. Friščić, L. Fábián, P. R. Laity, G. M. Day and W. Jones, Adv. Mater., 2009, 21, 3905 CrossRef CAS.
- S. Varughese, M. S. R. N. Kiran, K. A. Solanko, A. D. Bond, U. Ramamurty and G. R. Desiraju, Chem. Sci., 2011, 2, 2236 RSC.
- M. K. Mishra, G. R. Desiraju, U. Ramamurty and A. D. Bond, Angew. Chem., Int. Ed., 2014, 53, 13102 CrossRef CAS.
- P. P. Upadhyay and A. D. Bond, CrystEngComm, 2015, 17, 5266 RSC.
- S. Varughese, M. S. R. N. Kiran, U. Ramamurty and G. R. Desiraju, Angew. Chem., Int. Ed., 2013, 52, 2701 CrossRef CAS.
- S. Saha, M. K. Mishra, C. M. Reddy and G. R. Desiraju, Acc. Chem. Res., 2018, 51, 2957 CrossRef CAS.
- C. Wang and C. C. Sun, CrystEngComm, 2020, 22, 1149 RSC.
- L. J. Taylor, D. G. Papadopoulos, P. J. Dunn, A. C. Bentham, N. J. Dawson, J. C. Mitchell and M. J. Snowdon, Org. Process Res. Dev., 2004, 8, 674 CrossRef CAS.
- M. Egart, B. Janković, N. Lah, I. Ilić and S. Srčič, Pharm. Res., 2015, 32, 469 CrossRef CAS.
- M. K. Mishra, P. Sanphui, U. Ramamurty and G. R. Desiraju, Cryst. Growth Des., 2014, 14, 3054 CrossRef CAS.
- J. A. Yadav, K. S. Khomane, S. R. Modi, B. Ugale, R. N. Yadav, C. M. Nagaraja, N. Kumar and A. K. Bansal, Mol. Pharmaceutics, 2017, 14, 866 CrossRef CAS.
- S. Chattoraj, L. Shi, M. Chen, A. Alhalaweh, S. Velaga and C. C. Sun, Cryst. Growth Des., 2014, 14, 3864 CrossRef CAS.
- M. Egart, I. Ilić, B. Janković, N. Lah and S. Srčič, Int. J. Pharm., 2014, 472, 347 CrossRef CAS.
- G. Admiraal, J. C. Eikelenboom and A. Vos, Acta Crystallogr., Sect. B: Struct. Crystallogr. Cryst. Chem., 1982, 38, 2600 CrossRef.
- D. Louer, M. Louer, V. A. Dzyabchenko, V. Agafonov and R. Céolin, Acta Crystallogr., Sect. B: Struct. Sci., 1995, 51, 182 CrossRef.
- R. Céolin, V. Agafonov, D. Louër, V. A. Dzyabchenko, S. Toscani and J. M. Cense, J. Solid State Chem., 1996, 122, 186 CrossRef.
- F. P. A. Fabbiani, D. R. Allan, S. Parsons and C. R. Pulham, CrystEngComm, 2005, 7, 179 RSC.
- F. P. A. Fabbiani, D. R. Allan, W. I. F. David, A. J. Davidson, A. R. Lennie, S. Parsons, C. R. Pulham and J. E. Warren, Cryst. Growth Des., 2007, 7, 1115 CrossRef CAS.
- L. L. DeMatos, A. C. Williams, S. W. Booth, C. R. Petts, D. J. Taylor and N. Blagden, J. Pharm. Sci., 2007, 96, 1069 CrossRef CAS.
- A. Tilborg, D. Jacquemin, B. Norberg, E. Perpete, C. Michaux and J. Wouters, Acta Crystallogr., Sect. B: Struct. Sci., 2011, 67, 499 CrossRef CAS.
- M. Barrett, H. Hao, A. Maher, K. Hodnett, B. Glennon and D. Croker, Org. Process Res. Dev., 2011, 15, 681 CrossRef CAS.
- A. Maher, Å. C. Rasmuson, D. M. Croker and B. K. Hodnett, J. Chem. Eng. Data, 2012, 57, 3525 CrossRef CAS.
- A. Maher, C. C. Seaton, S. Hudson, D. M. Croker, Å. C. Rasmuson and B. K. Hodnett, Cryst. Growth Des., 2012, 12, 6223 CrossRef CAS.
- A. Maher, D. M. Croker, C. C. Seaton, Å. C. Rasmuson and B. K. Hodnett, Cryst. Growth Des., 2014, 14, 3967 CrossRef CAS.
- M.-H. Chambrier, N. Bouhmaida, F. Bonhomme, S. Lebègue, J.-M. Gillet, C. Jelsch and N. E. Ghermani, Cryst. Growth Des., 2011, 11, 2528 CrossRef CAS.
- A. Gavezzotti, New J. Chem., 2011, 35, 1360 RSC.
- C. R. Groom, I. J. Bruno, M. P. Lightfoot and S. C. Ward, Acta Crystallogr., Sect. B: Struct. Sci., Cryst. Eng. Mater., 2016, 72, 171 CrossRef CAS.
- M. J. Cliffe and A. L. Goodwin, J. Appl. Crystallogr., 2012, 45, 1321 CrossRef CAS.
- W. C. Oliver and G. M. Pharr, J. Mater. Res., 1992, 7, 1564 CrossRef CAS.
- W. C. Oliver and G. M. Pharr, J. Mater. Res., 2004, 19, 3 CrossRef CAS.
- M. S. R. N. Kiran, S. Varughese, C. M. Reddy, U. Ramamurty and G. R. Desiraju, Cryst. Growth Des., 2010, 10, 4650 CrossRef CAS.
- M. K. Mishra, K. Mishra, A. Narayan, C. M. Reddy and V. R. Vangala, Cryst. Growth Des., 2020, 20, 6306 CrossRef CAS.
- C. F. Macrae, P. R. Edgington, P. McCabe, E. Pidcock, G. P. Shields, R. Taylor, M. Towler and J. van de Streek, J. Appl. Crystallogr., 2006, 39, 453 CrossRef CAS.
- S. J. Clark, M. D. Segall, C. J. Pickard, P. J. Hasnip, M. J. Probert, K. Refson and M. C. Payne, Z. Kristallogr., 2005, 220, 567 CAS.
- Accelrys, Materials Studio v. 6.0, San Diego, California, USA, 2011 Search PubMed.
- J. P. Perdew, K. Burke and M. Ernzerhof, Phys. Rev. Lett., 1996, 77, 3865 CrossRef CAS.
- S. Grimme, J. Comput. Chem., 2006, 27, 1787 CrossRef CAS.
- A. D. Bond, J. Appl. Crystallogr., 2014, 47, 1777 CrossRef CAS.
- O. V. Shishkin, V. V. Dyakonenko and A. V. Maleev, CrystEngComm, 2012, 14, 1795 RSC.
- M. J. Turner, S. P. Thomas, M. W. Shi, D. Jayatilaka and M. A. Spackman, Chem. Commun., 2015, 51, 3735 RSC.
- M. K. Mishra, U. Ramamurty and G. R. Desiraju, Curr. Opin. Solid State Mater. Sci., 2016, 20, 361 CrossRef CAS.
- U. Ramamurty and J. Jang, CrystEngComm, 2014, 16, 12 RSC.
- C. Sun and D. J. W. Grant, Pharm. Res., 2001, 18, 274 CrossRef CAS.
- P. Upadhyay, K. S. Khomane, L. Kumar and A. K. Bansal, CrystEngComm, 2013, 15, 3959 RSC.
- M. K. Mishra, U. Ramamurty and G. R. Desiraju, J. Am. Chem. Soc., 2015, 137, 1794 CrossRef CAS.
- K. S. Khomane and A. K. Bansal, J. Pharm. Sci., 2013, 102, 4242 CrossRef CAS.
- K. S. Khomane, P. K. More and A. K. Bansal, J. Pharm. Sci., 2012, 101, 2408 CrossRef CAS.
- E. Joiris, P. D. Martino, C. Berneron, A.-M. Guyot-Hermann and J.-C. Guyot, Pharm. Res., 1998, 15, 1122 CrossRef CAS.
Footnotes |
| † Electronic supplementary information (ESI) available: Details of PIXEL calculations, crystal face indexing, calculation of thermal expansion coefficients, AFM images of indentation impressions. See DOI: 10.1039/d0ce01694b |
| ‡ Current address: University of Cambridge, Department of Chemistry, Lensfield Road, Cambridge, CB2 1EW, UK. Email: adb29@cam.ac.uk. |
| § The DFT-D energy-minimised structures also suggest that FIII is more stable than FII, by ca. 1.5 kJ mol−1. |
| This journal is © The Royal Society of Chemistry 2021 |

