 Open Access Article
Tailoring adsorption induced switchability of a pillared layer MOF by crystal size engineering†
Leila
Abylgazina
 a,
Irena
Senkovska
 *a,
Sebastian
Ehrling
 a,
Volodymyr
Bon
 a,
Petko
St. Petkov
 b,
Jack D.
Evans
 a,
Svetlana
Krylova
 c,
Alexander
Krylov
 c and
Stefan
Kaskel
 *a
*a
aChair of Inorganic Chemistry I, Technische Universität Dresden, Bergstrasse 66, 01069 Dresden, Germany. E-mail: irena.senkovska@tu-dresden.de; stefan.kaskel@tu-dresden.de
bFaculty of Chemistry and Pharmacy, University of Sofia, 1126, Sofia, Bulgaria
cKirensky Institute of Physics, Federal Research Center KSC SB RAS, 660036 Krasnoyarsk, Russia
First published on 3rd November 2020
Abstract
The pillared layer framework DUT-8(Zn) (Zn2(2,6-ndc)2(dabco), 2,6-ndc = 2,6-naphthalenedicarboxylate, dabco = 1,4-diazabicyclo-[2.2.2]-octane, DUT = Dresden University of Technology) is a prototypical switchable MOF, showing characteristic adsorption and desorption induced open phase (op) to closed phase (cp) transformation associated with huge changes in cell volume. We demonstrate switchability strongly depends on a framework-specific critical particle size (dcrit). Superposed, the solvent removal process (pore desolvation stress contracting the framework) significantly controls the cp/op ratio after desolvation and, subsequently, the adsorption induced switchability characteristics of the system. After desolvation, the dense cp phase of DUT-8(Zn) shows no adsorption-induced reopening and therefore is non-porous for N2 at 77 K and CO2 at 195 K. However, polar molecules with a higher adsorption enthalpy, such as chloromethane at 249 K and dichloromethane (DCM) at 298 K can reopen the macro-sized crystals upon adsorption. For macro-sized particles, the outer surface energy is negligible and only the type of metal (Zn, Co, Ni) controls the DCM-induced gate opening pressure. The node hinge stiffness increases from Zn to Ni as confirmed by DFT calculations, X-ray crystal structural analysis, and low frequency Raman spectroscopy. This softer Zn-based node hinges and overall increased stabilization of cp vs. op phase shift the critical particle size at which switchability starts to become suppressed to even lower values (dcrit < 200 nm) as compared to the Ni-based system (dcrit ≈ 500 nm). Hence, the three factors affecting switchability (energetics of the empty host, (Eop–Ecp) (I), particle size (II), and desolvation stress (III)) appear to be of the same order of magnitude and should be considered collectively, not individually.
Introduction
Switchable metal–organic frameworks or so-called soft porous crystals1 demonstrate reversible dynamic transformations of the structure under the action of external stimuli such as guest elimination/reintroduction,2 temperature,3 pressure4 or light.5 Most frequently, the phase transition is triggered by adsorption or desorption of guest molecules and activation barriers lead to a hysteresis in the adsorption isotherm.6 Due to their capability to undergo stimulated structural transformations, soft porous crystals are often discussed as materials with huge application potential in gas or liquid separation processes,7 sensor technology,8 and catalysis.9 For the technological development of switchable MOFs in target applications, a fundamental understanding of the role of critical factors influencing and controlling framework switchability is of utmost importance and will provide a platform for tuning the switching characteristics.One of the crucial factors affecting the switchability of MOFs is their structural composition as the metal clusters, organic linker and their connections can form softer or stiffer hinges. The impact of the metal nodes on the switchability of MOF has been previously discussed in the literature. For instance, switchability in the breathable MIL-53 series ([M(OH)(bdc)2]n (M = Cr,10 Al,11 Fe,12 Sc,13 In,14 Ga;15 bdc = benzene-1,4-dicarboxylate) strongly depends on the metal centre. Pillared layer MOFs represent another class of porous coordination frameworks with representative switching transitions.16 DMOFs (dabco MOFs) with the composition [M2(bdc)2(dabco)]n (M = Zn,17 Co,18 Cu,19 Ni20) demonstrate contractive/expansive behaviour during desolvation/resolvation. Structural response can be tuned by modification of linker chemical composition,21 which leads to distinct breathing effects during adsorption of CO2 at 195 K.22
In recent years, several publications appeared reporting the pivotal role of crystal size and morphology on the switchability.23 Downsizing of flexible MOF crystallites to the nanoscale regime can alter their adsorption properties and even generate new intrinsic features differing from the bulk MOFs.24–31 For example, the macrocrystals of the pillared layer compound [Cu2(bdc)2(bipy)]n (bipy = 4,4′-bipyridine) show an open pore (op) to closed pore (cp) structural transition upon guest desorption, while downsized crystals (1 μm) undergo the op to cp transition only after thermal treatment.26
The strong impact of the crystal or grain size on the switching characteristics of the “gate pressure” pillared layer MOF [Ni2(2,6-ndc)2dabco]n, also known as DUT-8(Ni)32 (DUT = Dresden University of Technology) was revealed recently.24 Small DUT-8(Ni) crystals (below 500 nm in size) do not undergo the op to cp transition upon desolvation.24 The same behaviour is also characteristic for submicron-sized crystals of DUT-8(Co).33 The macro-sized crystals of DUT-8(Co), however, do not show any responsivity to nitrogen (at 77 K) or carbon dioxide (at 195 K) during adsorption, in contrast to DUT-8(Ni), that shows pronounced switchability under the same conditions.33 This suggests that the influences of particle size and metal node are interconnected and both aspects change the flexibility characteristics at a similar order of magnitude. Moreover, there may be more factors overlooked in the past, contributing to the phase transition energetics.
In the following, we present a detailed study of the adsorption induced switching of DUT-8(Zn).34 In addition to the influence of the metal node and the particle size, we also demonstrate the influence of solvent molecules in the pores and the subsequent desolvation procedure on the framework response.
Experimental section
Analytical methods
Vapour adsorption of different solvents were performed using BELSORP-max apparatus at 298 K. Prior to the adsorption measurement the samples were evacuated at room temperature for 16 h, besides samples desolvated by means of supercritical carbon dioxide.
Crystal data for as made [Zn2(2,6-ndc)2(dabco)(DMF)x]n (1_op): C30H24O8N2Zn2 (framework only, solvent molecules are omitted), M = 671.25 g mol−1, monoclinic, C2/m (No. 12), a = 19.000(4) Å, b = 18.070(4) Å c = 9.6700(19) Å, β = 95.87(3)°, V = 3302.6(11) Å3, Z = 2, λ = 0.79990 Å, T = 296 K, θmax = 29.996°, reflections/parameter 2895/106, Rint = 0.0988, R1 = 0.1070, wR2 = 0.3048, S = 1.131 largest diff. peak 1.536 e Å−3 and hole −1.445 e Å3.
Crystal data for 1_cp [Zn2(2,6-ndc)2(dabco)]n: C30H24O8N2Zn2, M = 671.25 g mol−1, triclinic, P1 (No. 1), a = 7.1276(12) Å, b = 8.5505(13) Å, c = 13.1270(23) Å, α = 84.148(23)°, β = 116.032(19)°, γ = 108.462(16)°, V = 681.24(56) Å3, Z = 1, λ = 1.54059 Å, T = 296 K, 2θrange = 5–70°, Profile function Thompson–Cox–Hastings, U = 0.4946, V = 0.0066, W = 0.00343, X = 0.4260, Y = 0.1735, refined motion groups/degree of freedom 9/45, Rp = 0.0547, Rwp = 0.0791.
In situ PXRD experiments on 3c in parallel to CO2 adsorption at 195 K were performed on a specialized Empyrean powder X-ray diffractometer (ω–2θ goniometer, K-alpha1 system) using a customized setup based on ARS DE-102 closed cycle helium cryostat, which assured isothermal conditions in the temperature range of 30–300 ± 0.1 K. The adsorption cell is based on 1.33′′ CF-flange and covered with a Beryllium dome. The cell was connected to the low-pressure port of the BELSORP-max volumetric adsorption instrument. The TTL-trigger was used for establishing the communication between BELSORP-max and Empyrean software and ensure the measurement of adsorption isotherm and PXRD pattern data collection in fully automated mode. The diffraction experiments were performed using ω–2θ scans in transmission geometry in the range of 2θ = 2–50°. Parallel linear Cu-Kα1 beam, generated by hybrid 2xGe(220) monochromator, 4 mm mask, and primary divergence and secondary antiscatter slits with ¼° opening were used upon data collection. Pixcel-3D detector in 1D scanning mode (255 active channels) was used. A complete adsorption–desorption physisorption isotherm of carbon dioxide at 195 K was measured on 8.9 mg of sample, statically fixed in the X-ray beam, and PXRD patterns were recorded after equilibration (0.1% of pressure change within 300 s) at selected points of the isotherm in situ by means of an automated dosing procedure of BELSORP-max.
Molecular DFT was used to investigate the stability of the paddle wheel unit. Constraining geometry optimisations were performed using the NWchem 6.3 software package53 with the PBE0 functional54 and a polarized triple-zeta basis set (def2-TZVP).55 Tight convergence criteria were employed. Input files can be found in the data repository of J. D. Evans (https://github.com/jackevansadl/supp-data).
Materials
Zn(NO3)2·6H2O (99%), 2,6-H2ndc (99%), dabco (99%) were purchased from Sigma Aldrich. All solvents were at least of analytical grade, purchased from commercial suppliers and used without further purification.MOF synthesis
An overview of all samples investigated is presented in Fig. 1.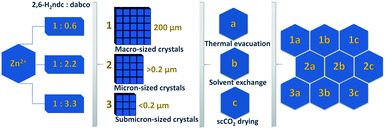 | ||
| Fig. 1 Schematic overview of the DUT-8(Zn) samples synthesised using different precursor concentrations and desolvated under varying activation conditions. | ||
Solvent removal procedure
The first activation procedure applied is the evacuation of the solvent used during the synthesis under reduced pressure at elevated temperature (procedure a). The samples were filtered in an argon flow and DMF was removed in dynamic vacuum at 423 K for 16 hours.Alternatively, the DMF used in the synthesis was exchanged first by a lower boiling point solvent (DCM) during 3 days. Afterwards, it was removed in dynamic vacuum at 423 K for 16 hours (procedure b).
In the third procedure, using supercritical drying (SCD), DMF was exchanged with ethanol several times during 3 days.
The samples were desolvated by supercritical CO2 drying technique, in which ethanol is exchanged with liquid CO2 at high pressure (i.e., >73 atm) during several hours. Afterwards, the sample is heated above the supercritical temperature of CO2 (i.e., 304 K). As a result, the framework is occupied by scCO2, which is then slowly vented (procedure c).
1b: yield: 220 mg, 62% (based on Zn2+). CHN analysis: C30H26O8N2Zn2: calc.: C, 52.325%; H, 3.779%; N, 4.069%; found: C, 52.84%; H, 3.89%; N, 4.15%.
2b: yield 295 mg, 58% (based on Zn2+). CHN analysis: C30H26O8N2Zn2: C, 52.325%; H, 3.779%; N, 4.069%; found: C, 52.92%; H, 3.45%; N, 4.06%.
3c: yield: 350 mg, 69% (based on Zn2+). CHN analysis: C30H26O8N2Zn2: calc.: C, 52.325%; H, 3.779%; N, 4.069%; found: C, 49.63%; H, 4.21%; N, 3.95%.
Results and discussion
Crystal structure of open pore phase
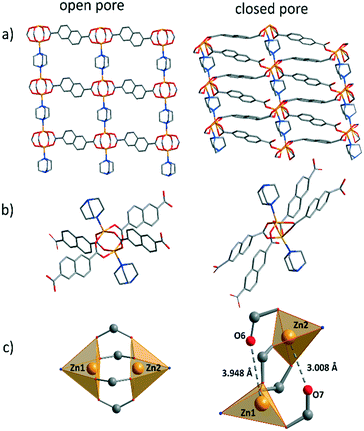
To analyse the crystal structure, as made crystals were subjected to single-crystal X-ray analysis. The structure of DUT-8(Zn) was solved and refined in the monoclinic space group C2/m, which is different from the P4/n reported earlier from Rietveld refinement,34 indicating conformational isomerism also in this compound, as discussed in detail for DUT-8(Ni).56,57 As expected, the overall crystal structure is based on paddle wheel units, which are interconnected by 2,6-naphthalenedicarboxylates (2,6-ndc2−) forming 2D layers, which are further linked by neutral dabco ligands to form a 3D framework with pcu underlying topology (Fig. 2). According to the crystallographic data, Zn⋯Zn distance in 1_op is 2.966 Å, which is significantly longer than in DUT-8(Ni) and DUT-8(Co) (2.653 and 2.691 Å).33 The length of the Zn–N bond is 2.084 Å. The comparison of this value with corresponding M–N bond lengths in DUT-8(Ni) and DUT-8(Co), shows that the value in DUT-8(Zn) is in between. The Zn–Zn–N angle is 178.65°, and comparable with that observed in DUT-8(Ni) (177.59°) (Table S1, ESI†).56Particle size
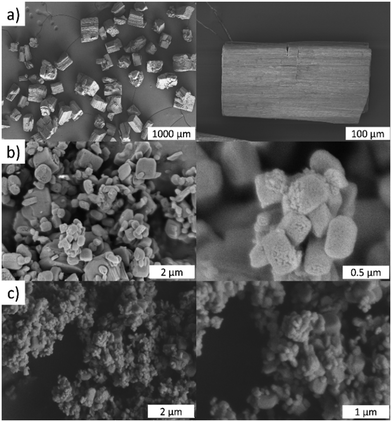
As we have reported for DUT-8(Ni) and DUT-8(Co), the switching characteristics are sensitive to crystal size distribution and it was also expected for DUT-8(Zn). Hence, DUT-8(Zn) was synthesized in three different size regimes: 1 – particles up to 200 μm (macro-sized); 2 – micron-sized particles (0.2–1 μm); and 3 – submicron-sized particles (<0.2 μm) (Fig. 3). As depicted, the average crystallite size of macro-sized system 1 is ca. 200 μm, whereas this value ranges from 0.2 to 1 μm for sample 2. Sample 3 represents the smallest crystal size regime of 0.07–0.2 μm.Powder X-ray diffraction (PXRD) patterns for all as-synthesized crystals are in good agreement with the pattern of DUT-8(Zn) calculated from the crystal structure (Fig. S1, ESI†), indicating that all samples are phase pure.
Thermal analysis
In order to estimate thermal stability of 1–3, thermogravimetric analysis (TGA) was performed in synthetic air flow. Interestingly, the analysis discloses decreasing thermal stability with decreasing size of the crystals.The decomposition of sample 1 starts at 673 K, whereas sample 2 starts to decompose at 653 K already (Fig. S2, ESI†). The decomposition proceeds in both samples in one step. Despite relatively small difference in average particle size between samples 2 and 3, the thermal stability of sample 3 is considerably lower than for 2, showing the first decomposition step starting from 493 K already, presumable associated with the dabco elimination.
Desolvation
The stress acting on the framework during desolvation depends on surface tension and capillary forces imposed on the structure by the liquid- to gas-phase transformation of included solvent molecules, which are high especially when the solvent has a high boiling point and/or high surface tension.58 A common approach to reduce the stress is to exchange the solvent with a low-boiling-point/low-surface-tension solvent (these parameters tend to be correlated) prior to heating the sample under vacuum.59 The most gentle desolvation approach is supercritical drying using carbon dioxide as a working fluid.60 Depending on the guest molecules present in the pore and desolvation technique applied, the forces acting on the framework can be varied61 and indirect information of the relative robustness of the network can be extracted.Activation directly from DMF is mostly successful only for very robust structures. For fragile mesoporous compounds, however, which cannot sustain activation from (N,N-dimethylformadmide) DMF, dichloromethane (DCM) or n-heptane can be used to prevent framework collapse.59
In the flexible compounds, high stress acting during desolvation may contribute to structural contractions. In contrast to stiff systems, which show a framework collapse, switchable MOFs show an adaptive response via phase transformation.
For example, Brammer et al. showed that desolvation of Me2NH2[In(abdc)2]n (SHF-61, abdc = 2-aminobenzene-1,4-dicarboxyliate) from two different solvents (chloroform or DMF/H2O) leads to two polymorphic-activated forms with very different pore openings and markedly different gas-adsorption properties.61 Removal of CHCl3 leads to little change in the host framework, which exhibits a high porosity. Desolvation from DMF/H2O leads to significant framework contraction and a low porosity phase. Interestingly, the framework contraction during desolvation of DMF/H2O is continuous, and partial desolvation produces a partially contracted framework.
It should be mentioned, that in robust MOFs, the diffusion pathway for solvent removal are persistent for the whole activation period, ensuring the continuous movement of guests from the crystal inside to the surface. In flexible compounds, however, where pores are changing their geometry during solvent removal, the residence time of the solvent and the diffusion kinetics through the channels might play an additional crucial role in the activation process and should not be overlooked. The closing of the pores (first order phase transition) may lead to blockage of the diffusion pathways and retained regions with trapped solvent molecules. Therefore, one would expect, that solvents showing high interaction with the framework and possessing high boiling points (such as DMF) should also be more difficult to remove from a kinetic point of view.
In a first series, according to the procedure reported earlier,34 the desolvation of the DUT-8(Zn) crystals was performed by direct removal of DMF (solvent used during the synthesis) in vacuum at 423 K (procedure a). DMF can be considered as a larger molecule among the solvents investigated here, with a kinetic diameter of 5.5 Å, and a very large dipole moment (3.8 D).62 Therefore, both strong attractive interaction between MOF and DMF and slower diffusion rate should be expected.
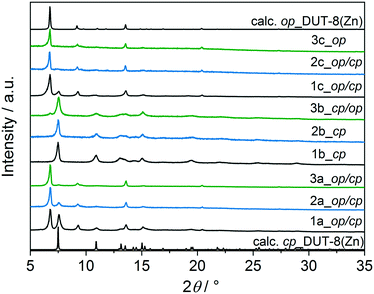
The direct removal of DMF results in a mixture of closed pore (cp) and open pore (op) phases in the sample 1a (Fig. 4), in agreement with results reported in 2012.34 PXRD patterns of 2a and 3a indicate that the major part of the sample remains in the op phase with only an insignificant amount of cp phase. After activation, the samples were dissolved in DCl/D2O and DMSO-d6 mixture, and subjected to NMR analysis to reveal residual DMF molecules in the framework (Fig. S3, ESI†).
In order to reduce the stress during solvent removal, DMF was exchanged with dichloromethane before desolvation under reduced pressure at 423 K during 16 h (procedure b). DCM is a molecule with a smaller kinetic diameter (4.70 Å),63 smaller dipole moment (1.62 D)64 and low boiling point (312.6 K), therefore, in comparison to DMF, it should be easier to remove. According to PXRD (Fig. 4), the desolvation of the macro-sized 1b and micron-sized crystals 2b triggers the structural transformation from op to cp phase, in which the framework undergoes a significant shearing to minimize the amount of void space. The submicron-sized crystals 3b show mainly the cp phase with a small amount of op phase.
To further reduce the stress on the framework, all samples were subjected to supercritical CO2 drying after washing several times with ethanol (Fig. 4). In this case, the macro-sized particles 1c yield a mixture of op and cp phases, the fraction of the cp phase in micron-sized particles 2c is very small, and submicron-sized particles 3c completely remain the original op phase, as observed for as-synthesized form. This indicates the robustness of the system under supercritical CO2 activation conditions.
Comparing the structural response of DUT-8(Zn) towards different desolvation techniques, it may be hypothesized that the energy barrier for framework closing increases with decreasing particle size (Fig. 5). The small particles can rest in the metastable desolvated op state while the large particles transform into the thermodynamically preferable cp state. For scCO2 the desorption stress is so small that the transformation of largest particles is incomplete. Contrastingly, the deformation stress of DCM is larger resulting in the smallest particles to transform almost completely.
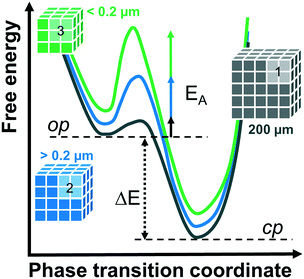 | ||
| Fig. 5 Schematic representation of the energy diagrams for phase transitions from the op to cp phase depending on particle size. | ||
The results of activation from DMF, however are rather unexpected. The surface tension and capillary forces are expected to be higher for DMF than for DCM and, therefore, support the closing, which is not the case. There are likely differences in the diffusion rates, which can also play a role.
Structure of the closed pore phase
Since the quality of the single crystals after solvent removal was not sufficient to collect a high quality dataset, a structural model was refined against powder X-ray diffraction data in a triclinic space group (Fig. S4, ESI†). The main cluster deformation is reflected in the change of M⋯M and M–O distances. The Zn atoms move apart, resulting in a change of the Zn⋯Zn distance from 2.97 (in the op) to 3.80 Å (in the cp) (Table S1, ESI†), which leads to a strong elongation of some Zn–O bonds (Fig. 2). In the cause of that the coordination polyhedron changes from quadratic pyramidal to distorted tetrahedral, since two Zn–O bonds are disintegrated.65Adsorption characteristics
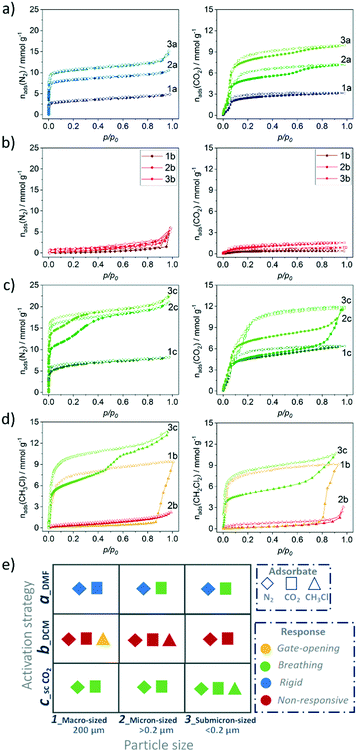
Switching transformations from closed to open pore phases and vice versa induced by adsorption stimuli and their dependence on the crystal size was previously studied in isomorphous DUT-8(Ni) and DUT-8(Co) systems, revealing striking differences in adsorption behaviour, due to characteristic differences in framework's elastic response.33 The underlying electronic differences, in case of Ni, Co and Zn should be reflected in closing/opening characteristics of respective MOFs. Indeed, the DUT-8(Zn) samples demonstrate pronounced differences in their adsorption isotherms compared to the Co and Ni analogues. Since the solvent removal techniques described above produce samples with varying ratio of op/cp phases, and the exact ratio is difficult to extract from PXRD patterns, we evaluated the porosity and structural response of all samples by means of adsorption of nitrogen at 77 K, carbon dioxide at 195 K, and chloromethanes at 249–298 K.The adsorption of CO2 at 195 K (Fig. 6a and 8), a guest with higher adsorption enthalpy, demonstrates some structural dynamics. However, the presence of mixed phases in the samples makes it difficult to interpret the data. The XRD patterns collected after adsorption reveal a slightly increased amount of the cp phase in comparison to the samples before experiments in case of 2a and 3a. This fact is pointing toward a possible breathing mechanism of the op phase during the adsorption/desorption cycle (Fig. S5, ESI).†
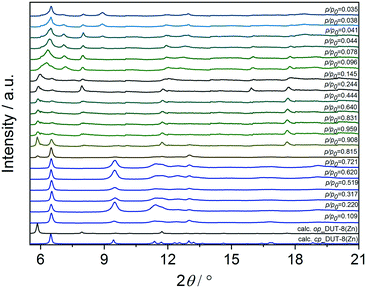
To analyse the structural phases induced by CH3Cl adsorption, parallelised adsorption/diffraction experiments were performed on sample 1b at KMC-2 beamline of BESSY II synchrotron (Fig. 7 and S6 ESI†). In the pre-gate region of the isotherm, the analysis of the PXRDs indicated the existence of pure cp phase. At p/p0 = 0.815 the pattern indicates a first order transition of the structure from nonporous cp to porous op phase without appearance of any intermediate phases. PXRD patterns measured at saturation at p/p0 = 0.959 (the highest pressure reached) and upon desorption of chloromethane until “gate closing” show coexistence of cp and op phases. The intensity of reflections belonging to op phase is strongly influenced by strong absorption and diffuse scattering, attributed to adsorbed chloromethane.
The effect is nicely seen in the PXRDs measured upon “gate closing” at p/p0 between 0.14 and 0.24, in which reduction of CH3Cl amount in the pores significantly increases the intensity of the op phase reflections.
Further desorption of the CH3Cl from the pores induces a phase transition to an intermediate phase (ip) in the range of p/p0 = 0.09–0.03.
The first reflection at 2θ = 6.5° could correspond to the cp phase, however a few additional reflections appear at 2θ = 7.05, 8.05 and 8.95° that are not attributed to op or cp phases. However, severe peak broadening and limited number of reflections hinders quantitative analysis of the PXRD patterns. In contrast to CH2Cl2, CHCl3 and CCl4 are unable to initiate the switching for 2b or for 1b at 298 K (Fig. S7, ESI†). The adsorption enthalpies for CHCl3 and CCl4 may be expected to be higher, than for CH3Cl and CH2Cl2. However, as the size differs considerably, significant differences in maximal loadings per formula unit of MOF (nmax) can be estimated (Table 1).63
Hence, the total adsorption energy (nmax·Eads) per Zn2(2,6-ndc)2dabco formula unit (fu) of MOF decreases continuously from chloromethane to tetrachloromethane (Tab. 1). This provides an energetic reason for the absence of structural response CHCl3 and CCl4. In addition, the smaller kinetic diameter also favours adsorption kinetics and a reduced activation barrier can be expected to be lower for CH3Cl and CH2Cl2.
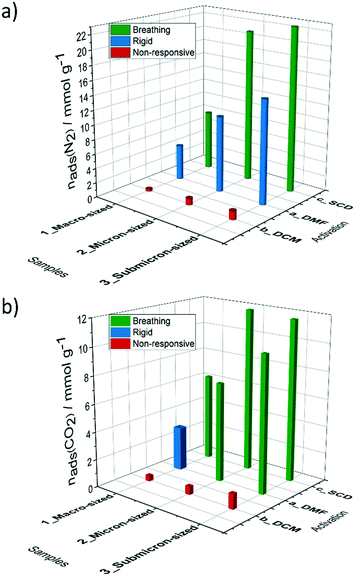 | ||
| Fig. 8 Comparison of a) nitrogen (77 K) and b) carbon dioxide (195 K) uptake and structural response depending on particle size and activation strategy. | ||
In order to provide insight into this breathing mechanism, in situ experiments were performed during CO2 adsorption at 195 K on SCD submicron-sized sample 3c (Fig. S8, ESI†). Micropore filling occurs at low relative pressure. Starting from p/p0= 0.128 in the adsorption branch, the small additional peaks appear in the PXRD patterns, that are attributed to formation of the cp phase. The cp phase is visible in the in situ data in all patterns collected at relative pressures higher than 0.128 and in desorption branch, up to p/p0= 0.061.
At the last point measured at p/p0 = 0.009, some residual amount of the cp phase is present. We can conclude, that during the adsorption of carbon dioxide, breathing of the structure occurs, suggesting a more labile paddle wheel is present, in comparison to the Ni and Co analogues that show type I adsorption isotherm without any signs of switchability.33 An important observation is that the critical size for DUT-8(Zn), which suppress switchability is considerably smaller (<200 nm), compared to DUT-8(Ni) (<500 nm) and DUT-8(Co).33 In addition, reduced desorption stress is needed, since the pure op phase could be achieved only by SCD activation. In contrast, the submicron-sized particles of DUT-8(Ni) and DUT-8(Co) withstand the removal of DCM under vacuum.
Spectroscopic investigations
In order to characterize the open pore phase, “as made” samples of DUT-8(Zn) in DMF were investigated first.
The characteristic band appears at 23 cm−1 for macro-sized sample (Fig. S9a, ESI†). The obtained characteristic lattice vibration bands values for DUT-8(Zn), DUT-8(Ni) and DUT-8(Co) are almost the same.33,68
The desolvated sample 1b in the closed pore form were analysed, demonstrating two bands at 25.9 and 44.3 cm−1 (Fig. 9 and S9b, ESI†). The appearance of the second lattice vibration mode in the spectrum is obviously attributed to the drastic changes in the environment of the Zn atoms in the cp state, facilitating additional vibration modes of the framework constituents.
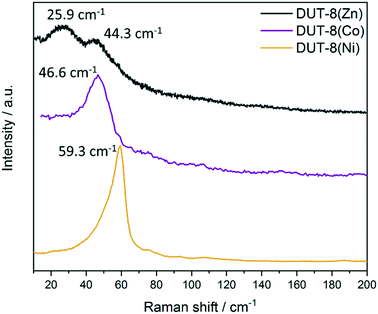 | ||
| Fig. 9 The low frequency of Raman spectra of desolvated sample 1b DUT-8(Zn) in comparison with DUT-8(Ni) and DUT-8(Co). | ||
The decrease in frequency for the closed pore phase from 59.3 and 46.6 cm−1 for DUT-8(Ni) and DUT-8(Co), respectively, to 44.3 cm−1 for DUT-8(Zn) indicates that the force constant for DUT-8(Zn) cp framework is lower compared to Co. However, the difference between Co and Ni (4 cm−1) is more pronounced as for Co and Zn (2 cm−1).
Interestingly, the differences in the force constants are directly reflected in the gate opening pressure (pgo) upon DCM adsorption.
The closed pore phase of DUT-8(Ni), characterized by the highest force constant in the Ni, Co, Zn series, show the opening at ca. 9 kPa and the Co based variant at 34 kPa (difference of 25 kPa) (Fig. S10, ESI†). The pgo for cp phase of DUT-8(Zn) shifts to 44 kPa (difference between Co and Zn of 10 kPa), showing a systematic relation between the difference in the position of the peak in the Raman spectra and differences in relative gate opening pressure in DCM adsorption at 298 K.
Furthermore, it is observed that the scissor deformation (δ(COO)oop) is slightly affected by the present phase.
In the cp phase the vibration can be observed at 806 cm−1 and in the op phase at 813 cm−1. No differences were found in asymmetric vibrations of the dabco molecule in 2b and 3c (1057 cm−1 for op and cp phases).
Comparing the spectra of the cp phases of DUT-8(Ni), DUT-8(Co) and DUT-(Zn) (Fig. S11b and c, ESI†), one can see, that despite the stronger cluster deformation observed from crystallographic data for DUT-8(Zn) compound, the vibrations of the carboxylates (COO−) in the recorded range are not significantly influenced, i.e. the asymmetric stretching vibration is at 1602 cm−1, the symmetric stretching at 1467 cm−1. The scissor deformation is more affected, since this appears at 816 cm−1 for Ni, at 802 cm−1 for Co and at 806 cm−1 for Zn.
Asymmetric vibrations are not influenced by metal node (1056 cm−1 for all compounds). The symmetric stretching vibrations of NC3 are sensitive to metal and the positions of the bands differ (Zn: 779 cm−1, Co: 776 cm−1, Ni: 769 cm−1, Fig. S11b and c, ESI†).
DFT simulations
First, atomistic simulation was applied to the paddle wheel unit to capture the behaviour of the molecular hinge present in the frameworks. Constrained geometric optimisations of a representative paddle wheel were performed, where the N–Zn–Zn and Zn–Zn–N angles were fixed and subsequently scanned for angles between 180° and 150° (Table S3, ESI†). In contrast to the previous reports for Ni, Co and combination of both metals in the paddle wheel,33,69 the minimum energy configuration for the Zn paddle wheel is observed at 180°. Deformation of this unit to angles associated with the cp phase (approx. 155°) did not produce decomposition of the paddle wheel and requires almost 6 kJ mol−1. This apparent rigidity of the Zn paddle wheel unit in the op phase is not reflected experimentally, suggesting that framework interactions and a more complex deformation mode are required to reproduce the transitions present in DUT-8(Zn).The geometry of DUT-8(Zn) in the op and the cp phase was subject to energy minimization in periodic boundary conditions, using a unit cell of one Zn paddle wheel (PW) unit, two 2,6-ndc ligands, and one dabco pillar. During the energy minimization the cell shape, volume, and atomic positions were relaxed. The geometry of the cp phase was obtained starting from op phase after NPT MD simulation at 300 K and 1 atm pressure. The MD simulation performed in a fully flexible cell resulted in spontaneous op–cp transformation of the DUT-8(Zn) in 2 ps. Key interatomic distances and angles for op and cp phase are collected in Table S4.† We observe good agreement between the experimental and calculated geometry parameters. The calculated interatomic distances show, in line with experimental data, that upon closure the Zn paddle wheel undergoes significant structural deformation in comparison to DUT-8(Ni) and DUT-8(Co).33 The Zn⋯Zn distance elongates by 0.97 Å, from 2.82 in op to 3.79 in the cp phase. Another notable deformation in the Zn PW is the Zn–O distances. From the analysis of the MD trajectories (Fig. S13b, ESI†) is visible that two of the total eight Zn–O distances in the Zn-PW are significantly elongated upon closure. In the minimized geometry of the cp phase, two Zn–O distances are elongated up to 3.78 and 3.61 Å, while the other six Zn–O distances are much smaller affected, 2.01–2.11 Å. Such deformation in the Zn-PW is responsible for the much smaller strain in the closed phase in comparison to DUT-8(Ni). The strain energy for DUT-8(Ni), where the Ni-PW stays intact upon closure, was calculated to be +102 kJ mol−1, while for DUT-8(Zn) it is +78 kJ mol−1 (Table S5†) due to the Zn-PW partial distortion. On the other hand, the contribution from the dispersion interaction between 2,6-ndc linkers is very similar for DUT-8(Ni) and DUT-8(Zn), −188 kJ mol−1, and −181 kJ mol−1, respectively, leading overall to a higher stabilization of the cp vs. op phase for DUT-8(Zn) (−104 kJ mol−1) in comparison with DUT-8(Ni) (−86 kJ mol−1). These findings suggest that framework dynamics for DUT-8(Zn) and DUT-8(Ni) are dominated by the strain in the framework related to the stiffness of the paddle wheel hinge.
Summary
The critical particle size suppressing switchability in soft porous crystals is not identical for all MOFs but depends on the stiffness of the deforming building blocks, in case of DUT-8(M), the chemical composition of the paddle wheel hinges. For DUT-8(Zn), the smaller strain energy of the node results in a magnitude higher energy difference of the empty op and cp hosts (ΔE = Eop−Ecp), as compared to DUT-8(Ni), resulting in a smaller critical particle size (higher surface energy) required to suppress switchability. This was demonstrated by studying particles of three size regimes: larger than 200 μm (macro-sized), in the range of 0.2–1 μm (micron-sized) and smaller than 0.20 μm (submicron-sized).Crystallites of different size regimes behave also differently upon removal of the guest molecules. Removal of dichloromethane in vacuum at elevated temperature causes high desorption stress favouring the formation of thermodynamically stable phases as the phase transition to the closed pore phase is observed for macro- and micron-sized particles, whereas only for submicron-sized particles a mixture of cp/op phases was obtained. The application of mild supercritical drying favours the formation of metastable op phases: the macro-sized particles show a phase mixture of op and cp phases, whereas the micron and submicron sized particles remain in the metastable open pore phase.
The dense cp phase of DUT-8(Zn) shows no adsorption-induced pore opening for N2 at 77 K and CO2 at 195 K. The higher interaction energies of chloromethane at 249 K and dichloromethane at 298 K allow reopening of the macro-sized crystals upon adsorption, but not the smaller particles. This could indicate an intermediate particle size regime, in which the crystals close as monodomain crystals, without twinning, hence the lack of defects may be responsible for the barrier to reopen the structure.24,70
For macro-sized particles with negligible surface energy the influence of metal in the Ni, Co, Zn series (and associated differences in the softness of the paddle wheel in the cp phase) are clearly detected in the adsorption of DCM. The gate opening pressure shifts to the higher values from Ni to Zn, showing a growing kinetic barrier, the softening of the framework in the cp state and higher energy difference between op and cp structures.
Conflicts of interest
There are no conflicts to declare.Acknowledgements
The authors thank the DFG (FOR 2433 MOF Switches, Project No. 279409724) for financial support. P.P. and J. D. E. thank Center for Information Services and High Performance Computing (ZIH) at TU Dresden for providing high-performance computing facilities. Authors acknowledge Helmholtz-Zentrum Berlin für Materialien und Energie for allocated beamtime at KMC-2 and MX14.2 beamlines. J. D. E. acknowledges the support of the Alexander von Humboldt foundation and HPC platforms provided by a GENCI grant (A0070807069).References
- S. Horike, S. Shimomura and S. Kitagawa, Nat. Chem., 2009, 1, 695 CrossRef CAS.
- S. K. Elsaidi, M. H. Mohamed, D. Banerjee and P. K. Thallapally, Coord. Chem. Rev., 2018, 358, 125 CrossRef CAS.
- A. Boutin, D. Bousquet, A. U. Ortiz, F.-X. Coudert, A. H. Fuchs, A. Ballandras, G. Weber, I. Bezverkhyy, J.-P. Bellat, G. Ortiz, G. Chaplais, J.-L. Paillaud, C. Marichal, H. Nouali and J. Patarin, J. Phys. Chem. C, 2013, 117, 8180 CrossRef CAS.
- J. Wieme, S. M. J. Rogge, P. G. Yot, L. Vanduyfhuys, S.-K. Lee, J.-S. Chang, M. Waroquier, G. Maurin and V. Van Speybroeck, J. Mater. Chem. A, 2019, 7, 22663 RSC.
- R. Lyndon, K. Konstas, B. P. Ladewig, P. D. Southon, P. C. J. Kepert and M. R. Hill, Angew. Chem., Int. Ed., 2013, 52, 3695 CrossRef CAS.
- S. Krause, N. Hosono and S. Kitagawa, Angew. Chem., Int. Ed., 2020, 59, 15325 CrossRef CAS.
- Z. Chang, D. H. Yang, J. Xu, T. L. Hu and X. H. Bu, Adv. Mater., 2015, 27, 5432 CrossRef CAS.
- A. Chidambaram and K. C. Stylianou, Inorg. Chem. Front., 2018, 5, 979 RSC.
- D. Yang and B. C. Gates, ACS Catal., 2019, 9, 1779 CrossRef CAS.
- F. Millange, C. Serre and G. Férey, Chem. Commun., 2002, 822 RSC.
- T. Loiseau, C. Serre, C. Huguenard, G. Fink, F. Taulelle, M. Henry, T. Bataille and G. Férey, Chem. – Eur. J., 2004, 10, 1373 CrossRef CAS.
- F. Millange, N. Guillou, R. I. Walton, J.-M. Grenèche, I. Margiolaki and G. Férey, Chem. Commun., 2008, 4732 RSC.
- J. P. S. Mowat, V. R. Seymour, J. M. Griffin, S. P. Thompson, A. M. Z. Slawin, D. Fairen-Jimenez, T. Düren, S. E. Ashbrook and P. A. Wright, Dalton Trans., 2012, 41, 3937 RSC.
- E. V. Anokhina, M. Vougo-Zanda, X. Wang and A. J. Jacobson, J. Am. Chem. Soc., 2005, 127, 15000 CrossRef CAS.
- C. Volkringer, T. Loiseau, N. Guillou, G. Férey, E. Elkaïm and A. Vimont, Dalton Trans., 2009, 2241 RSC.
- F. ZareKarizi, M. Joharian and A. Morsali, J. Mater. Chem. A, 2018, 6, 19288 RSC.
- D. N. Dybtsev, H. Chun and K. Kim, Angew. Chem., Int. Ed., 2004, 43, 5033 CrossRef CAS.
- H. Wang, J. Getzschmann, I. Senkovska and S. Kaskel, Microporous Mesoporous Mater., 2008, 116, 653 CrossRef CAS.
- K. Seki and J. B. W. Mori, J. Phys. Chem. B, 2002, 106, 1380 CrossRef CAS.
- P. Maniam and N. Stock, Inorg. Chem., 2011, 50, 5085 CrossRef CAS.
- S. Henke, A. Schneemann and R. A. Fischer, Adv. Funct. Mater., 2013, 23, 5990 CrossRef CAS.
- S. Henke, A. Schneemann, A. Wütscher and R. A. Fischer, J. Am. Chem. Soc., 2012, 134, 9464 CrossRef CAS.
- S. Furukawa, J. Reboul, S. Diring, K. Sumida and S. Kitagawa, Chem. Soc. Rev., 2014, 43, 5700 RSC.
- H. Miura, V. Bon, I. Senkovska, S. Ehrling, S. Watanabe, M. Ohba and S. Kaskel, Dalton Trans., 2017, 46, 14002 RSC.
- S. Krause, V. Bon, I. Senkovska, D. M. Többens, D. Wallacher, R. S. Pillai, G. Maurin and S. Kaskel, Nat. Commun., 2018, 9, 1573 CrossRef.
- Y. Sakata, S. Furukawa, M. Kondo, K. Hirai, N. Horike, Y. Takashima, H. Uehara, N. Louvain, M. Meilikhov, T. Tsuruoka, S. Isoda, W. Kosaka, O. Sakata and S. Kitagawa, Science, 2013, 339, 193 CrossRef CAS.
- X. Cheng, A. Zhang, K. Hou, M. Liu, Y. Wang, C. Song, G. Zhang and X. Guo, Dalton Trans., 2013, 42, 13698 RSC.
- T. Omiya, K. Sasaki, Y. Uchida and N. Nishiyama, ACS Appl. Nano Mater., 2018, 1, 3779 CrossRef CAS.
- S. Tanaka, K. Fujita, Y. Miyake, M. Miyamoto, Y. Hasegawa, T. Makino, S. Van der Perre, J. Cousin Saint Remi, T. Van Assche, G. V. Baron and J. F. M. Denayer, J. Phys. Chem. C, 2015, 119, 28430 CrossRef CAS.
- T. Tian, M. T. Wharmby, J. B. Parra, C. O. Ania and D. Fairen-Jimenez, Dalton Trans., 2016, 45, 6893 RSC.
- S. Krause, V. Bon, H. Du, R. E. Dunin-Borkowski, U. Stoeck, I. Senkovska and S. Kaskel, Beilstein J. Nanotechnol., 2019, 10, 1737 CrossRef CAS.
- N. Klein, C. Herzog, M. Sabo, I. Senkovska, J. Getzschmann, S. Paasch, M. R. Lohe, E. Brunner and S. Kaskel, Phys. Chem. Chem. Phys., 2010, 12, 11778 RSC.
- S. Ehrling, I. Senkovska, V. Bon, J. D. Evans, P. Petkov, Y. Krupskaya, V. Kataev, T. Wulf, A. Krylov, A. Vtyurin, S. Krylova, S. Adichtchev, E. Slyusareva, M. S. Weiss, B. Büchner, T. Heine and S. Kaskel, J. Mater. Chem. A, 2019, 7, 21459 RSC.
- N. Klein, H. C. Hoffmann, A. Cadiau, J. Getzschmann, M. R. Lohe, S. Paasch, T. Heydenreich, K. Adil, I. Senkovska, E. Brunner and S. Kaskel, J. Mater. Chem., 2012, 22, 10303–10312 RSC.
- U. Mueller, R. Förster, M. Hellmig, F. U. Huschmann, A. Kastner, P. Malecki, S. Pühringer, M. Röwer, K. Sparta, M. Steffien, M. Ühlein, P. Wilk and M. S. Weiss, Eur. Phys. J. Plus, 2015, 130, 141 CrossRef.
- T. G. G. Battye, L. Kontogiannis, O. Johnson, H. R. Powell and A. G. W. Leslie, Acta Crystallogr., Sect. D: Biol. Crystallogr., 2011, 67, 271 CrossRef CAS.
- K. M. Sparta, M. Krug, U. Heinemann, U. Mueller and M. S. Weiss, J. Appl. Crystallogr., 2016, 49, 1085 CrossRef.
- G. Sheldrick, Acta Crystallogr., Sect. C: Struct. Chem., 2015, 71, 3 Search PubMed.
- A. Spek, Acta Crystallogr., Sect. C: Struct. Chem., 2015, 71, 9 CrossRef CAS.
- V. Bon, N. Klein, I. Senkovska, A. Heerwig, J. Getzschmann, D. Wallacher, I. Zizak, M. Brzhezinskaya, U. Mueller and S. Kaskel, Phys. Chem. Chem. Phys., 2015, 17, 17471 RSC.
- Materials Studio 5.0, Accelrys Software Inc, San Diego, California, USA, 2009 Search PubMed.
- D. M. Többens and S. Zander, Journal of Large-Scale Research Facilities, 2016, 2, A49 CrossRef.
- A. Schneemann, V. Bon, I. Schwedler, I. Senkovska, S. Kaskel and R. A. Fischer, Chem. Soc. Rev., 2014, 43, 6062 RSC.
- M. Wojdyr, J. Appl. Crystallogr., 2010, 43, 1126 CrossRef CAS.
- J. VandeVondele, M. Krack, F. Mohamed, M. Parrinello, T. Chassaing and J. Hutter, Comput. Phys. Commun., 2005, 167, 103 CrossRef CAS.
- G. Lippert, J. Hutter and M. Parrinello, Mol. Phys., 1997, 92, 477 CrossRef CAS.
- J. P. Perdew, K. Burke and M. Ernzerhof, Phys. Rev. Lett., 1996, 77, 3865 CrossRef CAS.
- S. Goedecker, M. Teter and J. Hutter, Phys. Rev. B, 1996, 54, 1703 CrossRef CAS.
- C. Hartwigsen, S. Goedecker and J. Hutter, Phys. Rev. B, 1998, 58, 3641 CrossRef CAS.
- M. Krack, Theor. Chem. Acc., 2005, 114, 145 Search PubMed.
- J. VandeVondele and J. Hutter, J. Chem. Phys., 2003, 118, 4365 CrossRef CAS.
- S. Grimme, J. Antony, S. Ehrlich and H. Krieg, J. Chem. Phys., 2010, 132, 154104 CrossRef.
- M. Valiev, E. J. Bylaska, N. Govind, K. Kowalski, T. P. Straatsma, H. J. J. Van Dam, D. Wang, J. Nieplocha, E. Apra, T. L. Windus and W. A. de Jong, Comput. Phys. Commun., 2010, 181, 1477 CrossRef CAS.
- C. Adamo and V. Barone, J. Chem. Phys., 1999, 110, 6158 CrossRef CAS.
- F. Weigend, Phys. Chem. Chem. Phys., 2006, 8, 1057 RSC.
- P. S. Petkov, V. Bon, C. L. Hobday, A. B. Kuc, P. Melix, S. Kaskel, T. Düren and T. Heine, Phys. Chem. Chem. Phys., 2019, 21, 674 RSC.
- S. Ehrling, E. M. Reynolds, V. Bon, I. Senkovska, T. E. Gorelik, M. Mendt, M. S. Weiss, A. Poeppl, E. Brunner, U. Kaiser, A. Goodwin and S. Kaskel, Adaptive Response of a Metal–organic Framework Through Reversible Disorder–disorder Transitions, 2020, DOI:10.26434/chemrxiv.12326165.v1.
- J. E. Mondloch, M. J. Katz, N. Planas, D. Semrouni, L. Gagliardi, J. T. Hupp and O. K. Farha, Chem. Commun., 2014, 50, 8944 RSC.
- A. J. Howarth, A. W. Peters, N. A. Vermeulen, T. C. Wang, J. T. Hupp and O. K. Farha, J. Mater. Chem., 2017, 29, 26 CrossRef CAS.
- A. P. Nelson, O. K. Farha, K. L. Mulfort and J. T. Hupp, J. Am. Chem. Soc., 2009, 131, 458 CrossRef CAS.
- E. J. Carrington, C. A. McAnally, A. J. Fletcher, S. P. Thompson, M. Warren and L. Brammer, Nat. Chem., 2017, 9, 882 CrossRef CAS.
- J. E. ten Elshof, C. R. Abadal, J. Sekulić, S. R. Chowdhury and D. H. A. Blank, Microporous Mesoporous Mater., 2003, 65, 197 CrossRef CAS.
- P. Melix and T. Heine, J. Phys. Chem. C, 2020, 124, 11985 CrossRef CAS.
- J.-R. Li, R. J. Kuppler and H.-C. Zhou, Chem. Soc. Rev., 2009, 38, 1477 RSC.
- S. Bureekaew, S. Amirjalayer and R. Schmid, J. Mater. Chem., 2012, 22, 10249 RSC.
- G. A. Miller and R. B. Bernstein, J. Phys. Chem., 1959, 63, 710 CrossRef CAS.
- D. Zahn and J. Anwar, Chem. – Eur. J., 2011, 17, 11186 CrossRef CAS.
- A. Krylov, A. Vtyurin, P. Petkov, I. Senkovska, M. Maliuta, V. Bon, T. Heine, S. Kaskel and E. Slyusareva, Phys. Chem. Chem. Phys., 2017, 19, 32099 RSC.
- S. Ehrling, M. Mendt, I. Senkovska, J. D. Evans, V. Bon, P. Petkov, C. Ehrling, F. Walenszus, A. Pöppl and S. Kaskel, J. Mater. Chem., 2020, 32, 5670 CrossRef CAS.
- S. M. J. Rogge, M. Waroquier and V. Van Speybroeck, Nat. Commun., 2019, 10, 4842 CrossRef.
- N. Kavoosi, V. Bon, I. Senkovska, S. Krause, C. Atzori, F. Bonino, J. Pallmann, S. Paasch, E. Brunner and S. Kaskel, Dalton Trans., 2017, 46, 4685–4695 RSC.
Footnote |
| † Electronic supplementary information (ESI) available: Rietveld plots, SEM images, thermogravimetric analysis, gas adsorption data, PXRD patterns, vapour adsorption data, heat of adsorption determination, crystallographic figures, IR spectra, Raman spectra, spin related cluster and framework optimization, simulated UV-vis spectra. CCDC 2020029 and 2020030. For ESI and crystallographic data in CIF or other electronic format see DOI: 10.1039/d0ce01497d |
| This journal is © The Royal Society of Chemistry 2021 |

