
 Open Access Article
 This Open Access Article is licensed under a Creative Commons Attribution-Non Commercial 3.0 Unported Licence
What's all the phos about? Insights into the phosphorylation state of the RNA polymerase II C-terminal domain via mass spectrometry
Blase M.
LeBlanc
 a,
R. Yvette
Moreno
a,
Edwin E.
Escobar
b,
Mukesh Kumar
Venkat Ramani
a,
Jennifer S.
Brodbelt
b and
Yan
Zhang
*ac
a,
R. Yvette
Moreno
a,
Edwin E.
Escobar
b,
Mukesh Kumar
Venkat Ramani
a,
Jennifer S.
Brodbelt
b and
Yan
Zhang
*ac
aDepartment of Molecular Biosciences, University of Texas, Austin, USA. E-mail: jzhang@cm.utexas.edu
bDepartment of Chemistry, University of Texas, Austin, USA
cInstitute of Cellular and Molecular Biology, University of Texas, Austin, USA
First published on 3rd June 2021
Abstract
RNA polymerase II (RNAP II) is one of the primary enzymes responsible for expressing protein-encoding genes and some small nuclear RNAs. The enigmatic carboxy-terminal domain (CTD) of RNAP II and its phosphorylation state are critically important in regulating transcription in vivo. Early methods of identifying phosphorylation on the CTD heptad were plagued by issues of low specificity and ambiguous signals. However, advancements in the field of mass spectrometry (MS) have presented the opportunity to gain new insights into well-studied processes as well as explore new frontiers in transcription. By using MS, residues which are modified within the CTD heptad and across repeats are now able to be pinpointed. Likewise, identification of kinase and phosphatase specificity towards residues of the CTD has reached a new level of accuracy. Now, MS is being used to investigate the crosstalk between modified residues of the CTD and may be a critical technique for understanding how phosphorylation plays a role in the new LLPS model of transcription. Herein, we discuss the development of various MS techniques and evaluate their capabilities. By highlighting the pros and cons of each technique, we aim to provide future investigators with a comprehensive overview of how MS can be used to investigate the complexities of RNAP-II mediated transcription.
Introduction
Among the three RNA polymerases in eukaryotes, RNA polymerase II (RNAP II) is responsible for the expression of protein-coding genes as well as some small nuclear RNAs.1 Compared to RNA polymerases I and III, the C-terminal domain (CTD) of the largest subunit of RNAP II, RPB1, has a unique sequence of seven repeating residues, of which the number of repeats may differ depending on species.2 Even though this domain seems dispensable for the catalytic activity of RNAP II, the lack of it leads to death in otherwise healthy cells.3 The seven residues of the CTD are highly conserved across species, but some variation deviating from the consensus sequence exists in certain species.4 The boundary of the repeat is conventionally defined as Y1S2P3T4S5P6S7 (Fig. 1).2 Whereas Y1 is the most conserved residue of the heptads, the S7 residue is frequently exchanged with other residues. For example, the first 26 repeats (proximal region) of the human RNAP II CTD closely follow the consensus sequence, but the last 26 residues (distal region) deviate from the consensus sequence typically by replacement of the 7th serine residue.2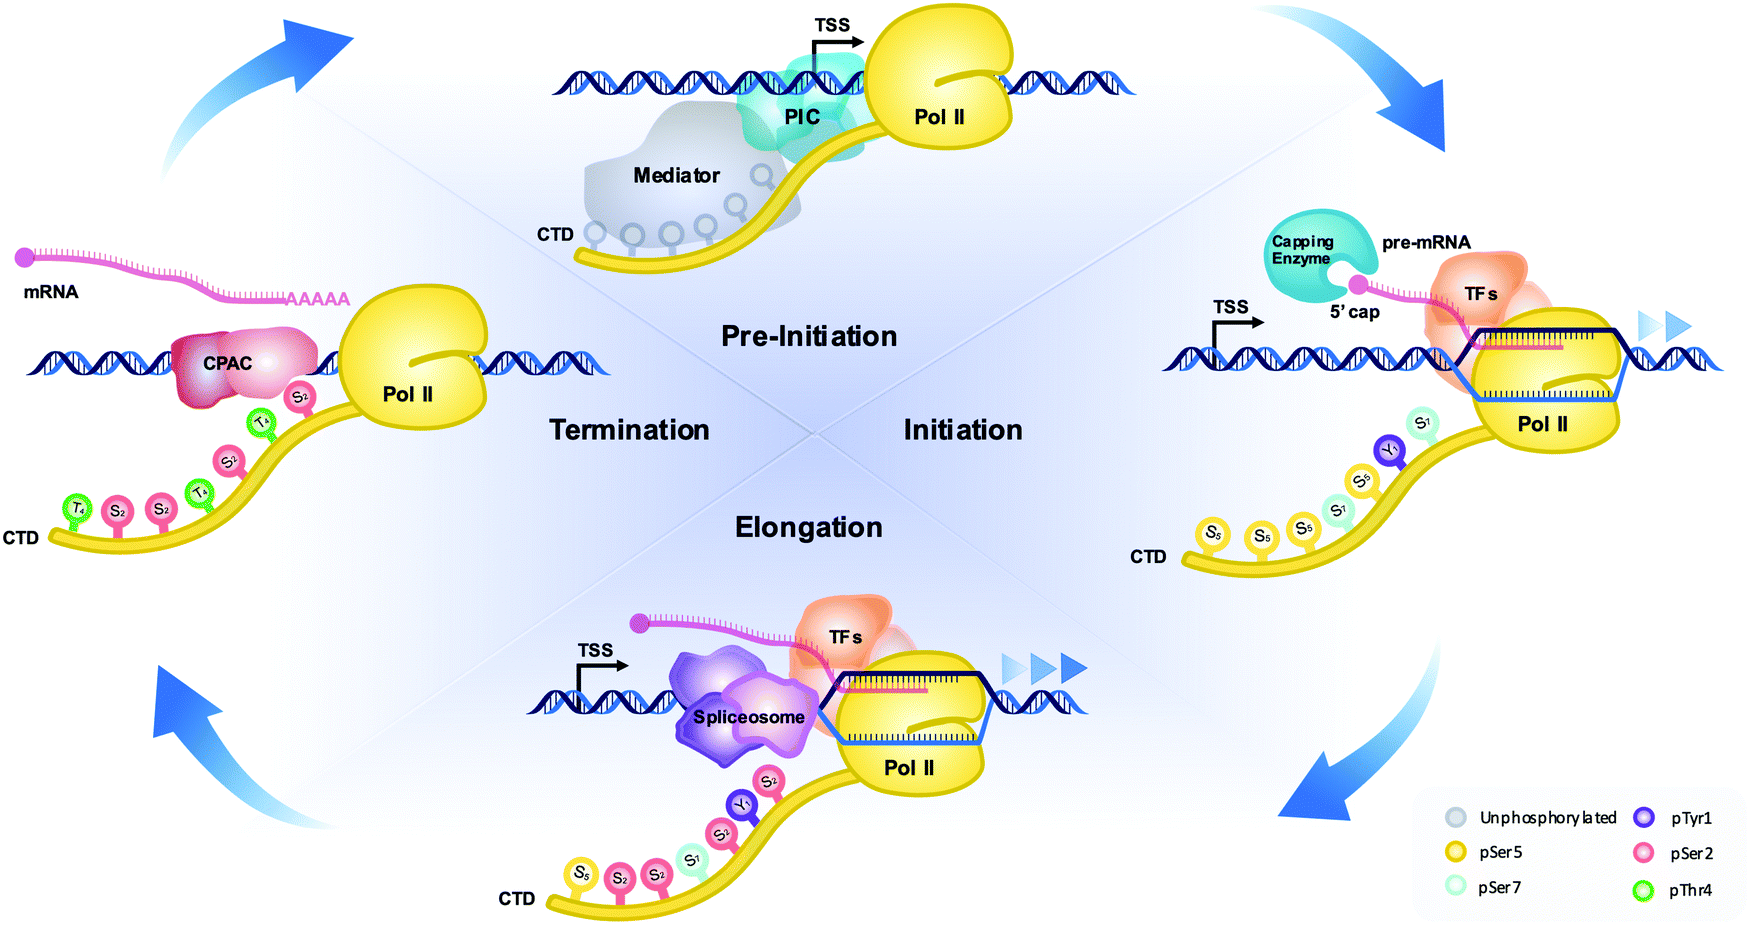 | ||
| Fig. 1 The cycle of CTD phosphorylation during eukaryotic transcription. Pre-initiation: an RNA polymerase II containing an unmodified CTD is recruited to the transcription start site (TSS) to facilitate formation of the pre-initiation complex. Initiation: phosphorylation of Ser5 and Ser7 on the CTD negates interactions with mediator and the pre-initiation complex. Tyr1 phosphorylation also marks the CTD as RNAPII pauses proximally to the promoter. Elongation: productive elongation is correlated with removal of Ser5 phosphorylation and gradual increase in Serine 2 phosphorylation. Termination: near the 3′ end of the gene Thr4 phosphorylation peaks and interactions with the cleavage/polyadenylation complex are enabled by Ser2 phosphorylation. RNAPII releases the mRNA and the cycle is renewed for subsequent rounds by dephosphorylation of the CTD. Abbreviations: Pol II, RNA polymerase II; CPAC, cleavage and polyadenylation complex; TFs, transcription factors; PIC, pre-initiation complex. | ||
Other than its uniquely repetitive sequence, another noteworthy property of the CTD is its propensity for undergoing post-translational modifications (PTMs), with phosphorylation being the primary modification.5,6 With five out of the seven residues in each repeat subject to phosphorylation, the placement of phosphate groups on specific residues correlates with different transcriptional stages. For example, the phosphorylation of Ser5 was observed to coincide with the initiation stage of transcription. Likewise, phosphorylation of Ser2 is the major event coinciding with productive elongation in transcription.7 The central model of CTD function involves phosphorylation of specific heptad sites according to different stages of transcription and the timely recruitment of various transcription regulators to the ongoing transcription machinery as a result (Fig. 1). Mass spectrometry (MS) is becoming a pivotal technique for investigating both steps of this model, especially regarding site-specific phosphorylation on RNAP II and the protein complexes recruited to the ongoing transcription. In this review, we briefly discuss the history of traditional techniques and the roadblocks they pose in investigating the phosphorylation state of the CTD. Throughout, we evaluate how variations of MS have been successfully used to overcome such roadblocks and provide fascinating new insights into the field of CTD-mediated transcriptional regulation. Furthermore, we offer a perspective on the importance of CTD phosphorylation state when considering the classic and new liquid–liquid phase separation (LLPS) models of transcription.
Early methods of detecting CTD phosphorylation sites
Initial efforts to detect phosphorylation of the CTD utilized gel electrophoresis since hyperphosphorylation is known to change the mobility of the bands dramatically.5,8 While this method has the advantage of being fast with no requirement of special equipment, no information on the specific site of phosphorylation can be derived.9 Thus, site-specific CTD antibodies were generated and optimized, leading to exponential growth in the understanding of CTD PTMs. Although many recent and novel discoveries surrounding CTD phosphorylation sites can be attributed to these antibodies, scientists soon encountered several significant limitations. At first, all available antibodies were raised against the consensus CTD sequences whilst important model systems like Drosophila melanogaster and Homo sapiens contain many heptads that diverge from the consensus sequence and therefore cannot be confidently identified with anti-consensus antibodies. Second, neighboring modifications within CTD heptads may potentially interfere with antibody/epitope recognition.10 This results in an inability to reliably quantify the total phosphorylation of the CTD. Third, antibodies cannot be used to differentiate phosphorylation sites between repeats within the CTD. Therefore, it is indeterminable by this method whether the position in which the phosphate group is placed matters for transcription or not. Last but not least, the specificity of antibodies is not always sufficient to distinguish between highly similar phosphate-accepting motifs (e.g. YS2P vs. TS5P vs. PS7Y) within the CTD.1 Confoundingly so, some antibodies also exhibit substantial binding to non-phosphorylated CTD.Identification of CTD phosphorylation using MS/MS
The gold standard for site-specific characterization of PTMs is tandem mass spectrometry (MS/MS) which provides single residue resolution without context interference (Fig. 2). Even though there has been exponential growth in the field of MS for proteomics applications, analysis of the CTD sequence is more complicated than a typical analysis for multiple reasons. First, the scarcity of basic residues such as Arg and Lys, which serve as protonation sites and proteolytic sites, generally leads to poor ionization/activation.11–13 Also, the potentially large number of labile phosphoryl groups is a big concern. This is particularly true for collisionally activated dissociation (CAD) where the accumulative stepwise energization process and the repetitive nature of the CTD sequence impose a hurdle for conventional bottom-up MS/MS analyses of phosphopeptides.14 | ||
| Fig. 2 The flow of the mass spectrometry analysis of CTD to determine its PTM sites using CAD or UVPD. | ||
The process of CAD, the most widely used method for MS/MS, entails conversion of the kinetic energy of selected precursor ions into internal energy via collisions with an inert gas such as nitrogen, argon, or helium.15,16 Vibrational energy redistribution accompanies this stepwise excitation process, resulting in cleavage of the most labile bonds. The phosphoester linkages anchoring the phosphate groups to side chains of amino acids are particularly labile, resulting in their facile cleavage upon CAD and generating fragment ions that provide sequence information but do not always permit confident phosphate localization.17–19 CAD may produce characteristic phosphotyrosine immonium ions, low m/z ions which serve as reporter ions for tyrosine phosphorylation.20 These limitations have motivated the development and exploration of alternative non-collision-based activation methods that minimize the loss of labile PTMs during ion activation.
Electron-based activation methods such as electron-transfer dissociation (ETD) offer a very different radical-based excitation mechanism and have been found to be highly effective in identifying phosphorylation.21,22 ETD uses a radical anion (fluoranthene) to perform gas-phase ion/ion chemistry. The radical anion transfers an electron to a protonated peptide (positive mode), inducing cleavage of the C(α)–N bond and leading to c/x-type peptide fragment ions. Owing to its different activation pathway, ETD preserves covalently bound PTMs that are labile during CAD.23 However, one drawback of ETD is that it requires highly-charged precursor ions for efficient fragmentation. For peptides in low charge states, charge reduction and/or neutralization predominates over production of informative sequence ions. ETD is also prone to non-dissociative events where peptide fragments are held together through non-covalent interactions after electron transfer.14,24–30 Thus, new methods have emerged where supplemental energy is added via IR-heating or collisional activation to enhance the separation of non-covalently linked products into diagnostic fragment ions.31,32
Another type of ion activation method called photodissociation (PD) uses photon absorption for energy. While PD methods exist that utilize photons spanning the gamut of energy ranges from low infrared to extreme ultraviolet, one of the most commonly used wavelengths for analyzing peptides and proteins is 193 nm. Termed ultraviolet photodissociation (UVPD), this technique provides three key advantages in the context of MS/MS analysis of the CTD (Fig. 2).33 First, because UVPD is not modulated by mobile protons (like CAD), UVPD generates rich fragmentation patterns for both positively and negatively charged peptides.34–40 This property makes UVPD versatile for both basic peptides that protonate well and acidic peptides (ones without basic residues or ones decorated with phosphate groups). Second, UVPD is a fast, high-energy activation method that does not dislodge labile modifications, making it well-suited for analysis of phosphopeptides.41 Third, the mechanism of UVPD is largely independent of charge state and allows even singly charged peptides to be well characterized, something that is a significant impediment to electron-based MS/MS methods like ETD.42 When comparing the advantages of each technique, it is clear that UVPD is a compelling option for analyzing the CTD. Whereas CAD mainly generates b/y type fragments and electron transfer methods generate c/z-type fragments, UVPD can generate informative a/x, b/y, and c/z-type fragments. Therefore, the use of UVPD to localize a PTM provides the maximum confidence level.
Mapping the sites of phosphorylation in endogenous CTD
The need for higher resolution detection of PTMs in RNAP II motivated recent MS/MS analyses of yeast43 and human10 CTD using CAD (Fig. 2). To overcome the lack of residues for proteolysis and ionization, basic residues were introduced to the 7th position in various heptads generating peptides with sizes suitable for bottom-up MS/MS analysis.43 The results of these analyses show that the phosphorylation density is not as high as previously believed. For example, only an average of one phosphorylation per heptad repeat was reported in mutated yeast CTD,43 whereas 75% of heptads in human CTD were singly phosphorylated, and 25% of heptads were doubly phosphorylated.10 Although the introduction of targeted mutations to the CTD has heightened our technological capabilities regarding its analysis by MS/MS, the presence of many mutations within RNAP II raises the concern for mutation bias. In practice, the detection of phosphate group on the 7th residue is substantially lower than the other positions.10,43 This can be the result of replacing the Ser at the 7th position from the consensus sequence with a basic residue that is non-phosphorylatable. Another concern is that a mutation of the 7th position might alter the recognition of the CTD by certain kinases, resulting in sites of phosphorylation that differ from endogenous RNAP II. To avoid bias by the introduction of mutations, chymotrypsin and proteinase K (which effectively cut aromatic residues) were used to cut the wildtype CTD and achieve proteolysis.44 UVPD was then applied to yield informative fragmentation and thus peptide sequence coverage.30 This method has been successfully used to map the phosphorylation of Drosophila CTD after phosphorylation by various CTD kinases in vitro.44,45 Since Drosophila CTD deviates significantly from the consensus sequence, UVPD allows for pinpoint identification of each phosphorylated residue. For example, phosphorylation of the Drosophila CTD via the mitogen-activated protein kinase (MAPK) Erk2 (a CTD kinase believed to actively phosphorylate RNAP II during embryonic development) was mapped, showing more than 80% coverage with single residue resolution.44 When identifying sites phosphorylated by positive transcription elongation factor b (P-TEFb), the use of UVPD mass spectrometry revealed a surprisingly high level of Ser5 phosphorylation with Ser2 only being phosphorylated when no Ser5Pro6 was present in the heptad.45 These examples demonstrate that UVPD is an excellent approach for overcoming the challenges associated with identifying phosphorylation of the CTD. Most recently, UVPD-mass spectrometry was used to provide quantitative insight for spatiotemporal phosphorylation patterns on the human CTD by CDK7.46 By temporally resolving the capacity of the CDK7 kinase module to phosphorylate each site on the CTD of RNAP II, we got a glimpse of its dynamic, changing phosphorylation patterns that occur during transcription. A combination of this high-accuracy localization with cellular transcriptomic studies could potentially reveal how CTD coordinates transcription progress.Characterizing the specificity of CTD kinases and phosphatases
Since different CTD residues are phosphorylated at various stages of transcription, learning which enzymes install or remove phosphorylation marks is pivotal to understanding the regulatory mechanisms of transcription. This task was previously attempted using immunoblotting via highly specific antibodies against each phosphorylation site.1 However, the variable affinity of these different antibodies toward their respective phosphorylation sites made quantification of specificity impossible. Instead, further insight into the specificity of CTD kinases and phosphatases can be gained with the application of MS. MS/MS provides the high level of accuracy that is necessary to identify phosphorylation sites on individual amino acids of the CTD. Furthermore, relative quantitation can be used to quantifiably track CTD kinase preference based on the extracted ion chromatograms of informative fragments after MS/MS (Fig. 2).MS has been successfully used to characterize the specificity of the widely studied CTD kinases and phosphatases in vitro using recombinant CTDs as substrates (Fig. 3a). From these experiments, it was shown that human TFIIH exhibits activity with Ser5 nearly exclusively, which is consistent with studies using other approaches.44,47 In contrast, Erk2 shows non-specific phosphorylation towards multiple sites on the heptad repeats.48 However, analyses using a combination of electrospray ionization (ESI)-MS and matrix-assistant laser desorption/ionization (MALDI)-MS demonstrated that of these three residues, Erk2 strongly prefers the phosphorylation of Ser5 and only phosphorylates Ser2 when no Ser5 is available.44 On the other hand, human tyrosine kinases such as Abl kinases phosphorylate Tyr1 but only up to ∼50% of the available Tyr1 sites.49 This semi-conserved phosphorylation of CTD residues is rather important for its biological function. For example, when every tyrosine is chemically hyperphosphorylated, the CTD polypeptide becomes resistant to further phosphorylation by other kinases such as TFIIH and P-TEFb.50 A structural analysis based on the sequence of the substrate binding region and active site reveals the conservation of three different structural motifs that contribute to different configurations of substrate recognition. The combined interactions of these three signature motifs lead to different preferences of CTD substrates, as confirmed by MS analysis.51
 | ||
| Fig. 3 Specificity of CTD kinases towards consensus sequence heptads and modified residues which result in crosstalk that changes the preference of kinases and phosphatases targeting the CTD. (a) Kinases are shown which have been identified to mono-phosphorylate consensus CTD heptads. Asterisks represent phosphorylation identified via mass spectrometry, and double-daggers represent phosphorylation identified via antibody-based methods. Colors of arrows, phospho-marks, and residues are matched for ease of viewing. (b) Preferences of phosphorylation can be changed by crosstalk with adjacent phosphorylation or variation from the consensus heptad. The heptad sequence for Abl kinase is centered on Y1. Cit7 = citrulline (oxidative deamination of arginine). Size of the phosphate mark indicates the corresponding level of preference where applicable. An X indicates absence of dephosphorylation. Colors of arrows, phospho-marks, and residues are matched for ease of viewing. | ||
The sensitivity of MS also provides a significant advantage that can be used to understand the specificity of CTD phosphatases, even those that exhibit weak dephosphorylation. Usually, phosphatases are guided to their substrates by associated targeting molecules. Once on target, phosphatases tend to remove most, if not all, of the phosphorylated residues encountered. For example, MS analysis revealed the capability of FCP1 (the phosphatase responsible for recycling RNAP II) to dephosphorylate most of the CTD residues.52 MS was likewise used to show that Ssu72 (a phosphatase responsible for dephosphorylating the Ser5 conserved across yeast and human) exhibits surprisingly high specificity towards Ser5 but not Ser2 even though both serines are part of an SP motif (Fig. 3a).52 These conclusions prompted investigators to take a closer look into the crystal structures of Ssu72, ultimately revealing that the narrow and deep active site imposes steric restrictions which regulate its specificity limited to Ser5 but not Ser2.52
Using MS to understand crosstalk between different CTD phosphorylation positions
The heterogeneous phosphorylation of RNAP II at various positions within the CTD heptad leads to crosstalk between residues, altering the landscape for different PTMs.53 Of recent importance was the use of MS in phosphorylation identification to resolve a discrepancy surrounding the activity of the CTD kinase, P-TEFb. P-TEFb is responsible for release of the promoter-proximal pausing, a pivotal regulatory mechanism in eukaryotes for gene expression control.54,55 It has been shown that P-TEFb phosphorylates negative elongation factors as well as the Ser2 position to release pausing.56 Indeed, Ser2 phosphorylation is tightly associated with productive elongation. Surprisingly, various assays with purified P-TEFb kinase only exhibited substantial phosphorylation at the Ser5 position. Using UVPD-MS revealed that P-TEFb consistently phosphorylates Ser5 of the non-phosphorylated yeast, Drosophila, and human CTD.44,45,57 However, when the CTD chain is first phosphorylated at the Tyr1 position using a physiologically relevant Abl kinase, P-TEFb alters its activity to phosphorylate Ser2 rather than Ser5.49 This observation is consistent across both in vivo and in vitro experiments. When Tyr1 phosphorylation is inhibited, Ser2 phosphorylation also decreases, leading to a higher percentage of RNAP II stuck at the transcription initiation sites (Fig. 3b).49 Thus, crosstalk between Tyr1 and Ser2 phosphorylation alters P-TEFb specificity in cells and controls promoter-proximal pausing.MS-based characterization of phosphorylation at single amino acid resolution also allows us to answer questions such as: how does a PTM on a flanking residue affect the ability of a kinase to specifically phosphorylate its target residue? Through the use of MS, we now know that flanking PTMs can lead CTD kinases to favor phosphorylation of certain repeats over others. For example, residues at the 7th position of the heptad affect the phosphorylation of Tyr1 on the next repeat by Abl kinase (Fig. 3b). The major phosphorylation product appears in the LC trace during MS analysis as a CTD peptide with phosphoryl tyrosine flanking a negative residue (such as phosphoryl Ser7).58 Such a preference leads to the routine generation of doubly phosphorylated Ser7Tyr1. Thus, the intelligent use of MS has proven critical in delineating the crosstalk between different phosphorylation sites of the CTD. With the advantage of unambiguity on phosphorylation sites, the application of mass spectrometry in specificity studies for kinases/phosphatases relies on the molecular understanding of the cellular context of the kinases/phosphatases. Thus, biochemical studies of associated regulatory factors for the kinases/phosphatases are the foundation of the correct identification of specificities.
Identification of proteins associated with modified RNAP II
The core model for CTD function involves the recruitment of transcription regulatory factors based on phosphorylation states of the CTD. Early efforts to identify regulators of RNAP II employed an extensive yeast two-hybrid screening system, from which several major CTD binding motifs emerged.59 Following up on this early success, powerful proteomic approaches have been used to supercharge the search for CTD binders. One of the first efforts in the proteomic study of transcriptional regulators used short synthetic peptides phosphorylated at Ser2 or Ser5 positions to pull-down associated proteins.60,61 Several proteins identified as associated with CTD through this pull-down proteomics assay also bind to DNA or chromatin, suggesting the existence of crosstalk between transcriptional RNAP II and chromatin state. This crosstalk was later confirmed when various proteins were identified that can simultaneously bind to RNAP II and chromatin with the PTMs of the two systems affecting each other.62–65While the use of synthetic phosphoryl-peptides led to the identification of strong binding partners for CTD, scientists soon realized that due to the repetitive nature of the heptad, most of the CTD binding proteins can be effectively recruited to RNAP II with substantially weaker interactions to an individual heptad. Thus, full-length recombinant CTD was henceforth used in pull-downs after treatment with different CTD kinases.66 A comparison of proteins pulled down after treatment with TFIIH (the human kinase for Ser5) and P-TEFb (the human kinase for Ser2) revealed recruitment of the Set2 complex, a methyltransferase complex involved in the co-transcriptional modification of H3K36, only in the case of P-TEFb-treated CTD.47 This identification is consistent with the enrichment of phosphoryl-Ser2 in the elongation stage of transcription and the biological role of Set2 complex in splicing. The N-terminal domain of Set2 (namely the SRI domain) directly interacts with the phosphate group on Ser2,67 therefore recruiting the whole Set2 with its associated protein to the elongating RNAP II.
An alternative approach for identifying proteins recruited to a specific phosphorylation state of CTD takes advantage of the powerful and highly specific antibodies which recognize phosphoryl epitopes of interest.68 This allows the pull-down of endogenous RNA polymerases that are enriched with different phosphorylation marks.69 Proteomic comparison of the proteins eluted by different antibodies revealed that distinctive groups of proteins are recruited to RNAP II.70 However, analysis of such a dataset can be complex for multiple reasons. First, the eluent is usually a mixture of proteins containing co-existing phosphoryl-marks since endogenous RNAP II are enriched with combinations of phosphoryl-marks. Second, identifying specific proteins that are pulled down solely relies on the specificity of the antibody. Because some CTD antibodies are less specific, results from assays using these antibodies should be especially scrutinized. The issue of specificity is compounded by the mixed nature of phosphorylation marks on the same RNAP II molecule that can interfere with antibody recognition. Furthermore, the proteomic analysis of the pull-down is more complicated due to the sheer number of proteins associated with endogenous RNAP II. We emphasize that the most important knowledge gained from the use of this method is that similar proteins are recruited by phosphorylated Ser2 and Thr4 or Ser5 and Ser7. This finding is consistent with the observation that the Ser2/Thr4 are phosphorylated by P-TEFb at the elongation stage of transcription71 while Ser5/Ser7 are both phosphorylated by TFIIH at the beginning.72
Due to the significant number of proteins directly or indirectly associated with RNAP II or the CTD as part of the recruited transcriptional complexes, it has been challenging to identify proteins with affinity proteomics. To resolve these associations with high confidence, another bottom-up proteomic approach called multidimensional protein identification technology (MudPIT) has been developed which couples 2D liquid chromatography (2D-LC) and MS/MS.73,74 The application of MudPIT can overcome hurdles associated with 2D gel electrophoresis such as difficulty identifying proteins with high molecular weight, extreme PI, or low abundance. By employing 2D-LC instead of 2D gel electrophoresis, MudPIT achieves greater separation of peptides, ultimately resulting in a higher sensitivity MS/MS analysis. Recent applications of MudPIT to identify RNAP II-associated proteins include the identification of the CTD Ser5 phosphatase, Rtr1.75 Additionally, MudPIT analysis was used to investigate the removal of pSer7 marks on the CTD by Ssu72 in complex with APT and CPF.76 This multi-dimensional strategy also showed that the RNAP II subunit Rpb4/7 heterodimer dissociates from the other ten subunits due to alterations in the modification state of the CTD.77 A quantitative proteomic analysis of multiple RNAPII associated proteins then revealed interactions with a form of RNAP II that lacks Rpb4/7 subunits.77
As we continue to use proteomics to analyze proteins bound to the CTD, one fact starts to emerge: some of the CTD binding proteins show much higher associations with specific PTMs or divergent sequences of the CTD. Thus, quantitative approaches are needed to distinguish such molecules and the specific CTD form recognized by them. From a proteomic standpoint, stable isotope labeling with amino acids in cell culture (SILAC) has been developed to detect differences in protein abundance among cellular samples78,79 and has been shown to be an excellent technique to identify proteins specifically recruited to the CTD.80 A prime example of SILAC detection of preferential CTD binding is the recent study recognizing the regulator of pre-mRNA-domain-containing (RPRD) proteins as reader proteins of acetylated K7.81 In human CTD, Lys replaces Ser7 in eight of the heptad repeats in the distal region and is subject to methylation and acetylation. The enhanced binding of K7ac with RPRD proteins modulates the phosphorylation state of Ser5, showcasing the crosstalk between various PTMs in CTD sites.
Mass spectrometry identification of structural motifs that directly interact with the CTD
Proteomic studies led to the identification of proteins that physically interact with the CTD. These proteins, in turn, assemble into large transcriptional complexes. The persistent proteomic effort elucidated conserved domains and signature motifs across different proteins that function as the binding module to connect CTD phosphorylation states to other cellular events such as compacting of chromatin (Table 1 and Fig. 4). Here, we will briefly discuss the most frequently seen motifs/domains in the context of CTD phosphorylation state. For a more comprehensive overview and a detailed analysis of structural motifs/domains/bindings proteins that interact with CTD, a comprehensive table listing the thermodynamic measurement of all CTD binding proteins can be found in the recent review by Venkat Ramani et al.2| Binding module | Protein | CTD specificity | PDB ID | Ref. |
|---|---|---|---|---|
| Abbreviations: p: phosphorylation; Ac: acetylated; Me: methylated. | ||||
| CID | SCAF8 | Bisphosphorylated pSer2/pSer5 | 3D9K, 3D9L, 3D9M, 3D9O, 3D9N | 111 and 112 |
| CID | SCAF4 | Bisphosphorylated pSer2/pSer5 | 6XKB | 112 |
| CID | RPRD1A | pSer2, pSer7, Lys7-ac | 4JXT | 81 and 83 |
| CID | RPRD1B | pSer2, pSer7, Lys7-ac | 4Q94, 4Q96, 4HFG | 81 and 83 |
| CID | RPRD2 | pSer2, pSer7 | 4FLB | 83 |
| CID | Nrd1 | pSer5 | 3CLJ, 2LO6 | 113 and 114 |
| CID | Pcf11 | pSer2 | 1SZA, 1SZ9 | 115 and 116 |
| CID | Rtt103 | pSer2, pThr4 | 2L0I, 5LVF | 82 and 116–118 |
| CID | Seb1 | pSer2 | 5MDT | 84 and 118 |
| SRI | Set2 | Bisphosphorylated pSer2/pSer5 | 2C5Z, 2A7O | 67 and 85 |
| WW | Ess1 | pSer5 | 1YW5 | 119–121 |
| WW | Pin1 | pSer5 | 1F8A, 3TCZ, 3TDB | 86 and 122 |
| FF | TCERG1 | pSer2, pSer5, pSer7 | 4FQG | 88 |
| SH2 | Spt6 | pSer2, pTyr1 | 6QTC, 3PJP, 3PSJ | 91 and 123–126 |
| SPOC | PHF3 | pSer2 | 6IC9, 6IC8, 6Q5Y, 6Q2V | 89 |
| Tudor | SMN | R1810-Me | 1MHN | 127 and 128 |
| Tudor | TDRD3 | R1810-Me | 3PMT, 2LTO | 90 and 129 |
 | ||
| Fig. 4 Domain architecture of known CTD binding modules. The overall structures are shown as ribbon diagrams: (A) CID domain of Scaf8 (light green, PDB: 3D9O) (B) SRI domain of Set2 (pink, PDB: 2A7O) (C) WW domain of Pin1 (teal, PDB: 1F8A) (D) tandem FF domain of TCERG1 (orange, PDB: 4FQG) (E) SPOC domain of PHF3 (red, PDB: 6Q2V) (F) Tudor domain of SMN (purple, PDB: 1MHN) (G) tandem SH2 domain of Spt6 (yellow, PDB: 6GME). | ||
CTD-interacting domain (CID) is the most frequently encountered CTD-specific binding module and is formed by five twisted helical bundles (Fig. 4A).82–84 CID is found mostly in SR proteins that are involved in RNA processing or transcription elongation and termination. Upon binding to the CTD, a conserved region of the CID interacts with the CTD backbone. These interactions are specifically tailored based on the recognition of different CTD phosphoryl groups. Close to a dozen CID domains have been identified with specificity to pSer2, pSer5 or both. Another binding module, the Set2 Rpb1 interacting (SRI) domain, consists of three helical bundles and has been proposed to bind to the CTD (Fig. 4B). This domain was found in Set2 (a histone methyltransferase associated with RNAP II) as well as some SR proteins that mediate mRNA processing.66 Although a structure is not available for SRI domains in complex with CTD heptads, the binding sites have been identified within the concave surface between the α1 and α2 helices formed by conserved residues.67,85 Because of the role of Set2 in histone modification, the simultaneous binding of Set2 to both pSer2 of the CTD and histone provides a link of communication between on-going transcription and chromatin state. The WW domain found in prolyl isomerase (Pin1 in human and Ess1 in yeast) has a highly specific interaction with phosphorylated Ser5 of the CTD but does not detectably bind to other phosphorylated residues (Fig. 4C). However, the recognition of the CTD by prolyl isomerase also requires the cooperation of its catalytic PPIase domain since CTD binds at the cleft between the two domains.86 This might explain why the binding mode of CTD observed via NMR exhibits a different recognition network when only the WW domain is present.87 Likewise, CA150 (TCERG1) contains FF domains that have been implicated in CTD binding. The binding to individual pSer2, pSer5 and pSer7 heptad is moderate but seems to be highly enhanced upon combined phosphorylation. The signature of an FF domain is the presence of small, consecutive helical knots in protein sequences (Fig. 4D). In the case of CA150, six FF knots exist, but only the last three are necessary for CTD binding.88In vitro interaction is very weak and detection by NMR titration requires the presence of phosphorylated Ser7 in addition to Ser2 and Ser5.88 The most recent addition for the collection of binding modules is the SPOC domain found in PHF3.89 This novel binding module shows strong interaction to both pSer2 and pSer5 with a significant preference to pSer2. The SPOC domain has a partial β-barrel with helices at the end, recognizing phosphorylation groups with a couple of positive patches (Fig. 4E).89 Unlike the CTD binding modules that recognize pSer2/pSer5, the Tudor domain of SMN exhibits affinity to the symmetric methylated R1810me2.90 This specific modification depends on the enzymatic activity of PRMT5 and recruits SMN to RNAP II for transcriptional termination (Fig. 4F). Finally, the SH2 domain of Spt6 seems to show in vitro binding to various combinations of double phosphorylation, consistent with pSer2 and pTyr1, but the physiological implication of such an interaction is yet to be well established (Fig. 4G).91
Mass spectrometry insights into liquid–liquid phase separation of the CTD
In the canonical model of CTD function, its different PTM states function as a template that promotes the stepwise recruitment of regulators to RNAP II throughout the progression of transcription (Fig. 1).92 Recently, new evidence has emerged showing that the CTD participates in a highly dynamic liquid–liquid phase separation (LLPS) which could allow RNAP II to participate in transcription within phase-separated condensates.93–95 As hubs for transcription, the simultaneous existence of condensates with differing compositions raises the question of whether the newer LLPS model of transcription contradicts the classic stepwise recruitment model. Through advancements in mass spectrometry developed to answer other questions of transcription, we are now poised to investigate this interesting new concept.The CTD of RNAP II is classified as an intrinsically disordered region (IDR), which is typically represented by repetitive, low complexity sequences in proteins and manifests as a lack of secondary structure in solution.45,93,96 Under certain conditions, the presence of intrinsically disordered regions can promote the formation of condensates with a distinct, membrane-less micro-environment from the surrounding media.97 These condensates consist of scaffold molecules that support the structure of the droplet and client molecules that bind to scaffold.98 Thermodynamically, scaffold–scaffold interactions are favored until a shift in client stoichiometry allows for scaffold–client interactions, which are typically weak and multivalent.97,99–101 Therefore, a change in valency of either the client or scaffold through phosphorylation or other PTMs can significantly affect composition without compromising the structural integrity of the droplet.98,101 This property is critical for explaining how RNAP II could be efficiently recruited to the pre-initiation complex (PIC) in the LLPS model and may also explain how RNAP II can transition so rapidly to other stages of transcription.102 Another factor that has been shown to influence the ability of the CTD to undergo LLPS is the length of repeats, whereby the human variant of CTD containing 52 repeats forms more stable droplets in vitro than the 26-repeat variant in yeast CTD.103,104 Interestingly, some transcription factors and transcription-related proteins have been shown to undergo LLPS likely due to their low complexity sequences as well.105–107 For example, fused in sarcoma (FUS) is an RNA binding-protein whose N-terminal low complexity domain has been shown to undergo LLPS and also bind to the CTD.108 Therefore, understanding the way phosphorylation impacts the participation of RNAP II in LLPS is key to advancing our knowledge of transcription.
Until recent years, the predominant view was that transcription regulators are recruited to transcription in a stepwise manner.1 Now, the LLPS model shifts the narrative to one which involves various stages of transcription being directed through recruitment and incorporation of RNAP II into pre-existing droplets containing transcription machinery.107,109 The phosphorylation state of the CTD might play a key role in the recruitment of RNAP II into droplets. Indeed, in vitro experiments have shown that RNAP II is recruited to CTD droplets in close proximity which contain key transcription factors specific to the initiation and splicing stages.102 Interestingly, one of the first groups to study this phenomenon showed that hydrogel-bound CTD is susceptible to PTMs by enzymes in the aqueous phase, and phosphorylation by CDK7/CDK9 results in dissociation of pre-bound CTD as well as blockage of further binding.110 Furthermore, it has been shown that hyperphosphorylation of the CTD results in a change in partitioning characteristics that may allow RNAP II to dissociate from certain droplets and incorporate into others.102 More specifically, the phosphorylation of individual CTD residues or combinations thereof could drive the formation or dissolution of droplets.103 In any case, phosphorylation seems to be the primary PTM that changes the ability of CTD, and therefore RNAP II, to either continue to associate with its current droplet or move to a separate droplet containing machinery for another stage of transcription. While it is still unknown how specific phosphorylation patterns or crosstalks originating from these PTMs affect partitioning behavior in vivo, applications of mass spectrometry in vitro could provide fundamental evidence.
Based on observations that condensates allow for rapid compartmentalization and association of RNAP II with its transcription factors and the strong binding of phosphorylated RNAP II with many transcription factors, it is likely that a mechanism combining aspects of the CTD-mediated protein recruitment and LLPS models exists. The common factor between these two models is the phosphorylation of residues within the CTD which dictates the timing and function of RNAP II in transcription that has been observed through mass spectrometry and immunoblotting methods. LLPS could be one way to increase the concentration of reader proteins which may then form stable associations with the CTD. This could explain the consistent observation that CTD-interacting proteins usually exhibit relatively weak associations with mono or bi-heptads that do not phase-separate. While some transcription factors such as Mediator have been shown to form and maintain droplets in the absence of CTD, others may not readily incorporate into droplets. In this sense, the CTD could bind and recruit these molecules into condensates to fulfill their purpose. Upon phosphorylation of the CTD, these factors would be released and ejected from the droplet. Therefore, it is likely that we can use mass spectrometry methods to detect spatiotemporal phosphorylation of the CTD during transcription, which may be the underpinning mechanism that connects the CTD recruitment model with the LLPS model. In conclusion, we believe the new LLPS model and canonical CTD-based recruitment model are not necessarily exclusive of one another. The advancement of PTM-state analyses in different stages of transcription with high-resolution methods such as mass spectrometry can correlate RNAP II phosphorylation with different transcriptional droplets for a better understanding of the fundamental mechanism of eukaryotic transcription.
Summary
Since specific interactions with transcription machinery are dependent on the phosphorylation states of residues within the CTD, mass spectrometry analysis of phosphosites and continued identification of the kinases and phosphatases that associate in the CTD is of the utmost importance. Additionally, mass spectrometry may be the key to reconciling the classical CTD-mediated recruitment and new LLPS models of transcription. However, the high heterogeneity and low abundance of certain components still pose a technical challenge for MS analysis. Fortunately, the fast progress in cryo-electron microscopy presents opportunities to capture the transcription machinery in action by taking snapshots at every step. By trapping RNAP II and its associated proteome at different stages of transcription, we will significantly expand the elucidation of the molecular mechanisms of these central cellular events. In combination with advanced MS methods, these cutting-edge advancements will lead us one step closer to the ultimate reward: mastering our model of the dynamic transcriptional assembly.Conflicts of interest
There are no conflicts to declare.Acknowledgements
This work is supported by grants from the National Institutes of Health (R01GM104896 to YJZ, R01GM125882 to YJZ and JSB, R01GM121714 and R35GM139658 to JSB) and Welch Foundation (F-1778 to YJZ and F-1155 to JSB). The content is solely the responsibility of the authors and does not necessarily represent the official views of the Robert A. Welch Foundation or the National Institutes of Health.References
- J. L. Corden, Chem. Rev., 2013, 113, 8423–8455 CrossRef CAS PubMed.
- M. K. Venkat Ramani, W. Yang, S. Irani and Y. Zhang, J. Mol. Biol., 2021, 166912, DOI:10.1016/j.jmb.2021.166912.
- J. P. Hsin and J. L. Manley, Genes Dev., 2012, 26, 2119–2137 CrossRef CAS.
- R. D. Chapman, M. Heidemann, C. Hintermair and D. Eick, Trends Genet., 2008, 24, 289–296 CrossRef CAS PubMed.
- H. P. Gerber, M. Hagmann, K. Seipel, O. Georgiev, M. A. West, Y. Litingtung, W. Schaffner and J. L. Corden, Nature, 1995, 374, 660–662 CrossRef CAS.
- C. Jeronimo, A. R. Bataille and F. Robert, Chem. Rev., 2013, 113, 8491–8522 CrossRef CAS PubMed.
- D. E. Lyons, S. McMahon and M. Ott, Transcription, 2020, 11, 66–82 CrossRef PubMed.
- J. E. Mayfield, S. Irani and Y. Zhang, Bio-Protoc., 2020, 10, e3648 Search PubMed.
- R. D. Chapman, M. Heidemann, T. K. Albert, R. Mailhammer, A. Flatley, M. Meisterernst, E. Kremmer and D. Eick, Science, 2007, 318, 1780–1782 CrossRef CAS PubMed.
- R. Schuller, I. Forne, T. Straub, A. Schreieck, Y. Texier, N. Shah, T. M. Decker, P. Cramer, A. Imhof and D. Eick, Mol. Cell, 2016, 61, 305–314 CrossRef PubMed.
- C. M. Potel, S. Lemeer and A. J. R. Heck, Anal. Chem., 2019, 91, 126–141 CrossRef CAS PubMed.
- M. Mann and O. N. Jensen, Nat. Biotechnol., 2003, 21, 255–261 CrossRef CAS PubMed.
- N. Dephoure, K. L. Gould, S. P. Gygi and D. R. Kellogg, Mol. Biol. Cell, 2013, 24, 535–542 CrossRef CAS PubMed.
- J. S. Brodbelt, Chem. Soc. Rev., 2014, 43, 2757–2783 RSC.
- B. Paizs and S. Suhai, Mass Spectrom. Rev., 2005, 24, 508–548 CrossRef CAS.
- J. Mitchell Wells and S. A. McLuckey, Biological Mass Spectrometry, 2005, pp. 148–185 DOI:10.1016/s0076-6879(05)02005-7.
- M. S. Kim, J. Zhong and A. Pandey, Proteomics, 2016, 16, 700–714 CrossRef CAS PubMed.
- K. Engholm-Keller and M. R. Larsen, Proteomics, 2013, 13, 910–931 CrossRef CAS PubMed.
- M. R. Larsen, M. B. Trelle, T. E. Thingholm and O. N. Jensen, Biotechniques, 2006, 40, 790–798 CrossRef CAS PubMed.
- H. Steen, B. Kuster, M. Fernandez, A. Pandey and M. Mann, Anal. Chem., 2001, 73, 1440–1448 CrossRef CAS PubMed.
- M. Sarbu, R. M. Ghiulai and A. D. Zamfir, Amino Acids, 2014, 46, 1625–1634 CrossRef CAS.
- J. Wiesner, T. Premsler and A. Sickmann, Proteomics, 2008, 8, 4466–4483 CrossRef CAS.
- M. S. Kim and A. Pandey, Proteomics, 2012, 12, 530–542 CrossRef CAS PubMed.
- L. A. Macias, I. C. Santos and J. S. Brodbelt, Anal. Chem., 2020, 92, 227–251 CrossRef CAS PubMed.
- J. S. Brodbelt, J. Am. Soc. Mass Spectrom., 2011, 22, 197–206 CrossRef CAS PubMed.
- J. S. Brodbelt and J. J. Wilson, Mass Spectrom. Rev., 2009, 28, 390–424 CrossRef CAS PubMed.
- J. P. Reilly, Mass Spectrom. Rev., 2009, 28, 425–447 CrossRef CAS PubMed.
- T. Ly and R. R. Julian, Angew. Chem., Int. Ed., 2009, 48, 7130–7137 CrossRef CAS.
- B.-M. Julia and E. de Oliveira, Encyclopedia of Analytical Chemistry, 2018, pp. 1–22 DOI:10.1002/9780470027318.a9620.
- J. S. Brodbelt, L. J. Morrison and I. Santos, Chem. Rev., 2020, 120, 3328–3380 CrossRef CAS PubMed.
- D. L. Swaney, G. C. McAlister, M. Wirtala, J. C. Schwartz, J. E. Syka and J. J. Coon, Anal. Chem., 2007, 79, 477–485 CrossRef CAS PubMed.
- N. M. Riley, A. S. Hebert, G. Durnberger, F. Stanek, K. Mechtler, M. S. Westphall and J. J. Coon, Anal. Chem., 2017, 89, 6367–6376 CrossRef CAS.
- T. Baer and R. C. Dunbar, J. Am. Soc. Mass Spectrom., 2010, 21, 681–693 CrossRef CAS.
- J. A. Madsen, T. S. Kaoud, K. N. Dalby and J. S. Brodbelt, Proteomics, 2011, 11, 1329–1334 CrossRef CAS PubMed.
- S. W. Han, S. W. Lee, O. Bahar, B. Schwessinger, M. R. Robinson, J. B. Shaw, J. A. Madsen, J. S. Brodbelt and P. C. Ronald, Nat. Commun., 2012, 3, 1153 CrossRef PubMed.
- J. A. Madsen, H. Xu, M. R. Robinson, A. P. Horton, J. B. Shaw, D. K. Giles, T. S. Kaoud, K. N. Dalby, M. S. Trent and J. S. Brodbelt, Mol. Cell. Proteomics, 2013, 12, 2604–2614 CrossRef CAS PubMed.
- J. A. Madsen, B. J. Ko, H. Xu, J. A. Iwashkiw, S. A. Robotham, J. B. Shaw, M. F. Feldman and J. S. Brodbelt, Anal. Chem., 2013, 85, 9253–9261 CrossRef CAS PubMed.
- M. R. Robinson, K. L. Moore and J. S. Brodbelt, J. Am. Soc. Mass Spectrom., 2014, 25, 1461–1471 CrossRef CAS PubMed.
- S. M. Greer, J. R. Cannon and J. S. Brodbelt, Anal. Chem., 2014, 86, 12285–12290 CrossRef CAS.
- M. R. Robinson and J. S. Brodbelt, Anal. Chem., 2016, 88, 11037–11045 CrossRef CAS PubMed.
- M. R. Robinson, J. M. Taliaferro, K. N. Dalby and J. S. Brodbelt, J. Proteome Res., 2016, 15, 2739–2748 CrossRef CAS PubMed.
- J. Liu and S. A. McLuckey, Int. J. Mass Spectrom., 2012, 330–332, 174–181 CrossRef CAS PubMed.
- H. Suh, S. B. Ficarro, U. B. Kang, Y. Chun, J. A. Marto and S. Buratowski, Mol. Cell, 2016, 61, 297–304 CrossRef CAS PubMed.
- J. E. Mayfield, M. R. Robinson, V. C. Cotham, S. Irani, W. L. Matthews, A. Ram, D. S. Gilmour, J. R. Cannon, Y. J. Zhang and J. S. Brodbelt, ACS Chem. Biol., 2017, 12, 153–162 CrossRef CAS PubMed.
- B. Portz, F. Lu, E. B. Gibbs, J. E. Mayfield, M. Rachel Mehaffey, Y. J. Zhang, J. S. Brodbelt, S. A. Showalter and D. S. Gilmour, Nat. Commun., 2017, 8, 15231 CrossRef CAS PubMed.
- E. E. Escobar, M. K. Venkat Ramani, Y. Zhang and J. S. Brodbelt, J. Am. Chem. Soc., 2021 DOI:10.1021/jacs.1c03321.
- C. C. Ebmeier, B. Erickson, B. L. Allen, M. A. Allen, H. Kim, N. Fong, J. R. Jacobsen, K. Liang, A. Shilatifard, R. D. Dowell, W. M. Old, D. L. Bentley and D. J. Taatjes, Cell Rep., 2017, 20, 1173–1186 CrossRef CAS PubMed.
- W. W. Tee, S. S. Shen, O. Oksuz, V. Narendra and D. Reinberg, Cell, 2014, 156, 678–690 CrossRef CAS.
- J. E. Mayfield, S. Irani, E. E. Escobar, Z. Zhang, N. T. Burkholder, M. R. Robinson, M. R. Mehaffey, S. N. Sipe, W. Yang, N. A. Prescott, K. R. Kathuria, Z. Liu, J. S. Brodbelt and Y. Zhang, eLife, 2019, 8 DOI:10.7554/eLife.48725.
- N. Czudnochowski, C. A. Bosken and M. Geyer, Nat. Commun., 2012, 3, 842 CrossRef PubMed.
- M. K. Venkat Ramani, E. E. Escobar, S. Irani, J. E. Mayfield, R. Y. Moreno, J. P. Butalewicz, V. C. Cotham, H. Wu, M. Tadros, J. S. Brodbelt and Y. J. Zhang, ACS Chem. Biol., 2020, 15, 2259–2272 CrossRef PubMed.
- S. Irani, S. N. Sipe, W. Yang, N. T. Burkholder, B. Lin, K. Sim, W. L. Matthews, J. S. Brodbelt and Y. Zhang, J. Biol. Chem., 2019, 294, 8592–8605 CrossRef CAS PubMed.
- A. R. Bataille, C. Jeronimo, P. E. Jacques, L. Laramee, M. E. Fortin, A. Forest, M. Bergeron, S. D. Hanes and F. Robert, Mol. Cell, 2012, 45, 158–170 CrossRef CAS PubMed.
- N. F. Marshall, J. Peng, Z. Xie and D. H. Price, J. Biol. Chem., 1996, 271, 27176–27183 CrossRef CAS PubMed.
- G. T. Booth, P. K. Parua, M. Sanso, R. P. Fisher and J. T. Lis, Nat. Commun., 2018, 9, 543 CrossRef PubMed.
- Y. Aoi, E. R. Smith, A. P. Shah, E. J. Rendleman, S. A. Marshall, A. R. Woodfin, F. X. Chen, R. Shiekhattar and A. Shilatifard, Mol. Cell, 2020, 78, 261–274.e265 CrossRef CAS PubMed.
- E. B. Gibbs, F. Lu, B. Portz, M. J. Fisher, B. P. Medellin, T. N. Laremore, Y. J. Zhang, D. S. Gilmour and S. A. Showalter, Nat. Commun., 2017, 8, 15233 CrossRef CAS PubMed.
- N. T. Burkholder, S. N. Sipe, E. E. Escobar, M. Venkatramani, S. Irani, W. Yang, H. Wu, W. M. Matthews, J. S. Brodbelt and Y. Zhang, ACS Chem. Biol., 2019, 14, 2264–2275 CAS.
- A. Yuryev, M. Patturajan, Y. Litingtung, R. V. Joshi, C. Gentile, M. Gebara and J. L. Corden, Proc. Natl. Acad. Sci. U. S. A., 1996, 93, 6975–6980 CrossRef CAS.
- S. M. Carty and A. L. Greenleaf, Mol. Cell. Proteomics, 2002, 1, 598–610 CrossRef CAS.
- N. J. Krogan, M. Kim, S. H. Ahn, G. Zhong, M. S. Kobor, G. Cagney, A. Emili, A. Shilatifard, S. Buratowski and J. F. Greenblatt, Mol. Cell. Biol., 2002, 22, 6979–6992 CrossRef CAS PubMed.
- C. K. Govind, F. Zhang, H. Qiu, K. Hofmeyer and A. G. Hinnebusch, Mol. Cell, 2007, 25, 31–42 CrossRef CAS PubMed.
- K. D. Meyer, A. J. Donner, M. T. Knuesel, A. G. York, J. M. Espinosa and D. J. Taatjes, EMBO J., 2008, 27, 1447–1457 CAS.
- T. Kim and S. Buratowski, Cell, 2009, 137, 259–272 CrossRef CAS PubMed.
- C. K. Govind, H. Qiu, D. S. Ginsburg, C. Ruan, K. Hofmeyer, C. Hu, V. Swaminathan, J. L. Workman, B. Li and A. G. Hinnebusch, Mol. Cell, 2010, 39, 234–246 CrossRef CAS.
- K. O. Kizer, H. P. Phatnani, Y. Shibata, H. Hall, A. L. Greenleaf and B. D. Strahl, Mol. Cell. Biol., 2005, 25, 3305–3316 CrossRef CAS PubMed.
- M. Li, H. P. Phatnani, Z. Guan, H. Sage, A. L. Greenleaf and P. Zhou, Proc. Natl. Acad. Sci. U. S. A., 2005, 102, 17636–17641 CrossRef CAS.
- A. Moller, S. Q. Xie, F. Hosp, B. Lang, H. P. Phatnani, S. James, F. Ramirez, G. B. Collin, J. K. Naggert, M. M. Babu, A. L. Greenleaf, M. Selbach and A. Pombo, Mol. Cell. Proteomics, 2012, 11, 1–16 CrossRef PubMed.
- K. M. Harlen and L. S. Churchman, Mol. Syst. Biol., 2017, 13, 900 CrossRef.
- K. M. Harlen, K. L. Trotta, E. E. Smith, M. M. Mosaheb, S. M. Fuchs and L. S. Churchman, Cell Rep., 2016, 15, 2147–2158 CrossRef CAS PubMed.
- C. Hintermair, M. Heidemann, F. Koch, N. Descostes, M. Gut, I. Gut, R. Fenouil, P. Ferrier, A. Flatley, E. Kremmer, R. D. Chapman, J. C. Andrau and D. Eick, EMBO J., 2012, 31, 2784–2797 CrossRef CAS PubMed.
- M. S. Akhtar, M. Heidemann, J. R. Tietjen, D. W. Zhang, R. D. Chapman, D. Eick and A. Z. Ansari, Mol. Cell, 2009, 34, 387–393 CrossRef CAS PubMed.
- M. P. Washburn, D. Wolters and J. R. Yates 3rd, Nat. Biotechnol., 2001, 19, 242–247 CrossRef CAS.
- S. Sato, C. Tomomori-Sato, T. J. Parmely, L. Florens, B. Zybailov, S. K. Swanson, C. A. Banks, J. Jin, Y. Cai, M. P. Washburn, J. W. Conaway and R. C. Conaway, Mol. Cell, 2004, 14, 685–691 CrossRef CAS PubMed.
- A. L. Mosley, S. G. Pattenden, M. Carey, S. Venkatesh, J. M. Gilmore, L. Florens, J. L. Workman and M. P. Washburn, Mol. Cell, 2009, 34, 168–178 CrossRef CAS PubMed.
- D. W. Zhang, A. L. Mosley, S. R. Ramisetty, J. B. Rodriguez-Molina, M. P. Washburn and A. Z. Ansari, J. Biol. Chem., 2012, 287, 8541–8551 CrossRef CAS PubMed.
- A. L. Mosley, G. O. Hunter, M. E. Sardiu, M. Smolle, J. L. Workman, L. Florens and M. P. Washburn, Mol. Cell. Proteomics, 2013, 12, 1530–1538 CrossRef CAS PubMed.
- F. Terzi and S. Cambridge, Methods Enzymol., 2017, 585, 29–47 CAS.
- X. Chen, S. Wei, Y. Ji, X. Guo and F. Yang, Proteomics, 2015, 15, 3175–3192 CrossRef CAS.
- G. Pineda, Z. Shen, C. P. de Albuquerque, E. Reynoso, J. Chen, C. C. Tu, W. Tang, S. Briggs, H. Zhou and J. Y. Wang, BMC Res. Notes, 2015, 8, 616 CrossRef.
- I. Ali, D. G. Ruiz, Z. Ni, J. R. Johnson, H. Zhang, P. C. Li, M. M. Khalid, R. J. Conrad, X. Guo, J. Min, J. Greenblatt, M. Jacobson, N. J. Krogan and M. Ott, Mol. Cell, 2019, 74, 1164–1174 CrossRef CAS PubMed.
- C. M. Nemec, F. Yang, J. M. Gilmore, C. Hintermair, Y. H. Ho, S. C. Tseng, M. Heidemann, Y. Zhang, L. Florens, A. P. Gasch, D. Eick, M. P. Washburn, G. Varani and A. Z. Ansari, Proc. Natl. Acad. Sci. U. S. A., 2017, 114, E3944–E3953 CrossRef CAS PubMed.
- Z. Ni, C. Xu, X. Guo, G. O. Hunter, O. V. Kuznetsova, W. Tempel, E. Marcon, G. Zhong, H. Guo, W. W. Kuo, J. Li, P. Young, J. B. Olsen, C. Wan, P. Loppnau, M. El Bakkouri, G. A. Senisterra, H. He, H. Huang, S. S. Sidhu, A. Emili, S. Murphy, A. L. Mosley, C. H. Arrowsmith, J. Min and J. F. Greenblatt, Nat. Struct. Mol. Biol., 2014, 21, 686–695 CrossRef CAS PubMed.
- S. Wittmann, M. Renner, B. R. Watts, O. Adams, M. Huseyin, C. Baejen, K. El Omari, C. Kilchert, D. H. Heo, T. Kecman, P. Cramer, J. M. Grimes and L. Vasiljeva, Nat. Commun., 2017, 8, 14861 CrossRef CAS PubMed.
- E. Vojnic, B. Simon, B. D. Strahl, M. Sattler and P. Cramer, J. Biol. Chem., 2006, 281, 13–15 CrossRef CAS.
- M. A. Verdecia, M. E. Bowman, K. P. Lu, T. Hunter and J. P. Noel, Nat. Struct. Biol., 2000, 7, 639–643 CrossRef CAS.
- M. Zhang, T. E. Frederick, J. VanPelt, D. A. Case and J. W. Peng, J. Biol. Chem., 2020, 295, 16585–16603 CrossRef CAS PubMed.
- J. Liu, S. Fan, C. J. Lee, A. L. Greenleaf and P. Zhou, J. Biol. Chem., 2013, 288, 10890–10901 CrossRef CAS PubMed.
- L.-M. Appel, V. Franke, M. Bruno, I. Grishkovskaya, A. Kasiliauskaite, U. E. Schoeberl, M. G. Puchinger, S. Kostrhon, E. Beltzung, K. Mechtler, G. Lin, A. Vlasova, M. Leeb, R. Pavri, A. Stark, A. Akalin, R. Stefl, C. Bernecky, K. Djinovic-Carugo and D. Slade, bioRxiv, 2020 DOI:10.1101/2020.02.11.943159.
- T. Sikorsky, F. Hobor, E. Krizanova, J. Pasulka, K. Kubicek and R. Stefl, Nucleic Acids Res., 2012, 40, 11748–11755 CrossRef CAS PubMed.
- P. Brazda, M. Krejcikova, A. Kasiliauskaite, E. Smirakova, T. Klumpler, R. Vacha, K. Kubicek and R. Stefl, J. Mol. Biol., 2020, 432, 4092–4107 CrossRef CAS.
- D. Eick and M. Geyer, Chem. Rev., 2013, 113, 8456–8490 CrossRef CAS PubMed.
- I. Kwon, M. Kato, S. Xiang, L. Wu, P. Theodoropoulos, H. Mirzaei, T. Han, S. Xie, J. L. Corden and S. L. McKnight, Cell, 2013, 155, 1049–1060 CrossRef CAS PubMed.
- K. A. Burke, A. M. Janke, C. L. Rhine and N. L. Fawzi, Mol. Cell, 2015, 60, 231–241 CrossRef CAS PubMed.
- D. Hnisz, K. Shrinivas, R. A. Young, A. K. Chakraborty and P. A. Sharp, Cell, 2017, 169, 13–23 CrossRef CAS PubMed.
- C. Jeronimo, P. Collin and F. Robert, J. Mol. Biol., 2016, 428, 2607–2622 CrossRef CAS PubMed.
- A. A. Hyman, C. A. Weber and F. Julicher, Annu. Rev. Cell Dev. Biol., 2014, 30, 39–58 CrossRef CAS PubMed.
- S. F. Banani, A. M. Rice, W. B. Peeples, Y. Lin, S. Jain, R. Parker and M. K. Rosen, Cell, 2016, 166, 651–663 CrossRef CAS PubMed.
- Y. Shin and C. P. Brangwynne, Science, 2017, 357, eaaf4382 CrossRef PubMed.
- S. Alberti, A. Gladfelter and T. Mittag, Cell, 2019, 176, 419–434 CrossRef CAS PubMed.
- Y. R. Kamimura and M. Kanai, Bull. Chem. Soc. Jpn., 2021, 94, 1045–1058 CrossRef CAS.
- Y. E. Guo, J. C. Manteiga, J. E. Henninger, B. R. Sabari, A. Dall'Agnese, N. M. Hannett, J. H. Spille, L. K. Afeyan, A. V. Zamudio, K. Shrinivas, B. J. Abraham, A. Boija, T. M. Decker, J. K. Rimel, C. B. Fant, T. I. Lee, I. I. Cisse, P. A. Sharp, D. J. Taatjes and R. A. Young, Nature, 2019, 572, 543–548 CrossRef CAS.
- M. Boehning, C. Dugast-Darzacq, M. Rankovic, A. S. Hansen, T. Yu, H. Marie-Nelly, D. T. McSwiggen, G. Kokic, G. M. Dailey, P. Cramer, X. Darzacq and M. Zweckstetter, Nat. Struct. Mol. Biol., 2018, 25, 833–840 CrossRef CAS PubMed.
- P. Quintero-Cadena, T. L. Lenstra and P. W. Sternberg, Mol. Cell, 2020, 79, 207–220 CrossRef CAS PubMed.
- A. Boija, I. A. Klein, B. R. Sabari, A. Dall'Agnese, E. L. Coffey, A. V. Zamudio, C. H. Li, K. Shrinivas, J. C. Manteiga, N. M. Hannett, B. J. Abraham, L. K. Afeyan, Y. E. Guo, J. K. Rimel, C. B. Fant, J. Schuijers, T. I. Lee, D. J. Taatjes and R. A. Young, Cell, 2018, 175, 1842–1855 CrossRef CAS PubMed.
- J. F. Kribelbauer, C. Rastogi, H. J. Bussemaker and R. S. Mann, Annu. Rev. Cell Dev. Biol., 2019, 35, 357–379 CrossRef CAS PubMed.
- H. Lu, D. Yu, A. S. Hansen, S. Ganguly, R. Liu, A. Heckert, X. Darzacq and Q. Zhou, Nature, 2018, 558, 318–323 CrossRef CAS PubMed.
- A. Patel, H. O. Lee, L. Jawerth, S. Maharana, M. Jahnel, M. Y. Hein, S. Stoynov, J. Mahamid, S. Saha, T. M. Franzmann, A. Pozniakovski, I. Poser, N. Maghelli, L. A. Royer, M. Weigert, E. W. Myers, S. Grill, D. Drechsel, A. A. Hyman and S. Alberti, Cell, 2015, 162, 1066–1077 CrossRef CAS PubMed.
- B. Portz and J. Shorter, Trends Biochem. Sci., 2020, 45, 1–3 CrossRef CAS PubMed.
- I. Kwon, M. Kato, S. Xiang, L. Wu, P. Theodoropoulos, H. Mirzaei, T. Han, S. Xie, J. L. Corden and S. L. McKnight, Cell, 2013, 155, 1049–1060 CrossRef CAS.
- R. Becker, B. Loll and A. Meinhart, J. Biol. Chem., 2008, 283, 22659–22669 CrossRef CAS PubMed.
- L. H. Gregersen, R. Mitter, A. P. Ugalde, T. Nojima, N. J. Proudfoot, R. Agami, A. Stewart and J. Q. Svejstrup, Cell, 2019, 177, 1797–1813 CrossRef CAS PubMed.
- L. Vasiljeva, M. Kim, H. Mutschler, S. Buratowski and A. Meinhart, Nat. Struct. Mol. Biol., 2008, 15, 795–804 CrossRef CAS.
- K. Kubicek, H. Cerna, P. Holub, J. Pasulka, D. Hrossova, F. Loehr, C. Hofr, S. Vanacova and R. Stefl, Genes Dev., 2012, 26, 1891–1896 CrossRef CAS PubMed.
- A. Meinhart and P. Cramer, Nature, 2004, 430, 223–226 CrossRef CAS PubMed.
- B. M. Lunde, S. L. Reichow, M. Kim, H. Suh, T. C. Leeper, F. Yang, H. Mutschler, S. Buratowski, A. Meinhart and G. Varani, Nat. Struct. Mol. Biol., 2010, 17, 1195–1201 CrossRef CAS PubMed.
- O. Jasnovidova, M. Krejcikova, K. Kubicek and R. Stefl, EMBO Rep., 2017, 18, 906–913 CrossRef CAS PubMed.
- T. Kecman, K. Kus, D. H. Heo, K. Duckett, A. Birot, S. Liberatori, S. Mohammed, L. Geis-Asteggiante, C. V. Robinson and L. Vasiljeva, Cell Rep., 2018, 25, 259–269 CrossRef CAS PubMed.
- Z. Li, H. Li, G. Devasahayam, T. Gemmill, V. Chaturvedi, S. D. Hanes and P. Van Roey, Biochemistry, 2005, 44, 6180–6189 CrossRef CAS PubMed.
- D. Atencio, C. Barnes, T. M. Duncan, I. M. Willis and S. D. Hanes, G3: Genes, Genomes, Genet., 2014, 4, 523–537 CrossRef CAS.
- J. K. Myers, D. P. Morris, A. L. Greenleaf and T. G. Oas, Biochemistry, 2001, 40, 8479–8486 CrossRef CAS PubMed.
- M. Zhang, X. J. Wang, X. Chen, M. E. Bowman, Y. Luo, J. P. Noel, A. D. Ellington, F. A. Etzkorn and Y. Zhang, ACS Chem. Biol., 2012, 7, 1462–1470 CrossRef CAS PubMed.
- D. Close, S. J. Johnson, M. A. Sdano, S. M. McDonald, H. Robinson, T. Formosa and C. P. Hill, J. Mol. Biol., 2011, 408, 697–713 CrossRef CAS PubMed.
- A. Mayer, M. Heidemann, M. Lidschreiber, A. Schreieck, M. Sun, C. Hintermair, E. Kremmer, D. Eick and P. Cramer, Science, 2012, 336, 1723–1725 CrossRef CAS.
- S. M. Yoh, H. Cho, L. Pickle, R. M. Evans and K. A. Jones, Genes Dev., 2007, 21, 160–174 CrossRef CAS PubMed.
- M. Sun, L. Lariviere, S. Dengl, A. Mayer and P. Cramer, J. Biol. Chem., 2010, 285, 41597–41603 CrossRef CAS PubMed.
- D. Y. Zhao, G. Gish, U. Braunschweig, Y. Li, Z. Ni, F. W. Schmitges, G. Zhong, K. Liu, W. Li, J. Moffat, M. Vedadi, J. Min, T. J. Pawson, B. J. Blencowe and J. F. Greenblatt, Nature, 2016, 529, 48–53 CrossRef.
- R. Sprangers, M. R. Groves, I. Sinning and M. Sattler, J. Mol. Biol., 2003, 327, 507–520 CrossRef CAS PubMed.
- K. Liu, Y. Guo, H. Liu, C. Bian, R. Lam, Y. Liu, F. Mackenzie, L. A. Rojas, D. Reinberg, M. T. Bedford, R. M. Xu and J. Min, PLoS One, 2012, 7, e30375 CrossRef CAS PubMed.
| This journal is © The Royal Society of Chemistry 2021 |