
 Open Access Article
 This Open Access Article is licensed under a Creative Commons Attribution-Non Commercial 3.0 Unported Licence
Evaluating the effect of ionic strength on PNA:DNA duplex formation kinetics†
Colin S.
Swenson‡
 a,
Hershel H.
Lackey‡
b,
Eric J.
Reece
b,
Joel M.
Harris
b,
Jennifer M.
Heemstra
a and
Eric M.
Peterson
*b
a,
Hershel H.
Lackey‡
b,
Eric J.
Reece
b,
Joel M.
Harris
b,
Jennifer M.
Heemstra
a and
Eric M.
Peterson
*b
aDepartment of Chemistry, Emory University, Atlanta, GA 30322, USA
bDepartment of Chemistry, University of Utah, Salt Lake City, UT 84112, USA
First published on 21st May 2021
Abstract
Peptide nucleic acid (PNA) is a unique synthetic nucleic acid analog that has been adopted for use in many biological applications. These applications rely upon the robust Franklin–Watson–Crick base pairing provided by PNA, particularly at lower ionic strengths. However, our understanding of the relationship between the kinetics of PNA:DNA hybridization and ionic strength is incomplete. Here we measured the kinetics of association and dissociation of PNA with DNA across a range of ionic strengths and temperatures at single-molecule resolution using total internal reflection fluorescence imaging. Unlike DNA:DNA duplexes, PNA:DNA duplexes are more stable at lower ionic strength, and we demonstrate that this is due to a higher association rate. While the dissociation rate of PNA:DNA duplexes is largely insensitive to ionic strength, it is significantly lower than that of DNA:DNA duplexes having the same number and sequence of base pairing interactions. The temperature dependence of PNA:DNA kinetic rate constants indicate a significant enthalpy barrier to duplex dissociation, and to a lesser extent, duplex formation. This investigation into the kinetics of PNA:DNA hybridization provides a framework towards better understanding and design of PNA sequences for future applications.
Introduction
Nucleic acids are virtually unrivaled in their ability to store information and translate sequence into structure via Franklin–Watson–Crick (FWC) base pairing. Through the rules of complementary hybridization, interactions and structures can be predicted with a high degree of accuracy. This has led to uses in many applications ranging from therapeutics and diagnostics to materials and programming.1–4 However, these applications remain limited by the propensity of naturally occurring DNA and RNA for chemical and biological degradation, for example by nucleases present in biological systems. To mitigate this issue, researchers have attempted to improve the stability of natural nucleic acids through substitutions or modifications of the native phosphodiester and sugar backbone.5–7 These synthetic biological polymers, or xeno nucleic acids (XNAs), often offer significant stability advantages over natural nucleic acids, and some offer additional benefits including enhanced duplex thermostability, parallel information systems, and unique secondary structures. While numerous types of XNAs have been reported, peptide nucleic acid (PNA) is one of the most commonly used and studied XNAs due to its nuclease resistance, strong hybridization with natural oligonucleotides, and highly modifiable structure.8PNA is an entirely synthetic nucleic acid analogue wherein the nucleobases are arrayed along a neutral N-(2-aminoethyl)-glycine backbone in place of the negatively charged phosphate backbone of canonical DNA and RNA (Fig. 1).9 This unique pseudopeptide backbone is responsible for dramatically altering the interactions of nucleic acids and proteins with PNA. For example, PNA is unrecognized by hydrolases, resulting in much higher stability in biological environments.10,11 Additionally, PNA is capable of FWC base-pairing similar to canonical nucleic acids, however the formed heteroduplexes exhibit much higher thermal stability than observed for natural nucleic acids.12,13 These properties have made PNA an attractive choice for numerous applications involving antisense agents, duplex-invasion gene editing, nucleic acid biosensors, stimuli-responsive materials, and tools for cellular imaging.14–25
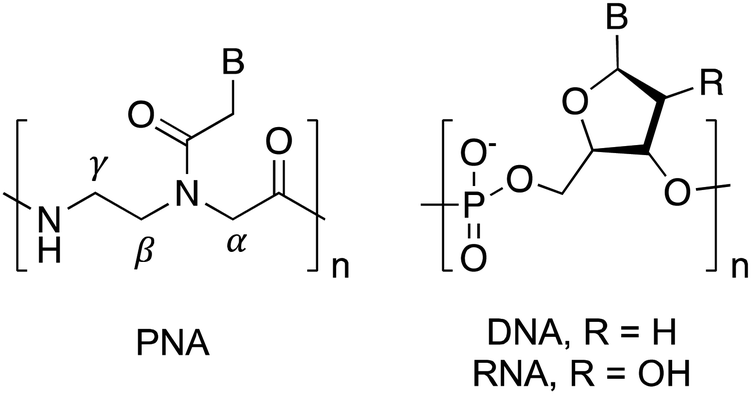 | ||
| Fig. 1 Structures of DNA, RNA, and PNA. | ||
Since the increased thermostability of PNA hybridization with DNA or RNA is a key attribute for many applications, understanding these interactions is of critical importance. PNA hybridization surprisingly demonstrates a negative salt dependence wherein lower ionic strength results in increased duplex stability.13,26,27 This is the inverse of the trend for natural nucleic acid duplexes, and has led to studies of PNA:DNA and PNA:RNA duplex stability predominantly being performed at ionic strengths far below physiological levels.28 Moreover, the mechanism by which ionic strength governs PNA duplex stability remains poorly understood.
Techniques used to study nucleic acid hybridization such as gel electrophoresis or calorimetry rely upon bulk measurements of entire populations of molecules and offer little information about individual events. Conversely, single-molecule imaging techniques such as DNA-PAINT take advantage of the programmability of nucleic acids to enable super-resolution microscopy.29–31 Transient binding events of single DNA molecules to localized complementary sequences facilitate decoupling of binding events to dye photophysics and other off-target signals. These approaches offer excellent advantages over bulk methods, as they not only give detailed kinetic and thermodynamic information about the process, but also provide insight into heterogeneity at the single-molecule level.29,32,33 DNA-PAINT has undergone rapid development in the last 10 years, with reports focused on using this technology to quantitatively count molecules,34,35 increasing the DNA binding rate to improve throughput,36,37 and harnessing the unique kinetic signature of specific DNA sequences to multiplex measurements.38 These advances have expanded the toolbox of single-molecule imaging techniques, making them an ideal method to quantify oligonucleotide binding kinetics.
The effect of ionic strength on the mechanism of DNA:DNA and DNA:RNA duplex formation has been extensively studied at the single-molecule level using kinetic measurements.39,40 In contrast, previous methods to investigate PNA:DNA hybridization kinetics have relied upon ensemble measurements of populations of molecules in solution and on surfaces.27,41–44 While informative conclusions of the ionic strength dependence on hybridization have been drawn, there is evidence that heterogeneity at surfaces can cause deviations from expected trends due to surface organization barriers or interactions.45,46 Therefore, we sought to use single-molecule techniques to measure the duplex formation kinetics, which allows us to distinguish specific from nonspecific interactions by the distinct kinetic rate constants measured at individual binding sites. Herein we applied a previously described single-molecule kinetics measurement technique to measure the effect of ionic strength on the kinetics of PNA:DNA duplex formation.40 By employing an anchor DNA attached to a glass slide to immobilize a DNA capture strand that binds a diffusible TAMRA-labeled PNA probe, we measured the kinetics of duplex formation at the single-molecule level over a range of ionic strengths (50–450 mM NaCl) and temperatures (22.5–30 °C) using total internal reflection (TIRF) spectroscopy (Fig. 2). We report that the increase in stability at lower ionic strengths stems from a faster association rate, while the dissociation rate remains largely unaffected. This is in contrast to a comparable DNA:DNA duplex, wherein both a faster association rate and a slower dissociation rate contribute to increased duplex stability as ionic strength is increased. These results imply that high ionic strength increases the DNA:DNA duplex stability both by decreasing the transition state barrier to association and by increasing the barrier to dissociation significantly. In contrast, ionic strength has little influence on the barrier to PNA:DNA duplex dissociation, but decreases the barrier to association and the free energy of the duplex, implying that ionic strength affects the free energy of the uncomplexed single stranded DNA and PNA. As a result, the association rate of PNA with complementary nucleic acids is expected to have significant impact on its function in biological and nanotechnology applications. This investigation of ionic strength dependence of PNA:DNA duplex formation provides the beginning of a framework for understanding and design of future PNA applications.
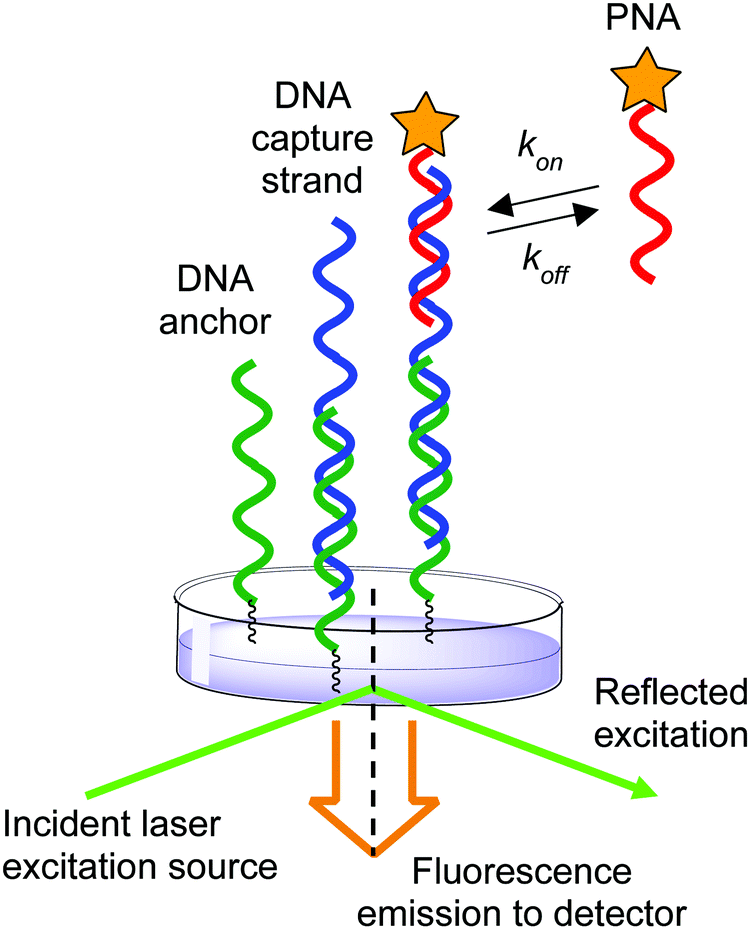 | ||
| Fig. 2 Schematic of experimental setup illustrating the anchor DNA, immobilized DNA capture strand, and diffusing PNA probe. | ||
Results and discussion
In order to determine the effect of ionic strength and temperature on the kinetics of PNA:DNA duplex formation, we employed a previously reported single-molecule platform for observing nucleic acid hybridization.40 Glass slides were covalently functionalized with DNA capture strands through an amine-epoxide reaction (see Materials and methods for details). Unreacted sites were capped using 3-amino-1-propanesulfonic acid to reduce nonspecific adsorption to the surface. A DNA capture probe was immobilized through hybridization with the capture DNA. This probe contains an anchoring sequence and a sequence complementary to a target PNA separated by a short polypyrimidine linker (Table S1, ESI†). Hybridization kinetics were measured with a fluorescently labeled 9mer PNA sequence, and 9mer and 11mer (DNA-2A) DNA targets, as duplexes of this length had easily detectable dissociation times (3–50 s) over the range of temperatures and ionic strengths investigated (Table S1, ESI†).47 A thin volume of sample at the interface limited by a ∼150 nm depth of penetration of the evanescent excitation was imaged using a TIRF microscope to observe single-molecule hybridization events with the DNA capture probe immobilized at the glass surface while excluding background fluorescence from target oligomers in solution. Time-lapse fluorescence images were acquired and analyzed to determine the location of each target PNA or DNA binding event, as described in Material and methods. We observed a significant number of repeated events at specific locations on the substrate, indicating that PNA and DNA target molecules are capable of interacting with individual immobilized DNA probes. We distinguished DNA probe molecules from sites of nonspecific adsorption or other anomalous binding using their distinct and homogeneous kinetic signature, as described in ESI† (Fig. S1–S3).40 The association and dissociation interval lifetimes from all the distinct DNA probe molecule sites were used to calculate an average association rate constant, kon, and dissociation rate constant, koff of hybridization (Fig. S4, ESI†). Significantly fewer binding sites were observed on substrates lacking immobilized DNA capture probe, indicating specific hybridization interactions account for 95% of all detected binding sites (Fig. S5 and S6, ESI†). Hybridization was measured at target concentrations between 7 and 30 nM, with the majority of the data for the PNA, DNA, and DNA-2A Target collected at 30 nM solution concentration. In addition, we observed a linear increase in the association rate, and no trend in the dissociation rate with varying in PNA target concentration (Fig. S7, ESI†), consistent with pseudo-first-order association and first-order dissociation kinetics.Comparison of PNA:DNA and DNA:DNA hybridization kinetics
In order to directly compare the formation kinetics of DNA:DNA and PNA:DNA duplexes, we measured the association and dissociation rate constants of 9mer DNA and 9mer PNA targets of the same sequence with immobilized probe DNA at 450 mM ionic strength and 22.5 °C (Fig. 3 and Table S2, ESI†). Compared to DNA:DNA duplex formation, PNA:DNA had a lower association rate constant (4-fold) and a vastly slower dissociation rate constant (14-fold). The resulting association constant, Ka= kon/koff, for PNA:DNA was much larger (4-fold) than the equivalent DNA:DNA duplex, in agreement with other studies of PNA duplex stability (Fig. 3C and Table S2, ESI†).9,10,12 This result is significant for applications that use PNA sequence recognition, such as antisense therapeutics, nucleic acid diagnostics, and gene editing, as it shows that the PNA heteroduplexes have longer lifetimes than native DNA:DNA duplexes, but are formed more slowly.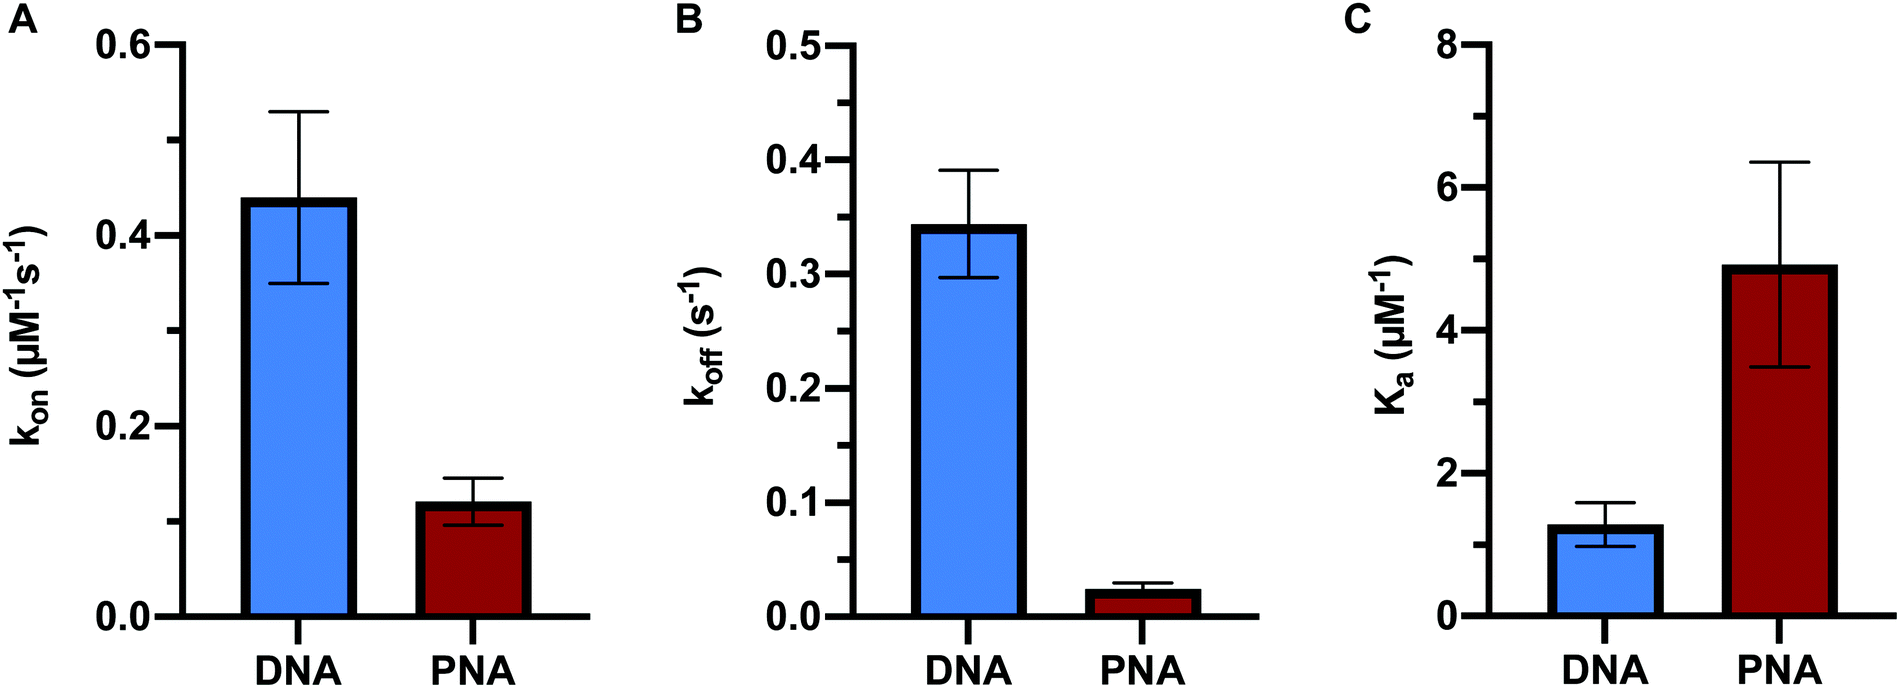 | ||
| Fig. 3 Comparison of 9-mer DNA and PNA target hybridization kinetics showing (A) association rate constant, (B) dissociation rate constant, and (C) association constant. All data was measured at 450 mM NaCl at 22.5 °C. PNA sequence: CTGT ATC CATN-TAMRA. DNA sequence: 3′-TGT ATC CAT-TAMRA-5′. Error bars represent 2 times the standard error of the mean (n = 3), each probing 2500 ± 700 immobilized probe molecules. | ||
Comparison of hybridization kinetics at varying ionic strength
Previous work has indicated that the trends in PNA:DNA duplex stability with ionic strength are the inverse of those seen with DNA:DNA duplexes.26 To investigate this further, we measured how the association and dissociation rates of both PNA:DNA and DNA:DNA hybridization varied as a function of sodium chloride concentration over a range of 50–450 mM (Tables S3 and S4, ESI†). Initially we used a 9mer DNA of the same sequence as the PNA target (Table S1, ESI†), as shown in Fig. 3. However, due to the lower affinity of DNA:DNA duplexes compared to PNA:DNA duplexes, this sequence had short hybridized lifetimes and long intervals between hybridization events at ionic strengths below 250 mM that made molecule tracking difficult (data not shown). To impart similar stability to the PNA:DNA duplex, we used an 11mer DNA target designated “DNA-2A” with two additional adenosine bases complementary to the DNA capture probe (Table S1, ESI†). The hybridization kinetics of DNA-2A were measured across the same range of salt concentrations (50–450 mM NaCl) at 22.5 °C (Table S3, ESI†).Both the association and dissociation rates of DNA-2A:DNA hybridization were strongly affected by ionic strength. The association rate constant increased 6-fold (Fig. 4A), while the dissociation rate constant decreased 4-fold (Fig. 4B) as ionic strength increased from 50 mM to 450 mM. The net effect on the association constant, Ka= kon/koff, is a very significant 25-fold increase over this ionic strength range (Fig. 5A and Table S3, ESI†), similar to results reported previously.28
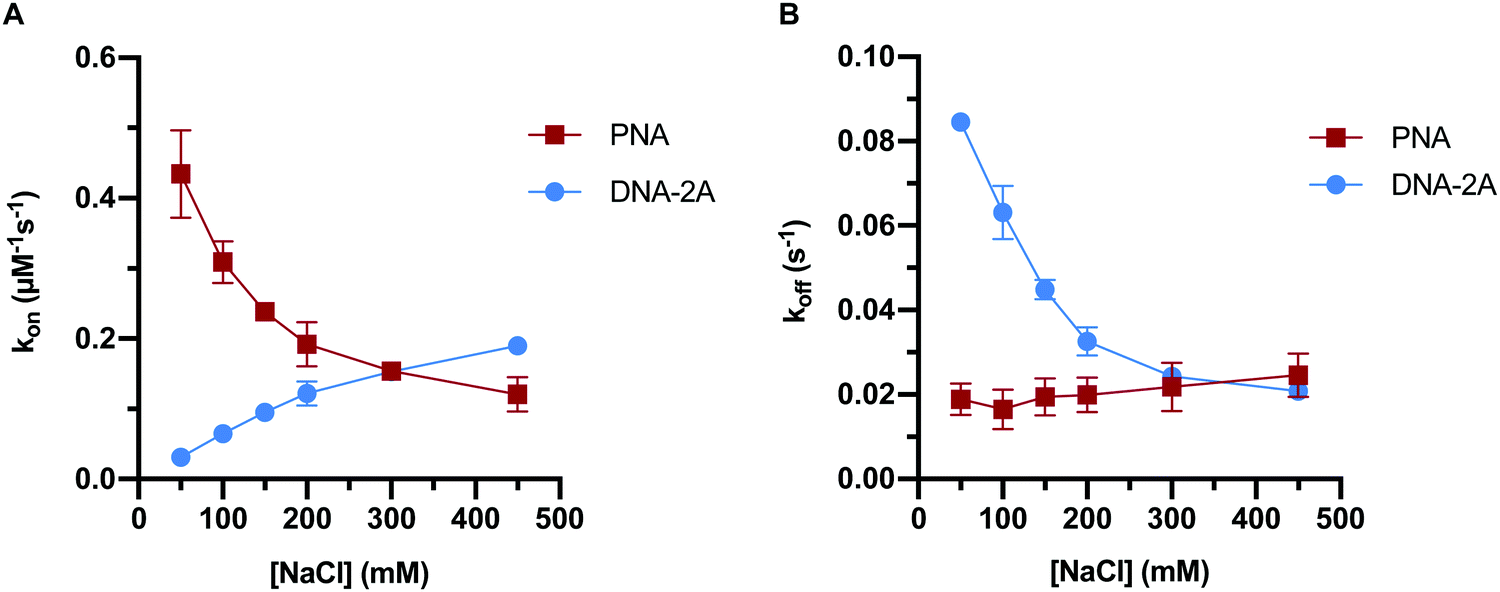 | ||
| Fig. 4 Plots of association (A) and dissociation (B) rates of PNA or DNA-2A hybridization to DNA capture probe with increasing ionic strength. Error bars represent 2 standard error of the mean (n = 3) from data sets with an average of 1100 ± 200 molecules each. | ||
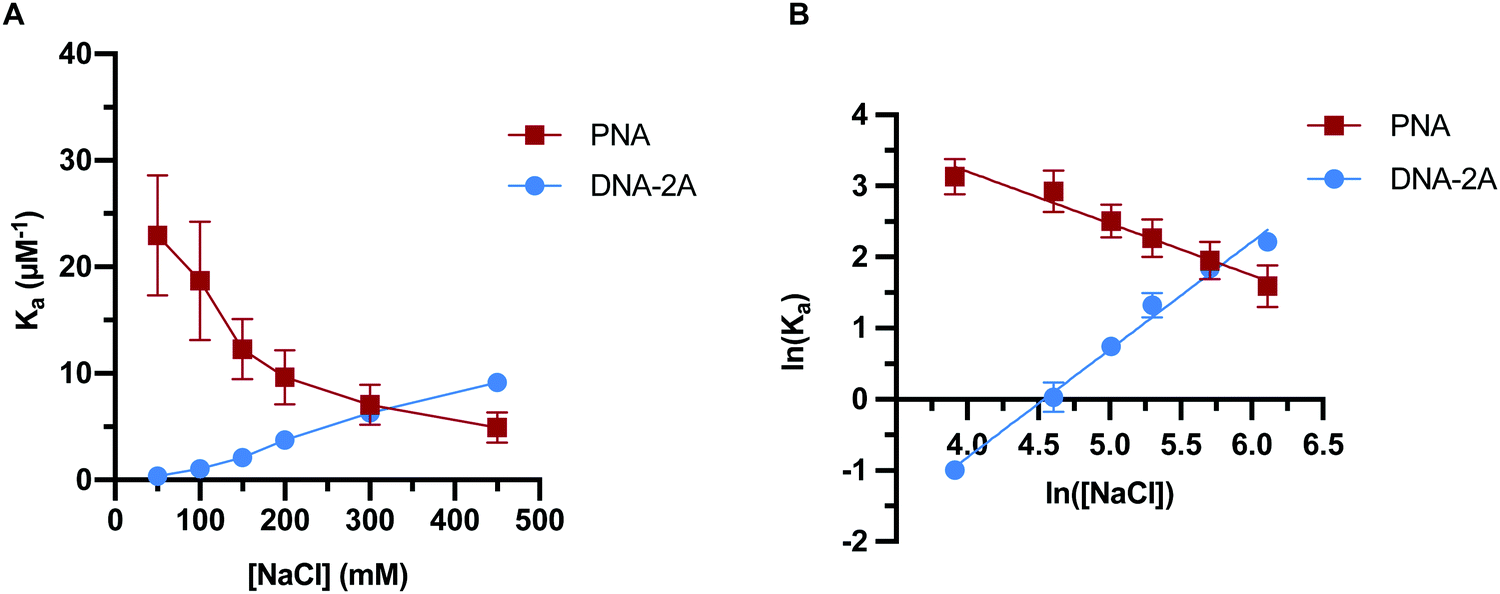 | ||
| Fig. 5 Trends in duplex association constant for PNA and DNA-2A with ionic strength at 22.5 °C with (A) linear plot and (B) Leipply type analysis of log–log plot. Error bars represent 2 standard error of the mean (n = 3) from data sets with an average of 1100 ± 200 molecules each. | ||
The PNA:DNA duplex showed very different trends with changing ionic strength compared to DNA-2A:DNA. Kinetic rate constants for PNA:DNA duplex formation are shown in Fig. 4, with the rate constant and error estimates extrapolated from a fit48 of the temperature-dependent rate data to the Eyring equation49 (Fig. S9 and S10, ESI†). We observed a 3.6-fold decrease in association rate with increasing ionic strength from 50 mM to 450 mM at 22.5 °C (Fig. 4A). Unlike DNA:DNA hybridization, the dissociation rate increased slightly (1.7-fold) with ionic strength (Fig. 4B). The association constant calculated from the kinetic rate constants at each salt concentration (Fig. 5A and Table S4, ESI†), show that the stability of the PNA:DNA duplex increases at lower ionic strengths, which is in agreement with previous thermal melting studies.13,26 The magnitude of change in duplex stability with ionic strength for the PNA target is only 5-fold, significantly less than the 25-fold change seen for DNA-2A. This is primarily due to the weak dependence of koff for the PNA target unlike the DNA target that has a strongly decreasing koff. As a result, the increase in PNA:DNA duplex stability at lower ionic strengths can be mainly attributed to an increase in the association rate. This is possibly due to an ionic stabilization of the single stranded oligomers in the bulk solution, similar to “salting in” effects observed with proteins.50,51 Increasing salt concentration may improve the solubility and decrease the free energy of the single-stranded PNA, thus increasing the barrier to duplex formation. Another possibility is that the single-stranded DNA adopts a more elongated structure due to increased electrostatic repulsion between negatively charged phosphate groups. This could make the DNA more accessible and decrease the energy barrier for duplex formation with PNA.
In order to further elucidate the role of ionic strength on PNA:DNA and DNA:DNA hybridization, we performed a Leipply analysis from the calculated Ka values.52 This analysis relates the association constant to the concentration of ions in solution to understand the relationship between duplex formation and ions either ejected or absorbed upon hybridization. A plot of the ln(Ka) vs. ln([NaCl]) fit to a simple linear regression provides a magnitude of the slope (Fig. 5B). The magnitude and sign of the slope relates to the change in the number of ions involved in duplex formation, with a negative slope suggesting ions are ejected into the bulk solution and a positive slope suggesting that ions are incorporated into the duplex.
This analysis resulted in a linear fit for both DNA-2A and PNA targets. The DNA-2A target has a positive slope, indicating ions are incorporated into the duplex upon hybridization. It is generally thought that cations condense onto the DNA duplex to screen electrostatic repulsion between the charged phosphate groups in the DNA backbone. At high salt concentration, ion condensation on the DNA duplex is more favorable. In contrast, the Leipply plot for PNA:DNA hybridization (Fig. 5B) has a negative slope, indicating that ions are ejected into the bulk solution upon hybridization. The requirement of ejecting ions for duplex formation may explain the decrease in association rate and affinity for PNA:DNA duplexes, as this process is less favorable at high salt concentrations. The larger magnitude of the slope for DNA (1.5) compared to PNA (−0.73) also demonstrated that more ions are exchanged in formation of the more highly charged DNA:DNA duplex. These changes in ion-pairing may influence some of the trends seen in the kinetics. For instance, bringing PNA and DNA into close proximity to form the transition state may require disrupting ion-pairing between cations and anionic DNA phosphate groups. This process would be more favorable at low ionic strength where the electrolyte is more dilute, reducing the energy barrier to ion ejection and duplex formation.
Effect of temperature on PNA:DNA hybridization kinetics
Finally, we investigated how temperature affects the kinetics of PNA:DNA duplex formation. As described above, the association and dissociation rates of PNA:DNA hybridization were determined over a range of salt concentrations (50–450 mM NaCl) and temperatures (22.5–30 °C) (Table S4 and Fig. 6A, B). As previously observed with DNA:DNA duplex formation,26 increasing temperature results in increasing PNA:DNA association and dissociation rates across all ionic strengths, with a net decrease in Ka with temperature (Fig. 6C). Much like with DNA, dissociation rate constants are affected more significantly with temperature than association rate constants. We attempted to model changes in the transition state enthalpy and entropy barriers39 using the linearized Eyring equation49 but did not observe significant trends with ionic strength due to large covariance between the enthalpy and entropy values (Fig. S9 and S10, ESI†). However, we do observe a significant enthalpy barrier to association, and significant enthalpy and entropy barriers to dissociation (Tables S5–S7, ESI†). These results indicate that thermostability trends in the kinetics of PNA:DNA duplex formation are qualitatively similar to those seen for DNA:DNA duplex formation.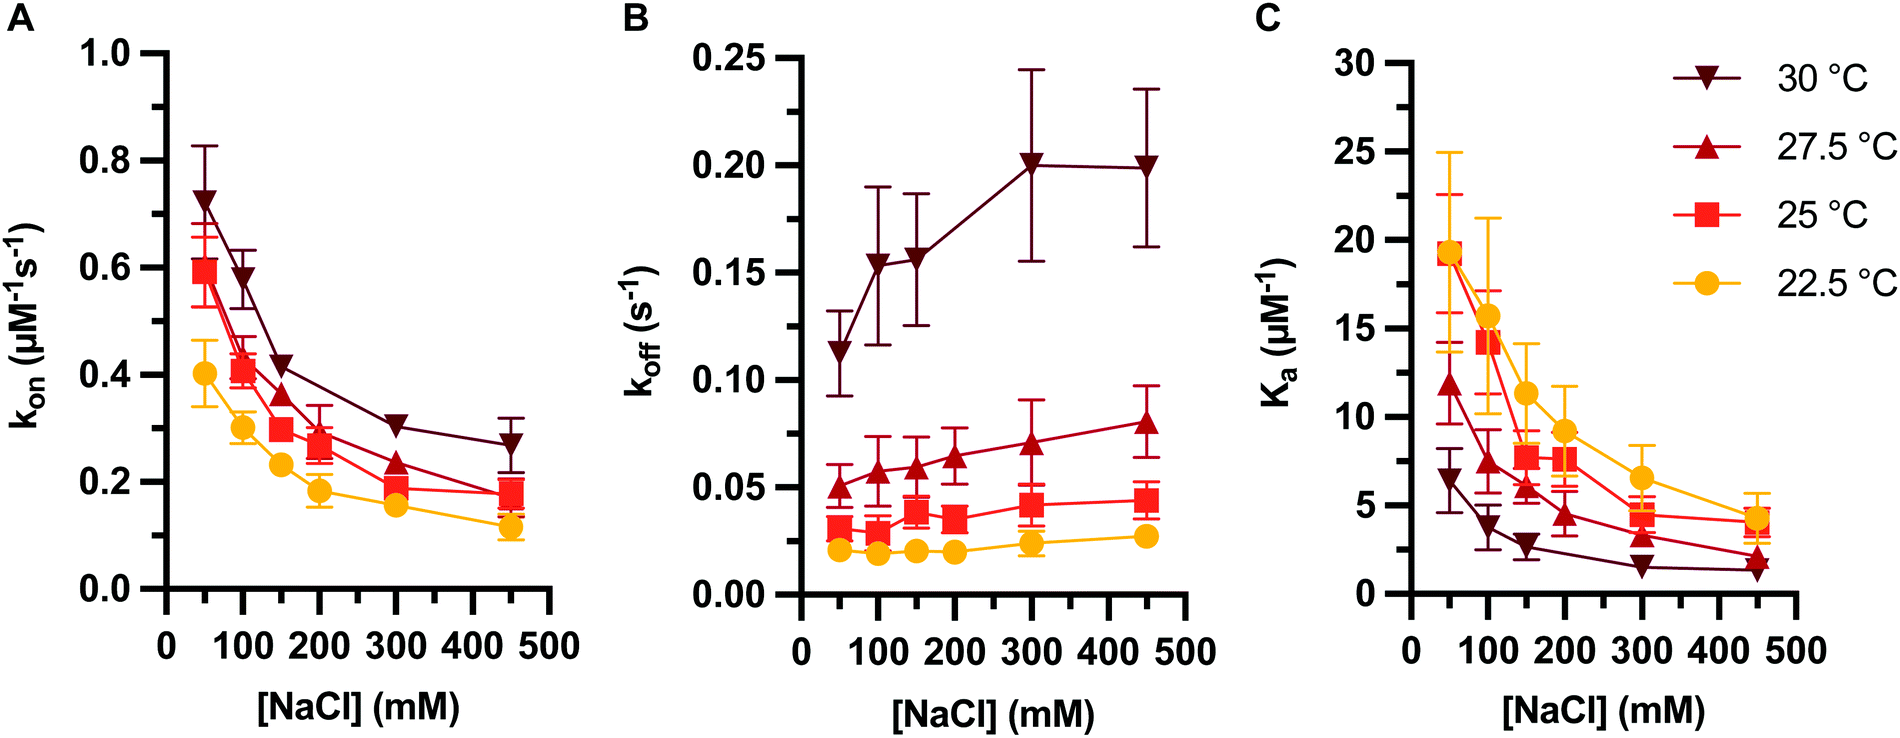 | ||
| Fig. 6 PNA target duplex formation kinetics and association constant at varying temperature and ionic strength, showing (A) association rate constant, (B) dissociation rate constant, and (C) association constant. Rate constants determined on data sets with an average of 960 ± 70 molecules each. Error bars represent two standard errors estimated as described in ESI.† | ||
Conclusions
The ability to store information and accurately predict assembly through complementary hybridization of nucleic acids is a major driving force for biology and nanotechnology. In particular, PNA exhibits desirable properties for use in these applications, including stable and specific base pairing to complementary targets, even at ionic strengths much lower than physiological levels.13,26,27 Proper design and utilization of PNA probes in applications such as nucleic acid diagnostics and materials benefit from detailed knowledge about the mechanisms underlying hybridization. While such information is available for DNA:DNA duplexes, we investigated the less-studied relationship between the rates of PNA:DNA duplex formation and ionic strength using single-molecule imaging techniques. By measuring the association and dissociation events of a PNA probe with a complementary DNA capture strand, we discovered that the dissociation rate is minimally affected by ionic strength, whereas the association rate significantly increases at lower salt concentrations. We propose that it is this change in the association rate that is the main contributor for the increased PNA:DNA duplex stability at low ionic strengths. When compared to a DNA:DNA duplex of the same sequence, dissociation rate constants for PNA:DNA duplexes were less affected by ionic strength, and the difference in duplex stability is due to a significantly slower dissociation rate of PNA:DNA duplexes vs. DNA:DNA even at high ionic strength.A major benefit of using PNA probes as nucleic acid detection and therapeutics is the capability for strong hybridization over ranges of ionic strengths. In this model system, we carried out measurements in the presence of varying NaCl. However, we recognize that complex environments can contain a mixture of mono- and divalent ions. Further studies will include additional salts to better represent the effect of different ions on PNA:DNA hybridization. These ions include the Hofmeister series, which is a series of anions that are commonly studied for protein purification through a “salting out” effect.53,54 Because the neutral backbone of PNA is similar to that of proteins, we will investigate how these anions and the role of hydration affect the kinetics of PNA duplex formation.
The kinetics of PNA hybridization play pivotal roles for nucleic acid detection, antisense interactions, and gene editing among others. Fundamental understanding of these rates provides a framework for efficient design and prediction of activity of diverse PNA probes. We believe our findings offer a basis for future experiments to investigate hybridization kinetics as well as the optimization of existing PNA-based applications.
Materials and methods
Abbreviations
Fmoc, fluorenylmethyloxycarbonyl; DMF, dimethylformamide; HATU, 1-[Bis(dimethylamino)methylene]-1H-1,2,3-triazolo[4,5-b]pyridinium 3-oxid hexafluorophosphate; NMM, N-methylmorpholine; DIPEA, diisopropylethylamine; TFA, trifluoroacetic acid; DCM, dichloromethane; NMP, N-methyl-2-pyrrolidone; NHS, N-hydroxysuccinimide; FAM, 5,6-carboxyfluoroscein.PNA oligomer synthesis
PNA was synthesized using a standard solid-phase synthesis protocol on a Biotage SP wave semi-automatic synthesizer. Synthesis began by loading ∼50 mg of a rink amide MBHA resin (0.52 mmol g−1) with 5 μmols of the first Fmoc-PNA monomer or Fmoc-amino acid using 1.5 eq. HATU, 1.5 eq. DIPEA, and 1.5 eq. 2,6-lutidine in 200 μL dry NMP for 1 hour followed by capping using a solution of 9% acetic anhydride and 13% 2,6-lutidine in DMF. The resin was then deprotected with a solution of 25% piperidine in DMF. For monomer couplings, 5 eq. of monomer was pre-activated for 10 minutes with 5 eq. HATU, 5 eq. DIPEA, and 5 eq. 2,6-lutidine in 400 μL NMP before addition to the resin. Coupling proceeded with microwave-assistance at 75 °C for 6 min. The resin was then washed (5 × 1 mL DMF), capped using the capping solution (2 × 5 min with 1 mL each), washed (5 × 1 mL DMF, 3 × 1 mL DCM, 3 × 1 mL DMF), deprotected with deprotection solution (3 × 2 min with 1 mL each), and washed (5 × 1 mL DMF, 3 × 1 mL DCM, 3 × 1 mL DMF) to complete a coupling cycle. NHS-Rhodamine (TAMRA) was coupled to the resin using DIPEA or HATU/DIPEA in DMF following the final PNA monomer. Upon completion of synthesis, the resin was washed with DCM and dried before cleavage using a solution of 2.5% H2O and 2.5% TIS in TFA. The crude oligomer was ether precipitated, washed with ether, and dried for purification. Purification was performed by reverse-phase HPLC using an Agilent Eclipse XDB-C18 5 μm, 9.4 × 250 mm column at 60 °C with a flow rate of 2 mL min−1, monitored at 260 nm using a linear gradient (10–40% in 15 min) of 0.1% TFA/acetonitrile in 0.1% TFA/H2O. Identity of pure oligomer was confirmed using an Agilent 6230 electrospray ionization time-of-flight (ESI-TOF) mass spectrometer (Data shown in Fig. S10, ESI†).DNA substrate preparation
DNA oligonucleotides were synthesized and purified by HPLC by the University of Utah Health Sciences Center DNA/Peptide Core Facility. DNA and PNA were resuspended in ultrapure water and, for unlabeled oligonucleotides, their concentration was determined using absorbance at 260 nm. In the case of carboxytetramethylrhodamine labeled DNA and PNA, concentration was quantified using light absorption at 555 nm with a molar absorptivity of 9.0 × 10⁴ reported by the reagent vendor. Stock solutions were stored at −20 °C, and were thawed shortly before experiments and stored at 4 °C.Glass substrates used to anchor probe DNA and resist nonspecific adsorption were prepared using previously described protocols.55 Briefly, float glass coverslips were cleaned by first rinsing twice in ultrapure water and methanol. Coverslips were then cleaned for 20 minutes using RCA solution56 (a 1![[thin space (1/6-em)]](https://www.rsc.org/images/entities/char_2009.gif) :1:5 mixture of 30% hydrogen peroxide, 30% ammonium hydroxide solution, and water) at 75 °C. Coverslips were then rinsed 3 times with ultrapure water, and dried for 30 minutes at 120 °C. Coverslips were then sealed in a jar containing 250 μL of 3-glycidyloxypropyl-trimethoxysilane in a small vial and held at 80 °C for 90–120 minutes to deposit a silane layer on the glass. Coverslips were removed from the jar and heated at 120 °C in air for 90 minutes to drive off the unreacted silane and allow for cross-linking of the deposited silane layer.
:1:5 mixture of 30% hydrogen peroxide, 30% ammonium hydroxide solution, and water) at 75 °C. Coverslips were then rinsed 3 times with ultrapure water, and dried for 30 minutes at 120 °C. Coverslips were then sealed in a jar containing 250 μL of 3-glycidyloxypropyl-trimethoxysilane in a small vial and held at 80 °C for 90–120 minutes to deposit a silane layer on the glass. Coverslips were removed from the jar and heated at 120 °C in air for 90 minutes to drive off the unreacted silane and allow for cross-linking of the deposited silane layer.
The coverslips were then cooled and a 15 μL droplet of 100 μM amine-modified capture ssDNA in 100 mM pH 10.0 carbonate buffer was placed on a coverslip. Another coverslip was placed on top of this one to form a thin solution layer between them. This coverslip stack was placed in a small beaker and nested inside a larger jar containing the same carbonate buffer to prevent the thin solution layer between the coverslips from evaporating. This assembly was sealed and incubated at 40 °C for 4–8 h to allow the amine-modified DNA to react with the epoxide surface. Coverslips were then separated under water, rinsed with ultrapure water, and placed in a solution of 20 mM 3-amino1-propanesulfonic acid in 100 mM carbonate buffer for 8 hours at 40 °C to passivate unreacted epoxide groups on the surface. Substrates were then rinsed in water and stored for up to 21 days at 4 °C before use in imaging experiments.
Fluorescence imaging
Solutions used for imaging experiments were prepared with 10 mM Tris buffer at pH 8.0 with 1 mM EDTA and varying amounts of sodium chloride, as noted in the text. Buffers were filtered with a 0.2 μm filter and stored at 4 °C. Stock solutions of DNA and PNA were diluted into the appropriate buffers and vortexed shortly before injecting into the imaging flow cell for kinetics measurements. The final concentration of PNA and DNA targets in most data sets are 30 nM unless otherwise noted.Coverslips with capture DNA were loaded into an imaging microfluidics cell. This microfluidics cell uses a double-stick gasket (3 M 9495MP) to form a channel and seal coverslip to a PMMA top plate with ports for sample injection. The flow cell was imaged using an Olympus IX-71 microscope configured for objective-based total internal reflection fluorescence microscope (TIRF). Illumination was provided by a 532 nm laser (BWTek) coupled into a single-mode optical fiber (Thorlabs). Light from the fiber was collimated by an achromatic doublet lens (Thorlabs), passed through an aperture, quarter wave plate (Thorlabs), and a shutter (Uniblitz), reflected from a dichroic mirror (Semrock), and finally focused onto the back-focal plane of the microscope objective (60×, 1.45NA, Olympus) with an achromatic doublet (Thorlabs) to illuminate the sample. Fluorescence emission from individual molecules is collected by the objective and sent through the dichroic mirror, emission filter (Semrock), and a 1.6× magnifier (for a total magnification of 96×) and imaged with an Andor iXon DU897 electron-multiplying charge-coupled device camera. The microscope system and sample were enclosed in a fiberboard incubator and the temperature was controlled to within ±0.2 °C using a proportional-integral-derivative controlled heater-fan assembly (Omega HVL14900) calibrated with a NIST-traceable thermometer (VWR).
Image acquisition and analysis
Fluorescence images were collected with exposure times designed to minimize photobleaching, while still sampling the hybridization kinetics. Hybridization was monitored using time-lapse videos with 100 ms exposures and interval times between 0.3 s and 5 s intervals. The excitation laser exposure experienced by fluorophores on target DNA bound at the interface before dissociation has been shown to result in minimal photobleaching.40,57 Images were collected in 300 × 300 pixel sub-regions of the sensor, corresponding to 50 × 50 μm in the sample. The sensor readout was at 1 MHz to minimize read noise, and the electron-multiplying amplifier was deactivated to avoid additional EM photon-counting noise.57 Images were acquired as 15–60 min 16-bit monochrome FITS-image stacks using Andor SOLIS software version 4.27.30001.0.Images were analyzed using a super-resolution imaging scheme previously described.40 First, we located all fluorescent spots in each image, and tracked them to determine locations of probe DNA molecules on the surface that experience repeat hybridization visits by fluorescently tagged target DNA molecules. The duration of each hybridization event, and the interval time between events were then used to determine the association and dissociation rate of each probe molecule on the surface. Probe molecules with anomalous kinetics and spurious nonspecific adsorption sites were discarded. The average number of probe molecules assayed in each data set are 2500 ± 700 for the DNA Target, 1100 ± 200 for the DNA-2A Target, and 960± 70 for the PNA Target. Hybridization events from the remaining filtered probe molecules were pooled and fit to a first-order kinetics model to determine the association rate constant, kon, the dissociation rate constant, koff, and the association constant, Ka as described in more detail in Fig. S1–S7 (ESI†).
Conflicts of interest
The authors declare no competing interests.Acknowledgements
This work was supported by the National Science Foundation (DMR 1822262 and 2003987 to J. Heemstra, and CHE 1904424 to J. Harris).References
- L. Li, S. Xu, H. Yan, X. Li, H. S. Yazd, X. Li, T. Huang, C. Cui, J. Jiang and W. Tan, Angew. Chem., Int. Ed., 2021, 60, 2221 Search PubMed.
- N. C. Seeman and H. F. Sleiman, Nat. Rev. Mater., 2018, 3, 17068 Search PubMed.
- M. R. Lakin and A. Phillips, ACS Synth. Biol., 2020, 9, 1499–1513 Search PubMed.
- P. O’donoghue and I. U. Heinemann, Genes, 2019, 10, 523 Search PubMed.
- I. Anosova, E. A. Kowal, M. R. Dunn, J. C. Chaput, W. D. V. Horn and M. Egli, Nucleic Acids Res., 2016, 44, 1007–1021 Search PubMed.
- K. Morihiro, Y. Kasahara and S. Obika, Mol. BioSyst., 2017, 13, 235–245 Search PubMed.
- Q. Ma, D. Lee, Y. Q. Tan, G. Wong and Z. Gao, Polym. Chem., 2016, 7, 5199–5216 Search PubMed.
- P. E. Nielsen and M. Egholm, Curr. Issues Mol. Biol., 1999, 1, 89–104 Search PubMed.
- P. E. Nielsen, M. Egholm, R. H. Berg and O. Buchardt, Science, 1991, 254, 1497–1500 Search PubMed.
- P. E. Nielsen, M. Egholm and O. Buchardt, Bioconjugate Chem., 1994, 5, 3–7 Search PubMed.
- V. V. Demidov, V. N. Potaman, M. D. Frank-Kamenetskii, M. Egholm, O. Buchardt, S. H. Sonnichsen and P. E. Nlelsen, Biochem. Pharmacol., 1994, 48, 1310–1313 Search PubMed.
- M. Egholm, O. Buchardt, L. Christensen, C. Behrens, S. M. Freier, D. A. Driver, R. H. Berg, S. K. Kim, B. Norden and P. E. Nielsen, Nature, 1993, 365, 566–568 Search PubMed.
- S. Tomac, M. Sarkar, T. Ratilainen, P. Wittung, P. E. Nielsen, B. Norden and A. Graslund, J. Am. Chem. Soc., 1996, 118, 5544–5552 Search PubMed.
- F. Pellestor and P. Paulasova, Eur. J. Hum. Genet., 2004, 12, 694–700 Search PubMed.
- R. Bahal, N. Ali McNeer, E. Quijano, Y. Liu, P. Sulkowski, A. Turchick, Y. C. Lu, D. C. Bhunia, A. Manna, D. L. Greiner, M. A. Brehm, C. J. Cheng, F. López-Giráldez, A. Ricciardi, J. Beloor, D. S. Krause, P. Kumar, P. G. Gallagher, D. T. Braddock, W. Mark Saltzman, D. H. Ly and P. M. Glazer, Nat. Commun., 2016, 7, 13304 Search PubMed.
- R. D’Agata, M. C. Giuffrida and G. Spoto, Molecules, 2017, 22, 1951 Search PubMed.
- R. Gambari, Expert Opin. Ther. Pat., 2014, 24, 267–294 Search PubMed.
- O. Tepper, H. Zheng, D. H. Appella and E. Yavin, Chem. Commun., 2021, 57, 540–543 Search PubMed.
- C. Zhao, T. Hoppe, M. K. Setty, D. Murray, T. W. Chun, I. Hewlett and D. H. Appella, Nat. Commun., 2014, 5, 5079 Search PubMed.
- A. Gupta, A. Mishra and N. Puri, J. Biotechnol., 2017, 259, 148–159 Search PubMed.
- J.-C. Wu, Q.-C. Meng, H.-M. Ren, H.-T. Wang, J. Wu and Q. Wang, Acta Pharmacol. Sin., 2017, 38, 798–805 Search PubMed.
- C. S. Swenson, A. Velusamy, H. S. Argueta-Gonzalez and J. M. Heemstra, J. Am. Chem. Soc., 2019, 141, 19038–19047 Search PubMed.
- H. Narenji, P. Gholizadeh, M. Aghazadeh, M. A. Rezaee, M. Asgharzadeh and H. S. Kafil, Biomed. Pharmacother., 2017, 93, 580–588 Search PubMed.
- C. S. Swenson and J. M. Heemstra, Chem. Commun., 2020, 56, 1926–1935 Search PubMed.
- J. Saarbach, P. M. Sabale and N. Winssinger, Curr. Opin. Chem. Biol., 2019, 52, 112–124 Search PubMed.
- N. T. S. De Costa and J. M. Heemstra, PLoS One, 2013, 8, e58670 Search PubMed.
- H. Park, A. Germini, S. Sforza, R. Corradini, R. Marchelli and W. Knoll, Biointerphases, 2007, 2, 80–88 Search PubMed.
- Z. J. Tan and S. J. Chen, Biophys. J., 2006, 90, 1175–1190 Search PubMed.
- R. Jungmann, C. Steinhauer, M. Scheible, A. Kuzyk, P. Tinnefeld and F. C. Simmel, Nano Lett., 2010, 10, 4756–4761 Search PubMed.
- R. Jungmann, M. S. Avendano, J. B. Woehrstein, M. Dai, W. M. Shih and P. Yin, Nat. Methods, 2014, 11, 313–318 Search PubMed.
- J. Schnitzbauer, M. T. Strauss, T. Schlichthaerle, F. Schueder and R. Jungmann, Nat. Protoc., 2017, 12, 1198–1228 Search PubMed.
- J. Chen, A. Bremauntz, L. Kisley, B. Shuang and C. F. Landes, ACS Appl. Mater. Interfaces, 2013, 5, 9338–9343 Search PubMed.
- L. E. Baltierra-Jasso, M. J. Morten, L. Laflor, S. D. Quinn and S. W. Magennis, J. Am. Chem. Soc., 2015, 137, 16020–16023 Search PubMed.
- R. Jungmann, M. S. Avendano, M. Dai, J. B. Woehrstein, S. S. Agasti, Z. Feiger, A. Rodal and P. Yin, Nat. Methods, 2016, 13, 439–442 Search PubMed.
- J. Stein, F. Stehr, P. Schueler, P. Blumhardt, F. Schueder, J. Mücksch, R. Jungmann and P. Schwille, Nano Lett., 2019, 19, 8182–8190 Search PubMed.
- S. Strauss and R. Jungmann, Nat. Methods, 2020, 17, 789–791 Search PubMed.
- A. H. Clowsley, W. T. Kaufhold, T. Lutz, A. Meletiou, L. Di Michele and C. Soeller, Nat. Commun., 2021, 12, 501 Search PubMed.
- O. K. Wade, J. B. Woehrstein, P. C. Nickels, S. Strauss, F. Stehr, J. Stein, F. Schueder, M. T. Strauss, M. Ganji, J. Schnitzbauer, H. Grabmayr, P. Yin, P. Schwille and R. Jungmann, Nano Lett., 2019, 19, 2641–2646 Search PubMed.
- Nicholas F. Dupuis, Erik D. Holmstrom and David J. Nesbitt, Biophys. J., 2013, 105, 756–766 Search PubMed.
- E. M. Peterson and J. M. Harris, Anal. Chem., 2018, 90, 5007–5014 Search PubMed.
- T. Uno, H. Tabata and T. Kawal, Anal. Chem., 2007, 79, 52–59 Search PubMed.
- J. Liu, S. Tian, P. E. Neilsen and W. Knoll, Chem. Commun., 2005, 2969–2971, 10.1039/b419425j.
- K. Kilså Jensen, H. Ørum, P. E. Nielsen and B. Nordén, Biochemistry, 1997, 36, 5072–5077 Search PubMed.
- H. Park, A. Germini, S. Sforza, R. Corradini, R. Marchelli and W. Knoll, Biointerphases, 2006, 1, 113–122 Search PubMed.
- Y. Liu, D. Irving, W. Qiao, D. Ge and R. Levicky, J. Am. Chem. Soc., 2011, 133, 11588–11596 Search PubMed.
- Y. Sato, K. Fujimoto and H. Kawaguchi, Colloids Surf., B, 2003, 27, 23–31 Search PubMed.
- U. Giesen, W. Kleider, C. Berding, A. Geiger, H. Ørum and P. E. Nielsen, Nucleic Acids Res., 1998, 26, 5004–5006 Search PubMed.
- D. C. Montgomery, Applied statistics and probability for engineers, Wiley, New York, 2003 Search PubMed.
- H. Eyring, Chem. Rev., 1935, 17, 65–77 Search PubMed.
- T. Arakawa and S. N. Timasheff, Biochemistry, 1984, 23, 5912–5923 Search PubMed.
- Y. Zhang and P. S. Cremer, Curr. Opin. Chem. Biol., 2006, 10, 658–663 Search PubMed.
- D. Leipply, D. Lambert and D. E. Draper, Methods Enzymol., 2009, 469, 433–463 Search PubMed.
- R. Leberman, FEBS Lett., 1991, 284, 293–294 Search PubMed.
- K. C. Duong-Ly and S. B. Gabelli, Methods Enzymol., 2014, 541, 85–94 Search PubMed.
- E. M. Peterson, M. W. Manhart and J. M. Harris, Anal. Chem., 2016, 88, 1345–1354 Search PubMed.
- W. Kern and D. A. Poutinen, RCA Rev., 1970, 31, 187 Search PubMed.
- E. M. Peterson, E. J. Reece, W. Li and J. M. Harris, J. Phys. Chem. B, 2019, 123, 10746–10756 Search PubMed.
Footnotes |
| † Electronic supplementary information (ESI) available: Description of single-molecule data analysis methods, description of thermodynamic analysis, additional figures, tabular values of kinetic measurements, and characterization of PNA oligomers. See DOI: 10.1039/d1cb00025j |
| ‡ Primary authors made equal contributions. |
| This journal is © The Royal Society of Chemistry 2021 |