
 Open Access Article
 This Open Access Article is licensed under a
 Creative Commons Attribution 3.0 Unported Licence
Click-based amplification: designed to facilitate various target labelling modes with ultralow background amplification†
Jinyi
Bai
ab,
Fusheng
Guo
ab,
Mengyao
Li
cde,
Yulong
Li
*bcde and
Xiaoguang
Lei
 *ab
*ab
aBeijing National Laboratory for Molecular Sciences, State Key Laboratory of Natural and Biomimetic Drugs, Key Laboratory of Bioorganic Chemistry and Molecular Engineering of Ministry of Education, Department of Chemical Biology, College of Chemistry and Molecular Engineering, Synthetic and Functional Biomolecules Center, Peking University, Beijing 100871, People's Republic of China. E-mail: xglei@pku.edu.cn
bPeking-Tsinghua Center for Life Sciences, Academy for Advanced Interdisciplinary Studies, Peking University, Beijing 100871, People's Republic of China. E-mail: yulongli@pku.edu.cn
cState Key Laboratory of Membrane Biology, Peking University School of Life Sciences, Beijing, China
dPKU-IDG/McGovern Institute for Brain Research, Beijing, China
eChinese Institute for Brain Research, Beijing, China
First published on 20th March 2021
Abstract
We here describe a fluorescent signal amplification method termed “Click-based amplification” that can be well integrated with various click-labelling modes, including chemical labelling, genetic incorporation and covalent inhibitor probe mediated target labelling. Picolyl azide (pAz) was used as a functional group of a streptavidin-based amplifier to enhance the efficiency of click chemistry. Click-based amplification provided 3.0–12.7 fold amplification on fixed HeLa cells with different click-labelling modes. Click-based amplification has proven to be superior to tyramide signal amplification (TSA) in view of its low nonspecific amplification and high signal-to-noise ratio. Moreover, in terms of the challenging signal amplification of tissue specimens, Click-based amplification successfully achieved remarkable fluorescence enhancement on intestinal tissue slices of afatinib-N3 treated mice, which provided direct evidence of the presence of afatinib-N3 in the intestinal tissues and helped in revealing the off-target toxicity of afatinib. Collectively, these results illustrate that Click-based amplification could serve as a promising method for bioimaging studies.
Introduction
Signal amplification is widely demanded in various applications including western blotting, ELISA, microscopy and clinical diagnosis. Different signal amplification strategies have been developed to meet various requirements in practical applications. Tyramide signal amplification (TSA) uses horseradish peroxidase (HRP) conjugated streptavidin and antibodies as reporters to amplify signals by catalysing labelled tyramide substrate deposition.1 Hybridization chain reaction (HCR) utilizes one initiator DNA strand to trigger a cascade of hybridization events of two stable species of DNA hairpins, providing a linear amplification.2 Furthermore, to combine hybridization-based signal amplification methods with antibody-based immunostaining, immunosignal hybridization chain reaction (isHCR)3 and immunostaining with signal amplification by exchange reaction (Immuno-SABER)4 were developed and successfully used to amplify protein targets in tissues.On the other hand, the abundance levels of biomolecules vary greatly. For example, the abundance of proteins in mammalian cells varies by at least seven orders of magnitude (about 101 to 108 copies per cell).5 To amplify targets with a wider range of abundance, some controllable amplification methods are developed using stepwise amplification strategies. Click-amplifying FISH (clampFISH) is a signal amplification method using iterative rounds of hybridization and click-locking to amplify RNA and DNA targets with high specificity and high amplification efficiency.6 Fluorescent signal amplification via cyclic staining of target molecules (FRACTAL) can amplify the signal intensity of immunofluorescence staining more than nine-fold via simple cyclic staining of secondary antibodies.7 Multi-cycle amplification provides a successive growth of signal intensity, but the background amplification and the signal-to-noise ratio should be carefully examined during the amplification process. More importantly, most of the current amplification methods share the same idea that target recognition depends on primary antibodies and hybridization reactions, resulting in the target range that is limited to proteins and nucleic acids.
Non-proteinaceous biomolecules, including glycans and lipids, also play important roles in various biological processes, but most of them show weak immunogenicity.8 Chemical biologists have developed a click-labelling platform to visualize various biomolecules:9–11 install unique functional groups into target molecules, then ligate visual tags and other reporters via bioorthogonal reactions. However, signal amplification methods tailored for click-labelling strategies are seriously inadequate. Carell and co-workers reported a remarkable dendrimer-based signal amplification using click chemistry, and achieved fluorescence amplification for EdU-labelled DNA in situ with low background amplification.12 However, other click-labelling and more complex biological systems were not tested.
Herein, we report a signal amplification method, Click-based amplification, that can amplify various click-labelling modes, including chemical labelling, genetic incorporation and covalent inhibitor probe mediated target labelling. Click-based amplification enhanced the fluorescence signal of fixed HeLa cells by 3.0–12.7 fold without introducing obvious nonspecific amplification. Finally, Click-based amplification was used to amplify the signal of mouse intestinal tissue specimens, providing direct evidence of drug distribution in animal tissues.
Results and discussion
Click-based amplification design
The schematic representation of Click-based amplification in this study is shown in Fig. 1. The amplification procedure includes two steps: (1) amplifier binding, azide functionalized streptavidin (amplifier) binds to the biotin tag on the target (Fig. 1D); and (2) click conversion, a second set of biotin tags are introduced onto the target via click reaction (Fig. 1E). The number of biotin tags on the target will increase after this two-step amplification process (Fig. 1B and E), since there are 16 azide groups on the amplifier in theory after saturated modification of streptavidin lysine residues with NHS-N3. Streptavidin is a tetramer protein, and every monomer contains 4 lysine residues: K80, K121, K132 and K134 (Fig. 2B, PDB: 3ry1).13 The saturated modification of the limited number of lysine residues can result in a relatively homogenous amplifier and thus a moderate amplification efficiency. Multi-cycle amplification is feasible in design, and the procedure is shown in Fig. S1A (ESI†). However, multi-cycle amplification may decrease the signal-to-noise ratio, since the amplified fluorescence of the vehicle control may increase faster than that with click-labelling. Therefore, one cycle of amplification is recommended to achieve a high signal-to-noise ratio and time and cost reduction.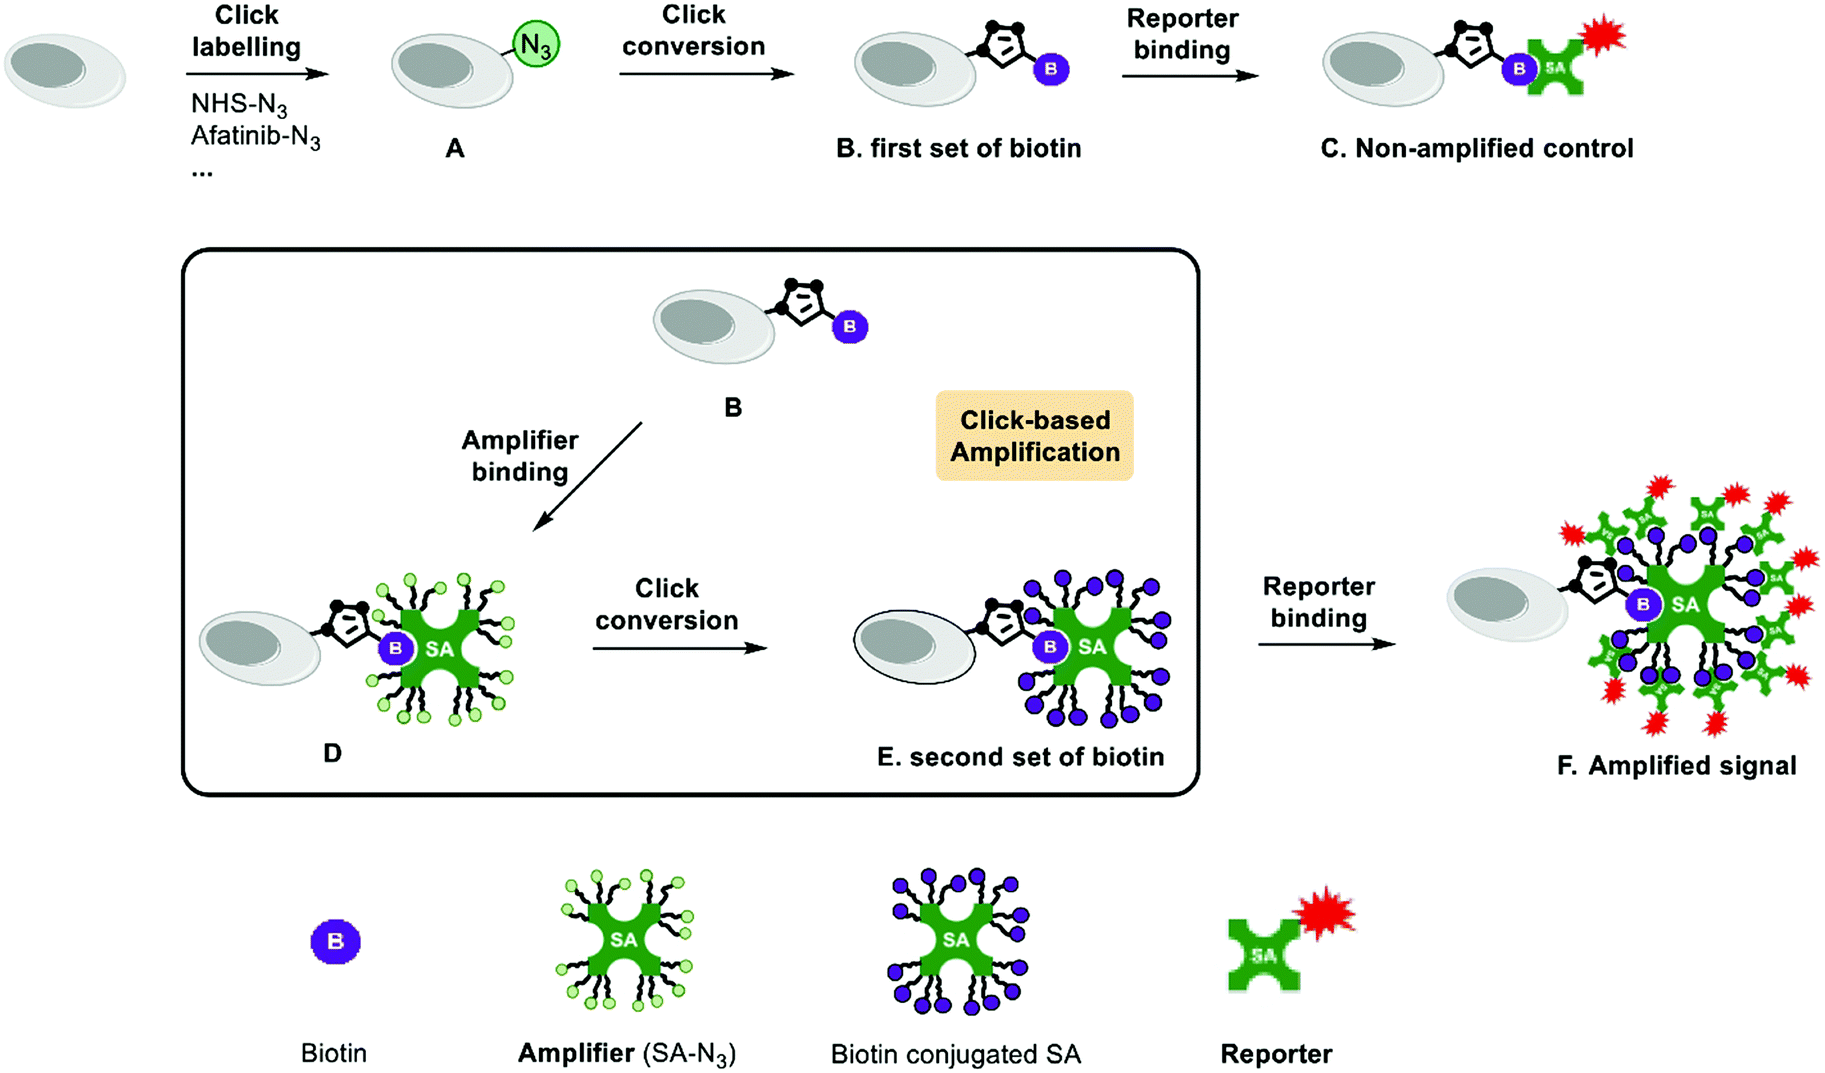 | ||
| Fig. 1 Schematic representation of a Click-based amplification procedure with streptavidin-N3. (A) The target of interest is labelled with the azide. (B) The first set of biotin tags are introduced via click reaction. (C) Non-amplified control: streptavidin-AF647 binds to the biotin on the target for imaging. (D) Amplifier binding step. Streptavidin-N3 binds to the biotin tags on the target and introduces multiple azide groups. (E) Click conversion step. A second set of biotin is introduced via click reaction. (F) Amplified signal: the additional biotin tags recruit more streptavidin-AF647 and result in enhanced fluorescence. | ||
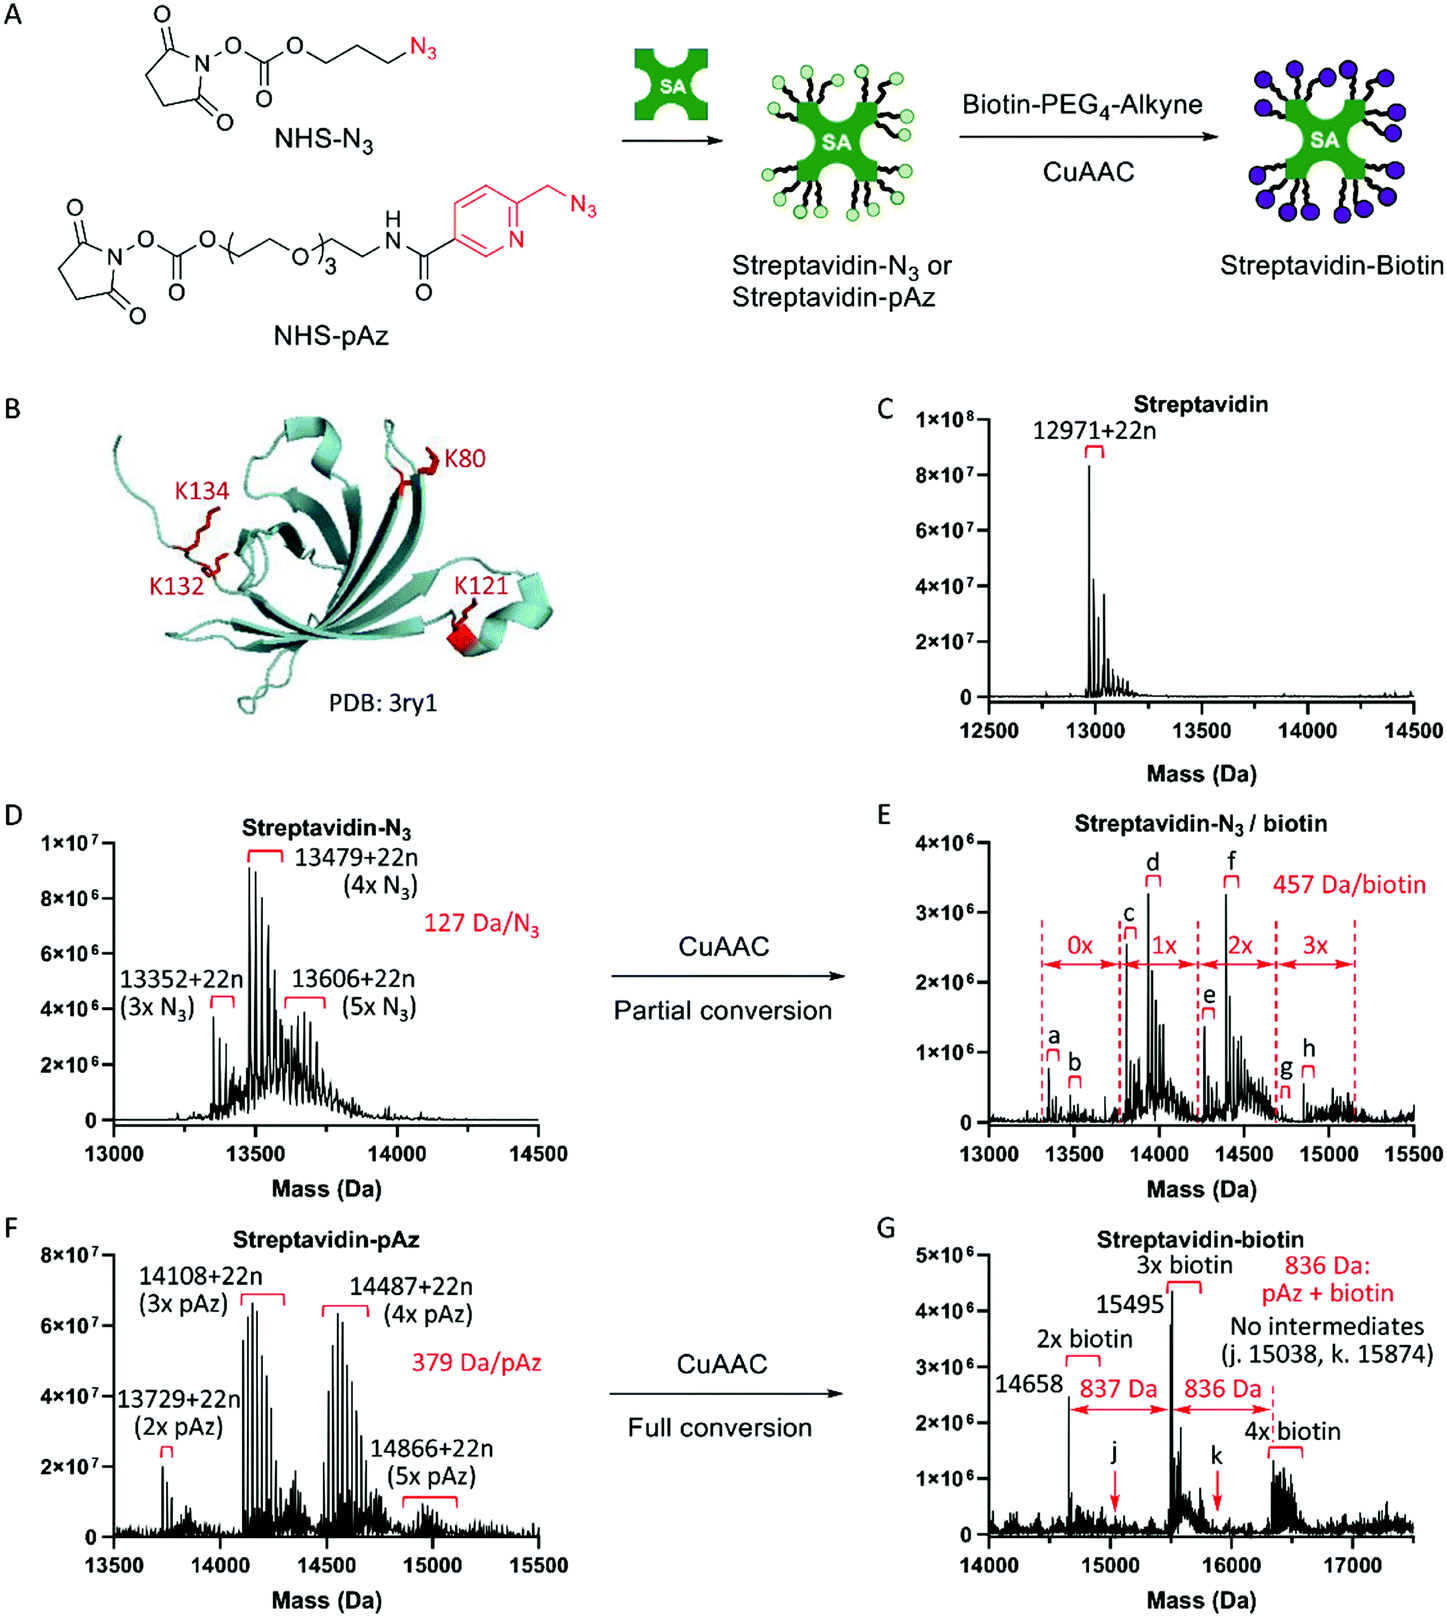 | ||
Fig. 2 Streptavidin-pAz showed much higher click conversion efficiency than streptavidin-N3 in solution. (A) Reactions of synthesis of two types of amplifiers and Click conversion. Streptavidin was modified with NHS-N3 or NHS-pAz, generating two types of amplifiers streptavidin-N3 and streptavidin-pAz. (B) Crystal structure of a streptavidin monomer, including 4 lysine residues. (C) The deconvoluted ESI-TOF mass spectrum of the streptavidin monomer (mSA). Molecular weight (MW): 12![[thin space (1/6-em)]](https://www.rsc.org/images/entities/char_2009.gif) 971 + 22n. Δm = 22 should be Na+. (D) Streptavidin modified with NHS-N3. The numbers of N3 groups on streptavidin were calculated to be 3–5. (E) Partial conversion of streptavidin-N3 in (D) via CuAAC with biotin-PEG4-alkyne. MWs of a–h: 13352 + 22n (3× N3, no biotin), 13479 + 22n (4× N3, no biotin), 13809 + 22n (2× N3, 1× biotin), 13936 + 22n (3× N3, 1× biotin), 14266 + 22n (1× N3, 2× biotin), 14393 + 22n (2× N3, 2× biotin), 14723 + 22n (no N3, 3× biotin), and 14850 + 22n (1× N3, 3× biotin). (F) Streptavidin modified with NHS-pAz. The numbers of pAz groups on streptavidin were calculated to be 2–5. (G) Full conversion of streptavidin-pAz in (F) via CuAAC with biotin-PEG4-alkyne. MWs: 14658 (no pAz, 2× biotin), 15495 and 15509 (no pAz, 3× biotin), and 16345 (no pAz, 4× biotin). No intermediates, MWs: 15038 (1× pAz, 2× biotin) and 15 874 (1× pAz, 3× biotin). 971 + 22n. Δm = 22 should be Na+. (D) Streptavidin modified with NHS-N3. The numbers of N3 groups on streptavidin were calculated to be 3–5. (E) Partial conversion of streptavidin-N3 in (D) via CuAAC with biotin-PEG4-alkyne. MWs of a–h: 13352 + 22n (3× N3, no biotin), 13479 + 22n (4× N3, no biotin), 13809 + 22n (2× N3, 1× biotin), 13936 + 22n (3× N3, 1× biotin), 14266 + 22n (1× N3, 2× biotin), 14393 + 22n (2× N3, 2× biotin), 14723 + 22n (no N3, 3× biotin), and 14850 + 22n (1× N3, 3× biotin). (F) Streptavidin modified with NHS-pAz. The numbers of pAz groups on streptavidin were calculated to be 2–5. (G) Full conversion of streptavidin-pAz in (F) via CuAAC with biotin-PEG4-alkyne. MWs: 14658 (no pAz, 2× biotin), 15495 and 15509 (no pAz, 3× biotin), and 16345 (no pAz, 4× biotin). No intermediates, MWs: 15038 (1× pAz, 2× biotin) and 15 874 (1× pAz, 3× biotin). | ||
Optimization of Click-based amplification
Click-based amplification for NHS-N3 labelling in HeLa cells
NHS-N3 globally labelled the biomolecules containing primary amino groups in HeLa cells, i.e. proteins and lipids. To determine the suitable range of labelling concentrations for Click-based amplification, HeLa cells were treated with a gradient of NHS-N3 from 0.1 μM to 10 μM. The cellular AF647 fluorescence intensity of confocal imaging (Fig. 3A) was measured with ImageJ. In the amplification group (Fig. 3B, Amp.), HeLa cells treated with 0.1 μM NHS-N3 showed significantly increased cellular fluorescent signals compared to the vehicle group, while in the group without amplification (Fig. 3B, No Amp.), HeLa cells treated with 10 μM NHS-N3 began to show a labelling-dependent fluorescence enhancement. Click-based amplification therefore improved the detection sensitivity by at least 100-fold. To quantify the amplification efficiency, the amplification ratio was defined as the ratio of the cellular fluorescence with Click-based amplification to that without amplification. Click-based amplification obtained fluorescence amplification by 6.1–12.7 fold in HeLa cells treated with 0.3–10 μM NHS-N3 (Fig. 3C). The signal-to-noise ratios of cellular fluorescence were also improved with Click-based amplification (Fig. 3D).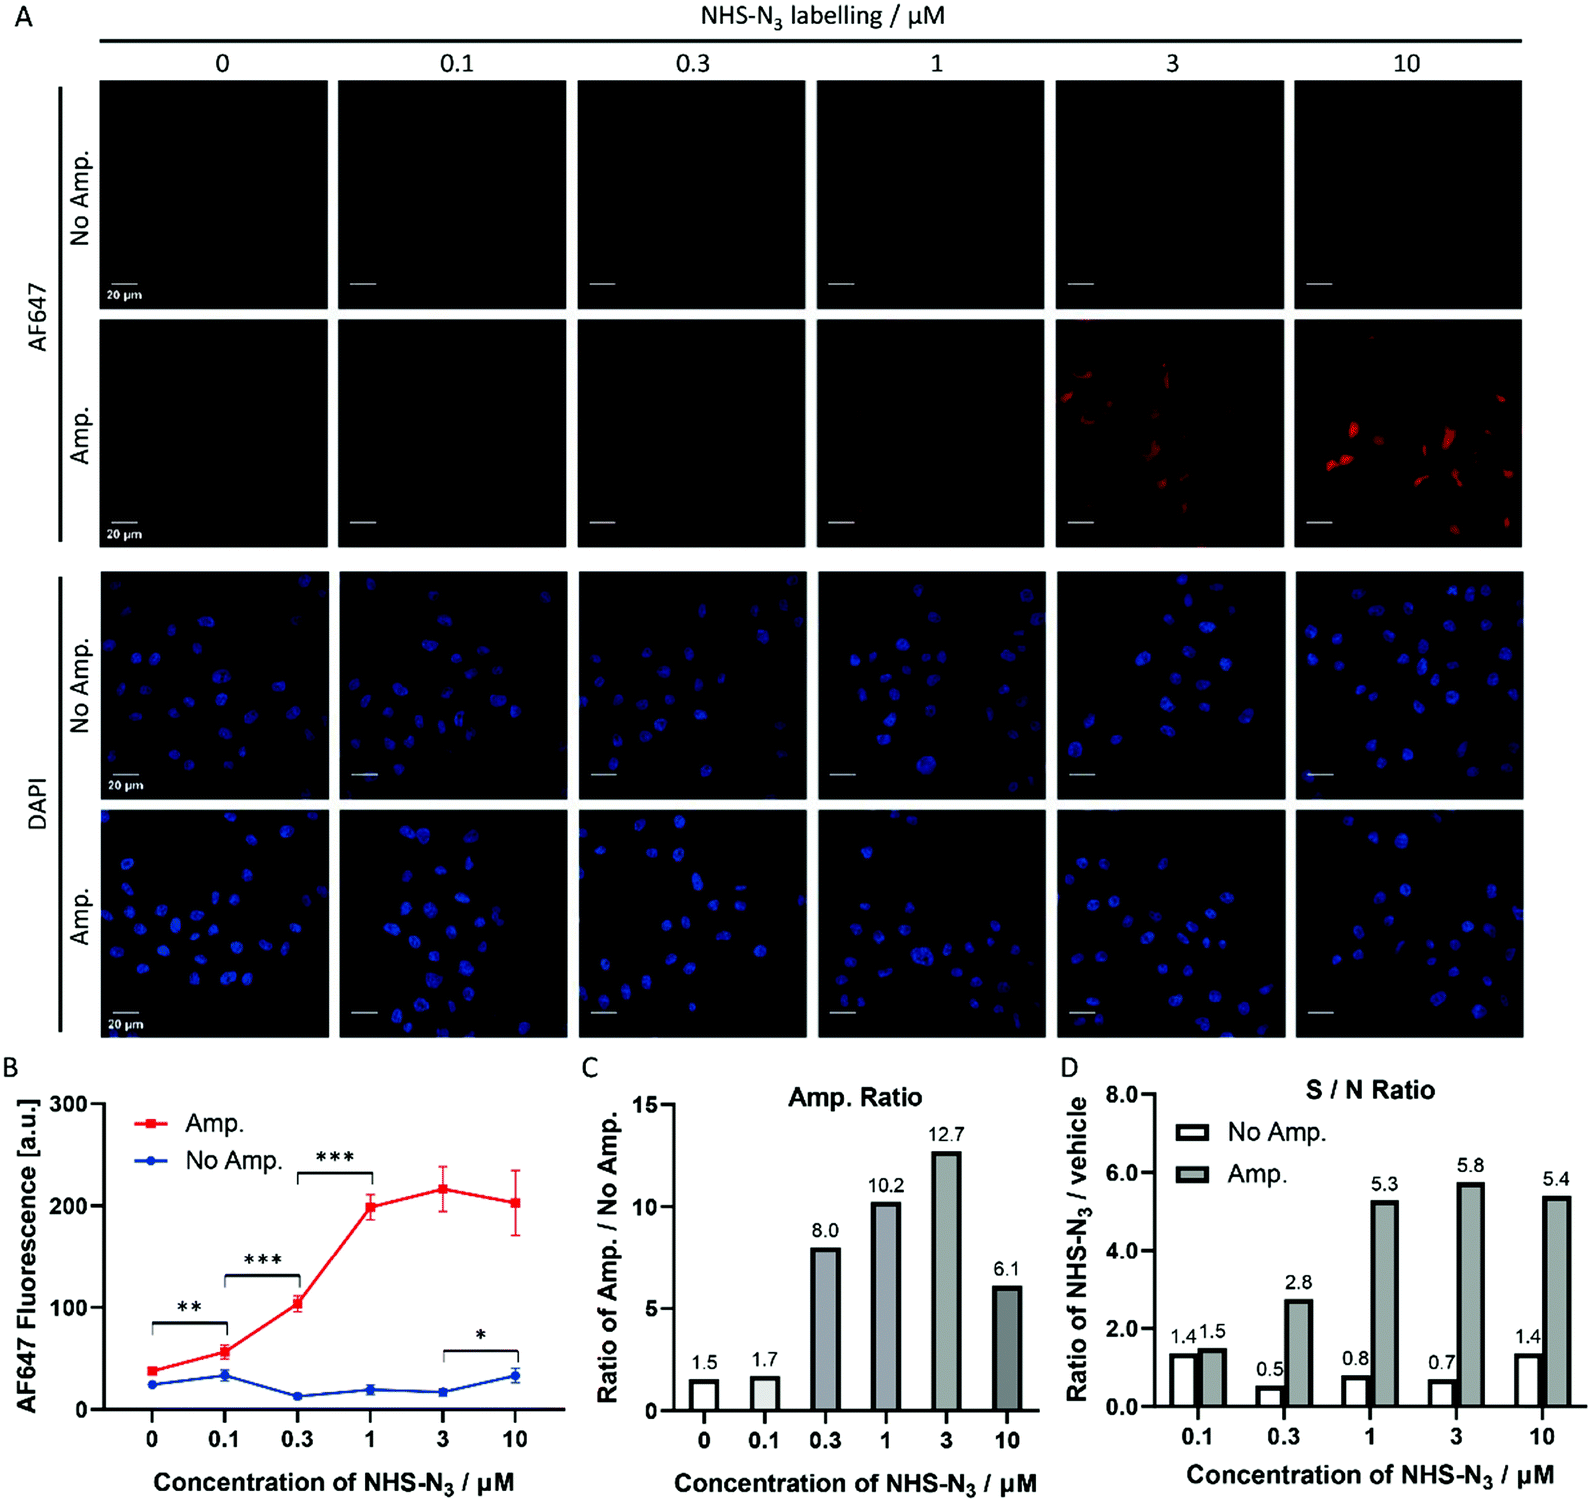 | ||
| Fig. 3 Click-based amplification on fixed HeLa cells with NHS-N3 labelling. (A) Confocal imaging of fixed HeLa cells without and with Click-based amplification (No Amp. and Amp.). HeLa cells were treated with a concentration gradient of NHS-N3 from 0.1 μM to 10 μM. DAPI stained the nuclei of the HeLa cells. Scale bars, 20 μm. (B) Quantification of the cellular AF647 fluorescence intensities in (A) with ImageJ. The red line represents the fluorescence intensity of HeLa cells with Click-based amplification (Amp.), and each data point is the average fluorescence intensity of 20 cells chosen randomly from the microscopy imaging. The blue line represents the fluorescence intensity of HeLa cells without Click-based amplification (No Amp.). Error bar: the standard error (SE). (C) Amplification ratios (Amp./No Amp.). (D) Signal-to-noise ratios (NHS-N3/vehicle). ***p < 0.001, **p < 0.01, *p < 0.05. | ||
Click-based amplification for EdU labelling in HeLa cells
5-Ethynyl-2′-deoxyuridine (EdU) has been used to be genetically incorporated into DNA during cell division. This approach labels the newly synthesized DNA with the alkyne group,10 which can be converted to biotin tags via click reaction with biotin-N3 (Fig. 4A). The nuclear positioning makes EdU labelling a suitable system to evaluate the fidelity of Click-based amplification. The confocal imaging results showed that Click-based amplification enhances the nuclear fluorescence signal but not that of cytoplasm (Fig. 4D). The amplification ratio of EdU labelling in HeLa cells was 3.0-fold (Fig. 4E and F). The relatively low amplification ratio may result from the highly crowded nuclear surroundings.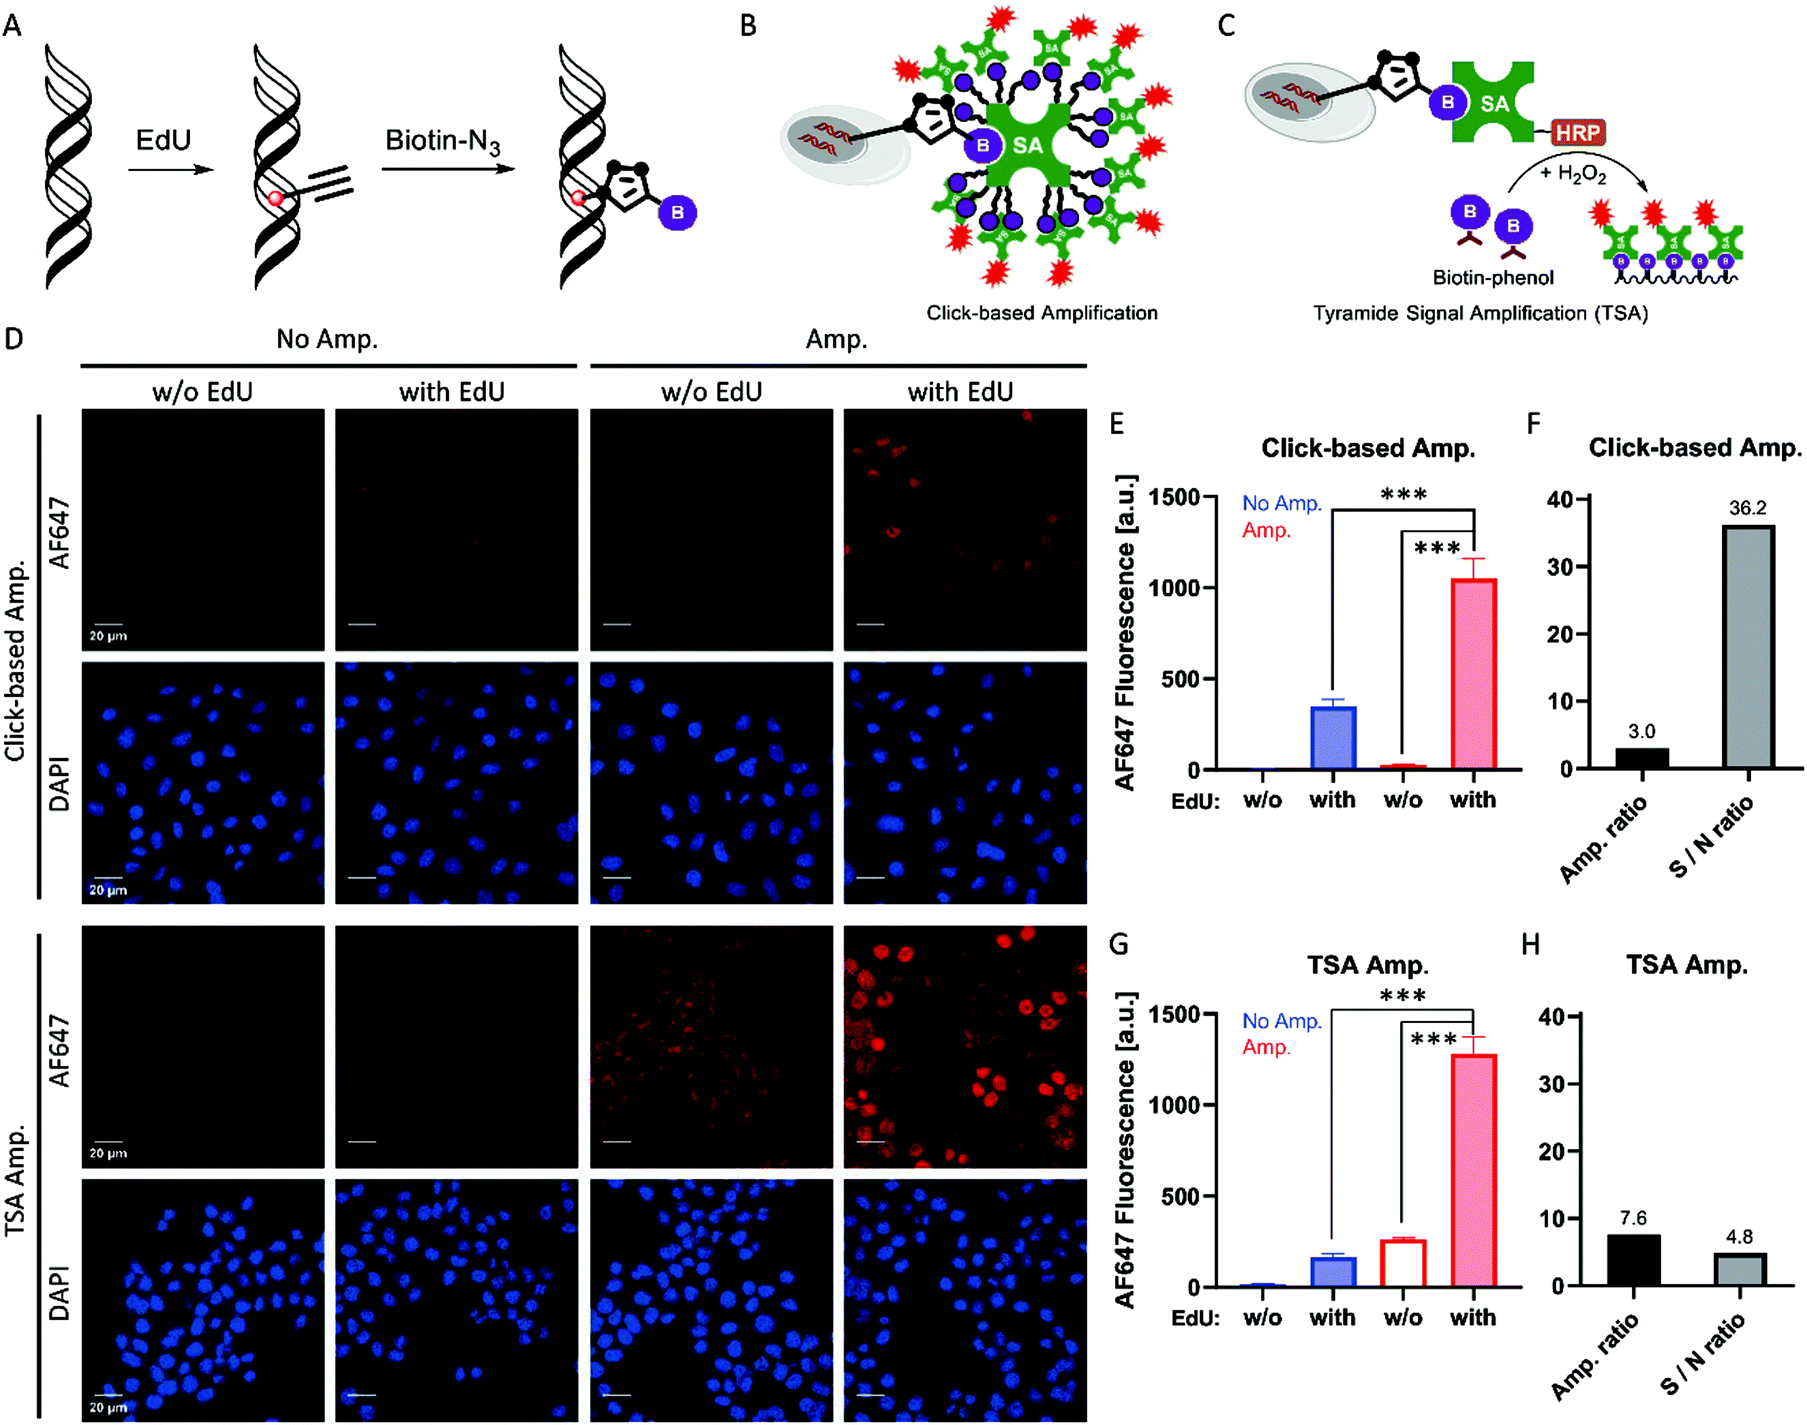 | ||
| Fig. 4 Click-based amplification achieved a much higher signal-to-noise ratio than TSA on fixed HeLa cells with EdU labelling. (A) Scheme of DNA labelled with EdU and the click conversion of EdU to biotin. (B) Scheme of Click-based amplification. (C) Scheme of TSA. (D) Confocal imaging of fixed HeLa cells with Click-based amplification and TSA. HeLa cells were treated with 10 μM EdU in DMEM at 37 °C overnight. DAPI stained the nuclei of the HeLa cells. Scale bars, 20 μm. (E) Quantification of the cellular AF647 fluorescence intensities in (D) with Click-based amplification. For the groups w/o EdU labelling, all the cell nuclei were dark, and 20 cells were chosen randomly to measure the average fluorescence intensity. For the groups with EdU labelling, all the lighted nuclei were measured to determine the average fluorescence intensity. (F) Amplification ratios (Amp./No Amp.) and signal-to-noise ratios (EdU/vehicle) with Click-based amplification. (G) Quantification of the cellular AF647 fluorescence intensities in (D) with TSA amplification. For the groups w/o EdU labelling, 20 cells were chosen randomly to measure the average fluorescence intensity. For the groups with EdU labelling, all the lighted nuclei were measured to determine the average fluorescence intensity. (H) Amplification ratios (Amp./No Amp.) and signal-to-noise ratios (EdU/vehicle) with TSA. ***p < 0.001. | ||
To evaluate the potential application of Click-based amplification, we compared our results with the widely used tyramide signal amplification (TSA). TSA can be readily integrated with various biotin labelling methods (Fig. 4C). We performed TSA for EdU labelling in HeLa cells. The results showed that TSA not only obtained a relatively higher amplification ratio, 7.6-fold (Fig. 4G and H), but also introduced obvious nonspecific amplification, since strong fluorescence was observed in the cytoplasm (Fig. 4D). The nonspecific amplification of TSA increased 29% when the concentration of SA-HRP increased from 1:1000 to 1:300 (Fig. S7, ESI†). Finally, the signal-to-noise ratio of Click-based amplification was 36.2, while that of TSA was only 4.8, mainly resulting from the high nonspecific binding of HRP.
HRP is a glycoprotein with nine potential N-glycosylation sites, and the carbohydrate content reaches about 20% (w/w).19 The high glycosylation of HRP may mediate relatively high nonspecific binding and high background amplification.20 In contrast, streptavidin has no glycosylation sites, which helps in explaining the ultralow background amplification of Click-based amplification.
Click-based amplification for covalent inhibitor probe mediated protein labelling in HeLa cells
Covalent inhibitors are compounds that are designed to form a covalent bond with their specific molecular target. Today, there are more than 50 approved drugs that act as covalent inhibitors targeting kinases, RAS proteins, cathepsin, caspases and other enzymes.21,22 Afatinib is a covalent inhibitor of EGFR with an IC50 value of 0.5 nM, and was approved by the FDA and EMA in 2013 for the treatment of patients with advanced non-small cell lung cancer (NSCLC).23 HeLa cells express high levels of EGFR, and afatinib inhibits the growth of HeLa cells with an IC50 value of 6.8 μM.24 We designed and synthesized an azide functionalized probe, afatinib-N3, by replacing one N-methyl with a propyl azide group in our previously published paper.25 HeLa cells were treated with a gradient of afatinib-N3 from 0.01 μM to 30 μM (Fig. 5B). In the amplification group (Fig. 5C, Amp.), HeLa cells treated with 1 μM afatinib-N3 began to show a significant fluorescence increase, while in the group without amplification (Fig. 5C, No Amp.), HeLa cells treated with 30 μM afatinib-N3 began to show a labelling-dependent fluorescence increase. Click-based amplification therefore improved the detection sensitivity by at least 30-fold. In view of the IC50 value of 6.8 μM inhibiting HeLa cell growth, Click-based amplification serves as a more suitable imaging tool to reveal the relationship between the cellular location and biological function of small molecule inhibitors. Besides, Click-based amplification obtained fluorescence amplification by 4.6–9.7 fold in fixed HeLa cells treated with 1–30 μM afatinib-N3 (Fig. 5D). The signal-to-noise ratios of cellular fluorescence were also improved by Click-based amplification (Fig. 5E).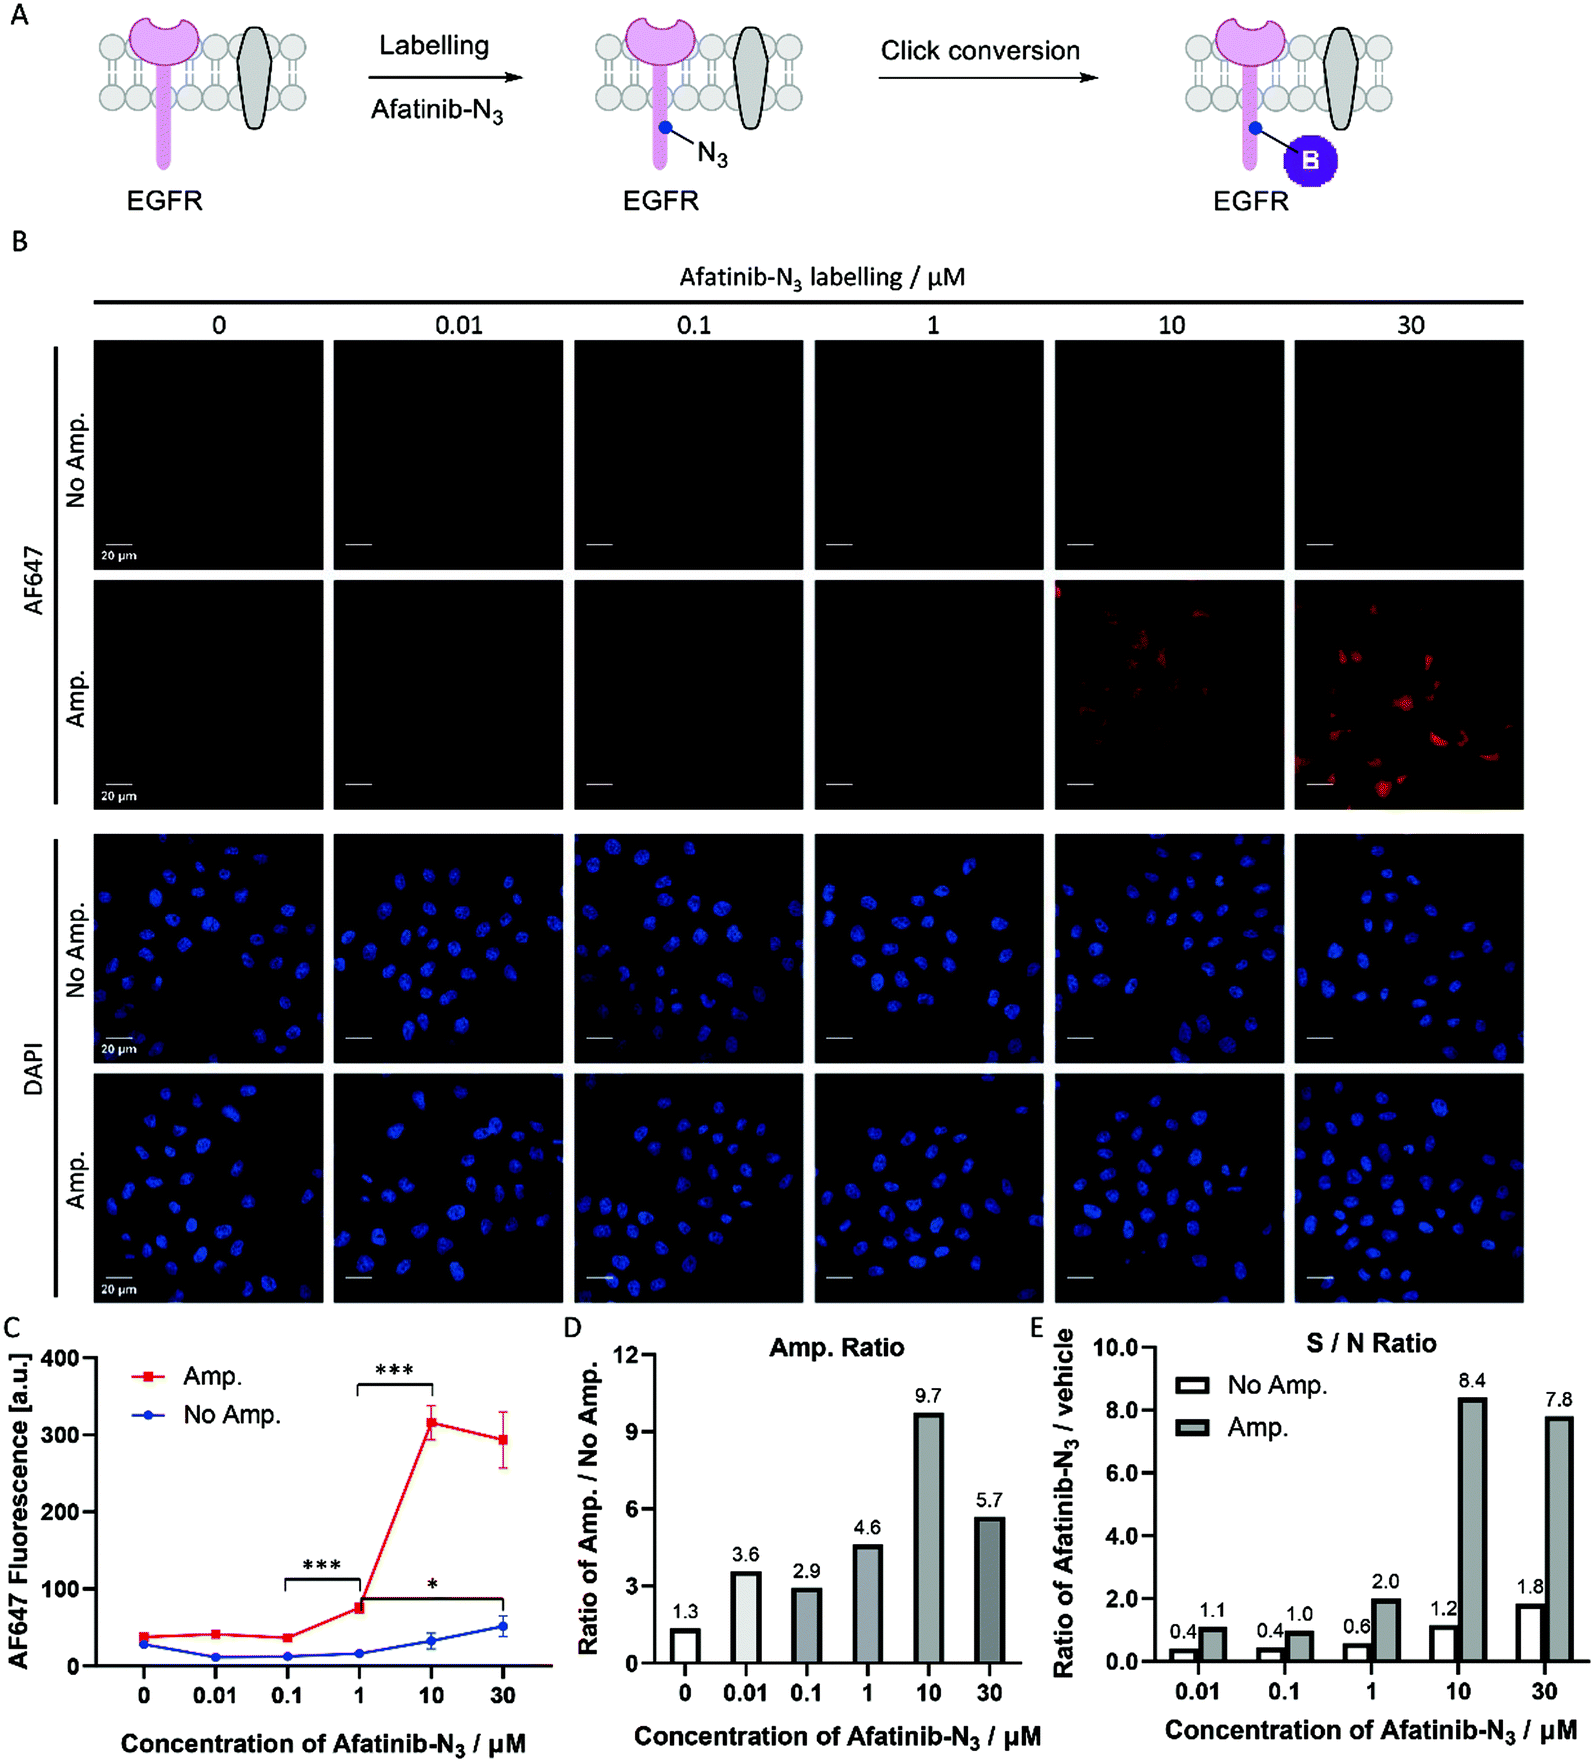 | ||
| Fig. 5 Click-based amplification on fixed HeLa cells with afatinib-N3 labelling. (A) Scheme of afatinib-N3 labelling on EGFR protein and the click conversion of N3 to biotin. (B) Confocal imaging of fixed HeLa cells without and with Click-based amplification (No Amp. and Amp.). HeLa cells were treated with a concentration gradient of afatinib-N3 from 0.01 μM to 30 μM in DMEM at 37 °C for 1 h. DAPI stained the nuclei of the HeLa cells. Scale bars, 20 μm. (C) Quantification of the cellular AF647 fluorescence intensities in (B) with ImageJ. The red line represents the fluorescence intensity of HeLa cells with Click-based amplification (Amp.), and each data point is the average fluorescence intensity of 20 cells chosen randomly from the microscopy imaging. The blue line represents the fluorescence intensity of HeLa cells without Click-based amplification (No Amp.). Error bar: the standard error (SE). (D) Amplification ratios (Amp./No Amp.). (E) Signal-to-noise ratios (afatinib-N3/vehicle). ***p < 0.001, *p < 0.05. | ||
Click-based amplification for drug distribution in mouse intestinal sections
Afatinib frequently brings side effects to patients such as diarrhea, acneiform eruption, mouth sores, paronychia and dry mouth during clinical use.26,27 The signalling pathway modulations of afatinib have been uncovered,28,29 but there are currently few methods that can detect the localization of afatinib in tissues and provide direct evidence of the participation of afatinib in the occurrence of side effects. Y. Yamamoto et al. developed an immunohistochemistry (IHC) protocol using a specific anti-afatinib antibody and HRP/DAB (3,3′-diamino-benzidine) staining system to detect afatinib–protein conjugates in fixed rat intestines and skin tissues.30 Here, we treated mice with the afatinib-N3 probe (Fig. 6A and B) and carried out Click-based amplification in fixed intestinal sections from the duodenum, jejunum, ileum and colon. The fluorescence signals of the sections from the duodenum, jejunum and ileum were enhanced with Click-based amplification by 2–3 fold (Fig. 6C and D). The signal-to-noise ratios were also increased significantly with Click-based amplification for the sections from the jejunum and ileum (Fig. 6E). The sections from the colon showed the weakest fluorescence signals among these intestinal specimens, which suggested that the distribution of afatinib-N3 in the colon was low. Taken together, Click-based amplification may serve as a useful tool for detecting drug distribution in tissues.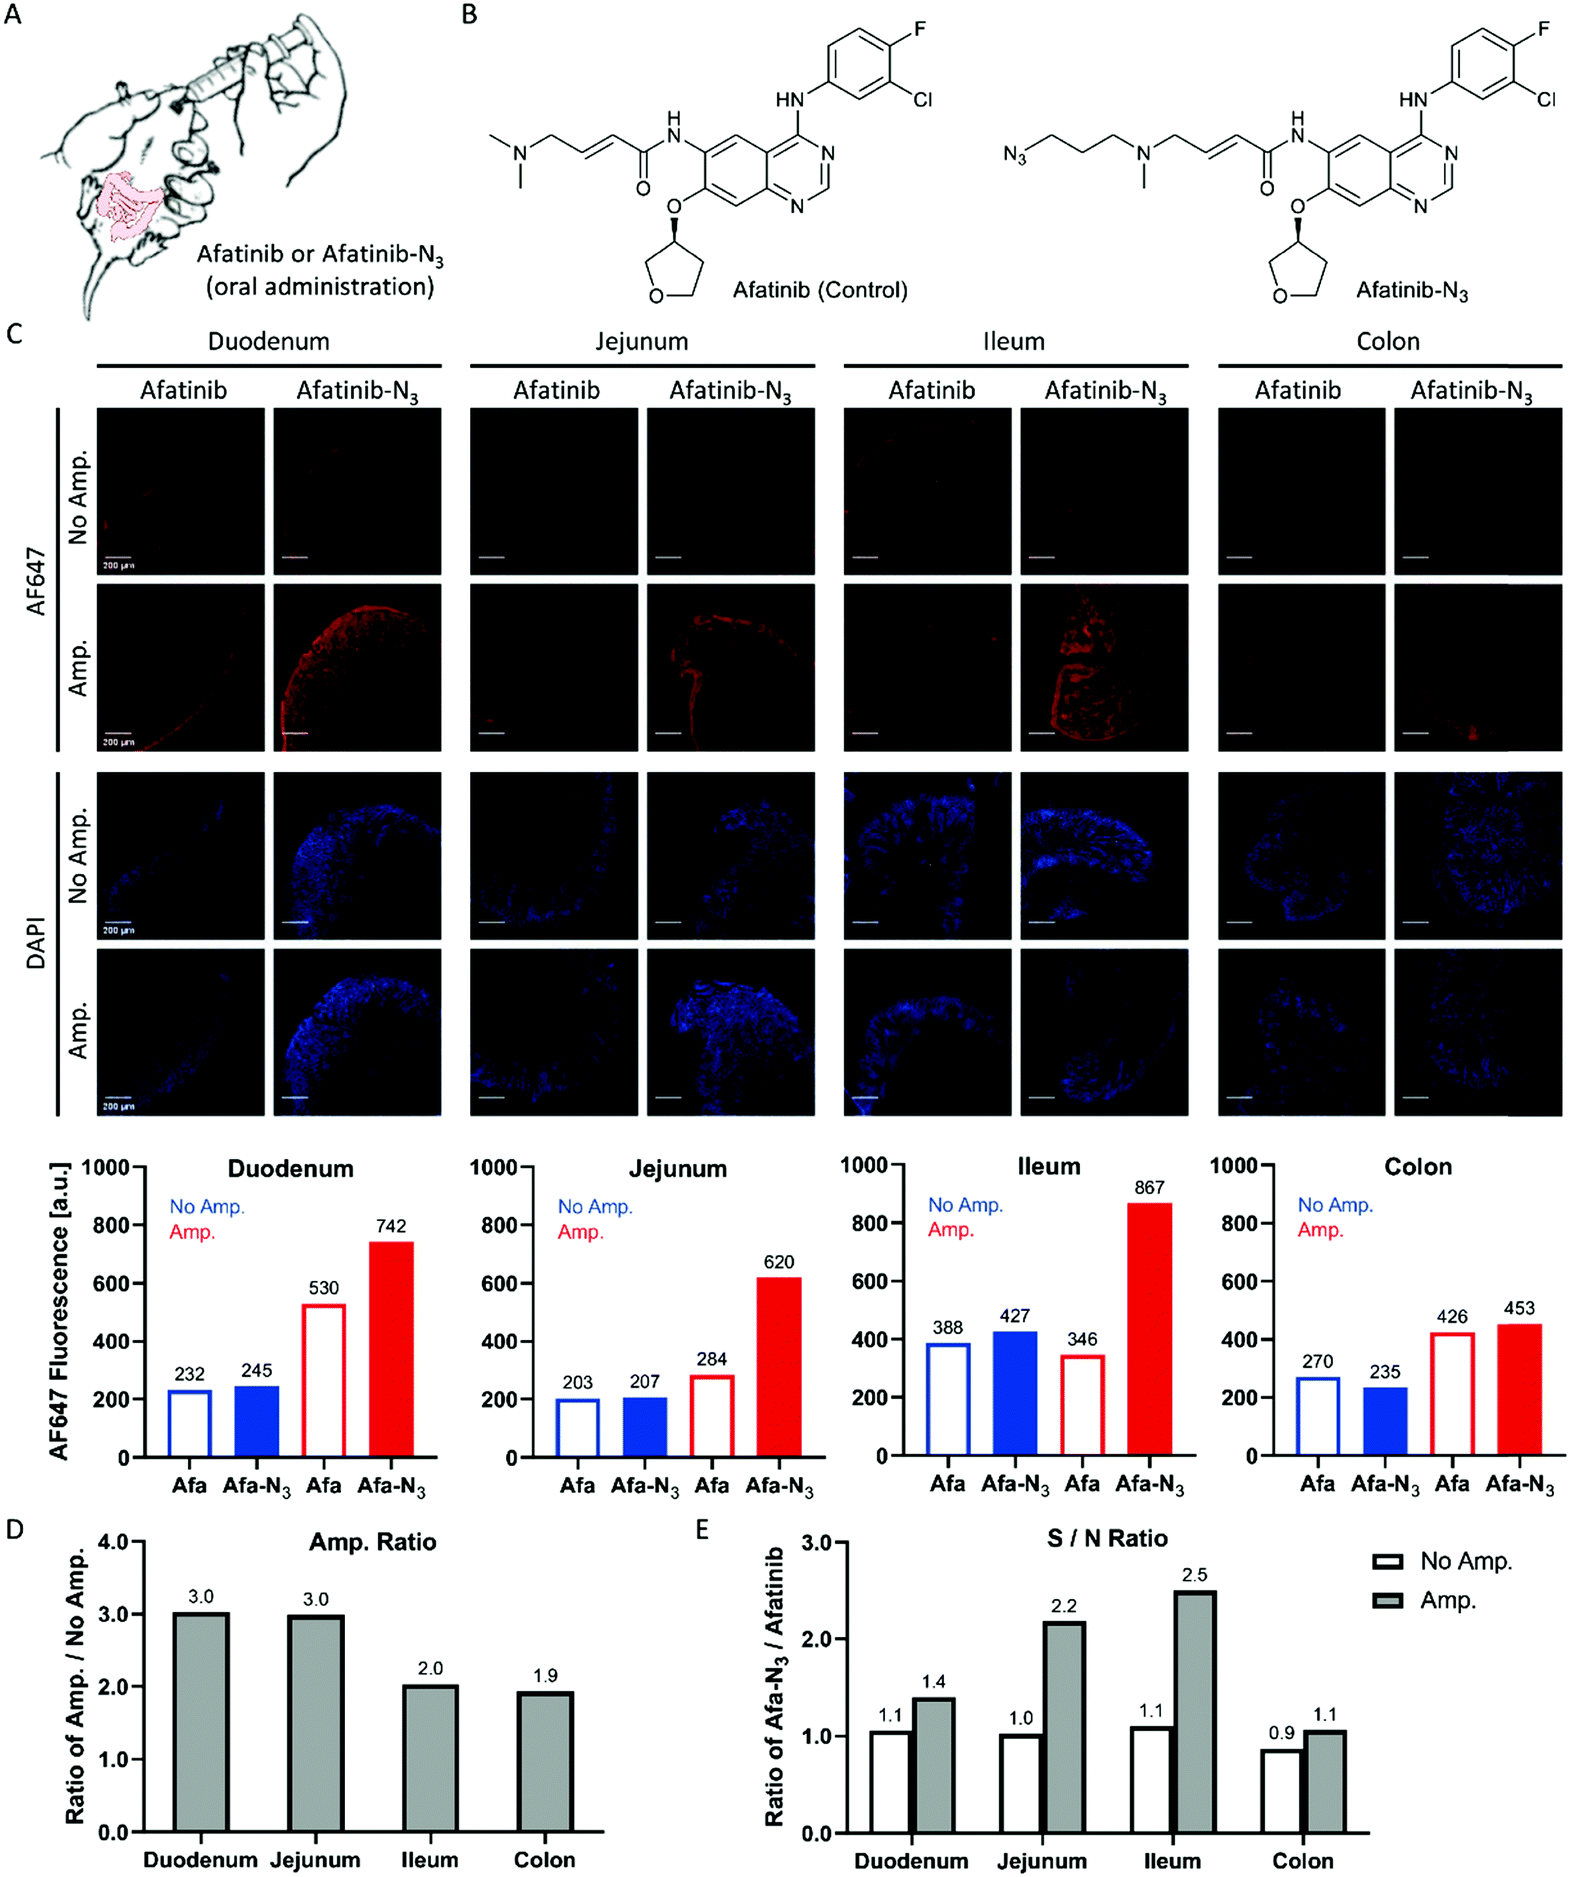 | ||
| Fig. 6 Click-based amplification on fixed intestinal sections of mice treated with afatinib-N3. (A) Scheme of P.O. treatment of mice with afatinib and afatinib-N3. (B) Structure of afatinib (control) and afatinib-N3. (C) Top: confocal imaging of fixed intestinal sections without and with Click-based amplification. The mice were orally administered with afatinib (10.0 mg kg−1) or afatinib-N3 (11.4 mg kg−1, equal mol), and dissection was carried out 24 h later. DAPI stained the nuclei of the intestinal cells. Scale bars, 200 μm. Bottom: Quantification of tissue fluorescence intensities. The whole specimen was circled and measured for the mean fluorescence intensity with ImageJ. Blue column, tissue fluorescence intensity without Click-based amplification. Red column, tissue fluorescence intensity with Click-based amplification. (D) Amplification ratios (Amp./No Amp.). (E) Signal-to-noise ratios (afatinib-N3/afatinib). | ||
Conclusions
In summary, Click-based amplification has been demonstrated to amplify various click-labelling systems with ultralow background amplification. The streptavidin-based amplifier is a minimalist design: it has a moderate number of functional groups, is homogenous, is of small size, is cheap on the market, and can be stored as ready-to-use aliquots in a refrigerator. Picolyl azide (pAz) was used as the functional group of the amplifier to accelerate the click conversion.Click-based amplification could be well integrated with various click-labelling modes, and provided fluorescence amplification for NHS-N3, EdU and afatinib-N3 labelling by 3.0–12.7 fold in fixed HeLa cells. Compared with the widely used TSA, Click-based amplification introduced very low nonspecific amplification when used in cell imaging, and gave a higher signal-to-noise ratio. Signal amplification of tissue specimens is challenging. Click-based amplification achieved a moderate signal amplification and improved the signal-to-noise ratio of afatinib-N3 labelling in fixed mouse intestinal sections. Tissue imaging with the drug probe would provide direct visualization of drug distribution, and could be complementary to target protein imaging. Collectively, we could expect that this newly developed Click-based amplification method will find broad application in biomedical research.
Experimental methods
General organic synthesis
The organic reactions involved in this work were carried out in flasks containing an argon atmosphere, which were sealed with a rubber stopper. All chemical reagents purchased from commercial suppliers were used without further purification. The reaction solvents were ultra-dry solvents containing molecular sieves, and transferred with injection syringes. TLC and LC-MS were used to monitor reactions, and silica gel column chromatography purifications were carried out to separate the intermediates and products. Products were characterized with 1H-NMR (400 MHz), 13C-NMR (101 MHz) and HRMS.Proteins and chemicals
Streptavidin (bs-0437P, Bioss), Streptavidin-AF647 (bs-0437P-AF647, Bioss), SA-HRP (B110053-0100, Diamond), Biotin-XX Tyramide (A8012-10, APExBIO), a BCA Protein Assay Kit (PT0001, Leagene), ProLong Gold Antifade Mountant with DAPI (P36941, Invitrogen), EdU (ST067, Beyotime), afatinib (BD210970, Bide Pharmatech), Biotin-PEG4-alkyne (#764213, Sigma), and BTTAA (BDJ-4, Confluore) were used.Synthesis of streptavidin-based amplifiers
Click conversion of the amplifiers in solution
To a solution of streptavidin-N3 (0.21 mg mL−1 by BCA) or streptavidin-pAz (0.17 mg mL−1 by BCA) in PBS, 0.5 mM biotin-PEG4-alkyne, 0.5 mM CuSO4, 1 mM BTTAA and 2.5 mM sodium ascorbate were added. The reaction mixture was rolling over at room temperature for 2 h, then another 2.5 mM sodium ascorbate was added. The reaction was maintained for another 1 h. The protein product was purified with a HiTrap desalting column, using Milli-Q purified water as the eluent. After freeze drying, the protein powder was redissolved with water containing 0.3% formic acid. The protein sample was analysed with an ESI-TOF mass spectrometer. The molecular weight was obtained after deconvolution, and the click conversion efficiency was calculated based on the integration of MS peaks.Cell culture and labelling
000 cells per mL in DMEM and seeded into a 24-well plate at 0.5 mL per well. A 12 mm glass coverslip was placed at the bottom of each well to allow HeLa cell adhesion.
Click-based amplification workflow
Tyramide signal amplification (TSA) workflow
TSA was carried out following the indication of the TSA Plus Biotin Kit (PerkinElmer, NEL749A001KT). TNT wash buffer contains 0.1 M Tris–HCl (pH 7.5), 0.15 M NaCl and 0.05% Tween 20.:1000) in TNB buffer was added to HeLa cells and incubated for 30 min. Cells were washed with TNT buffer three times. (BSA was used as the blocking reagent in TNB buffer, because the recommended blocking reagent FP1020 by PerkinElmer was not commercially available at that moment.)
Anti-fade mounting was performed the same way as that in Click-based amplification.
Animals and afatinib/afatinib-N3 treatment
All animals in this study were bought from a company (Charles River, China) and acclimated for one week before experimental use. All the animals were housed in the barrier facility of the laboratory animal center with 12 hours of light and 12 hours of darkness, and all experiments were approved by the Institutional Animal Use and Care Committee. Male C57BL/6 (8 week old) mice were divided into two groups: the afatinib group (n = 3) and afatinib-N3 group (n = 3). Both compounds were dissolved in a solution containing 10% DMSO and 40% 2-hydroxypropyl-beta-cyclodextrin in water, and orally administered to the mice (10.0 mg kg−1 and 11.4 mg kg−1 respectively). Dissection was performed 24 h later. Duodenum, jejunum, ileum and colon specimens were collected and embedded in an optimal cutting temperature compound (OCT compound). Cryostat sectioning was carried out by cutting 8 μm thick sections in a slicer at −20 °C. The intestinal tissue sections were frozen at −80 °C before use.Click-based amplification of mouse intestinal sections
An ImmEdge™ Pen (Vector Laboratories, H-4000) was used for drawing a water-repellent barrier around the tissue section that was mounted on a microscope slide. The tissue specimen was washed with PBS twice, fixed with 4% PFA for 10 min, then quenched with 50 mM NH4Cl/glycine in PBS. The click conversion of N3 labelling was performed with 10 μM biotin-PEG4-alkyne, 100 μM CuSO4, 200 μM BTTAA and 2.5 mM sodium ascorbate in PBS at room temperature for 30 min. The tissue specimen was washed with PBS five times after click reaction.Confocal imaging and fluorescence quantification
Ethical statement
All animal procedures were performed in accordance with the Guidelines for the Care and Use of Laboratory Animals of Peking University and approved by the Animal Ethics Committee of Peking University.Author contributions
X. Lei and Y. Li conceived the project. J. Bai performed the organic synthesis, protein modification, cell labelling and amplification, confocal imaging and fluorescence quantification. F. Guo performed the mouse treatment, the surgery and mouse intestinal frozen section preparation. M. Li participated in the early-stage setup and experimental design. All authors contributed to the data processing and analysis. J. Bai and X. Lei wrote the manuscript with input from the other authors.Conflicts of interest
There are no conflicts to declare.Acknowledgements
This project was supported by the National Key Research & Development Plan (2017YFA0505200 to Xiaoguang Lei), the National Natural Science Foundation of China (21625201, 21961142010, 21661140001, 91853202 and 21521003 to Xiaoguang Lei), the Beijing Outstanding Young Scientist Program (BJJWZYJH01201910001001 to Xiaoguang Lei) and the Beijing Brain Initiative of the Beijing Municipal Science & Technology Commission (Z181100001518004 to Yulong Li).References
- M. N. Bobrow, T. D. Harris, K. J. Shaughnessy and G. J. Litt, J. Immunol. Methods, 1989, 125, 279–285 CrossRef CAS.
- R. M. Dirks and N. A. Pierce, Proc. Natl. Acad. Sci. U. S. A., 2004, 101, 15275 CrossRef CAS PubMed.
- R. Lin, Q. Feng, P. Li, P. Zhou, R. Wang, Z. Liu, Z. Wang, X. Qi, N. Tang, F. Shao and M. Luo, Nat. Methods, 2018, 15, 275–278 CrossRef CAS PubMed.
- S. K. Saka, Y. Wang, J. Y. Kishi, A. Zhu, Y. Zeng, W. Xie, K. Kirli, C. Yapp, M. Cicconet, B. J. Beliveau, S. W. Lapan, S. Yin, M. Lin, E. S. Boyden, P. S. Kaeser, G. Pihan, G. M. Church and P. Yin, Nat. Biotechnol., 2019, 37, 1080–1090 CrossRef CAS PubMed.
- M. Beck, A. Schmidt, J. Malmstroem, M. Claassen, A. Ori, A. Szymborska, F. Herzog, O. Rinner, J. Ellenberg and R. Aebersold, Mol. Syst. Biol., 2011, 7, 549 CrossRef PubMed.
- S. H. Rouhanifard, I. A. Mellis, M. Dunagin, S. Bayatpour, C. L. Jiang, I. Dardani, O. Symmons, B. Emert, E. Torre, A. Cote, A. Sullivan, J. A. Stamatoyannopoulos and A. Raj, Nat. Biotechnol., 2019, 37, 84–89 CrossRef CAS PubMed.
- Y. Cho, J. Seo, Y. Sim, J. Chung, C. E. Park, C. G. Park, D. Kim and J. B. Chang, Nanoscale, 2020, 12, 23506–23513 RSC.
- S. Tommasone, F. Allabush, Y. K. Tagger, J. Norman, M. Köpf, J. H. R. Tucker and P. M. Mendes, Chem. Soc. Rev., 2019, 48, 5488–5505 RSC.
- L. K. Mahal, K. J. Yarema and C. R. Bertozzi, Science, 1997, 276, 1125 CrossRef CAS PubMed.
- A. Salic and T. J. Mitchison, Proc. Natl. Acad. Sci. U. S. A., 2008, 105, 2415 CrossRef CAS.
- L. Wang, J. Xie and P. G. Schultz, Annu. Rev. Biophys. Biomol. Struct., 2006, 35, 225–249 CrossRef CAS.
- N. Raddaoui, S. Stazzoni, L. Möckl, B. Viverge, F. Geiger, H. Engelke, C. Bräuchle and T. A.-O. Carell, ChemBioChem, 2017, 18, 1716–1720 CrossRef CAS PubMed.
- I. Le Trong, Z. Wang, D. E. Hyre, T. P. Lybrand, P. S. Stayton and R. E. Stenkamp, Acta Crystallogr., Sect. D: Biol. Crystallogr., 2011, 67, 813–821 CrossRef CAS PubMed.
- H. Kolb, M. Prof and K. Prof, Angew. Chem., 2001, 113, 2056–2075 CrossRef.
- N. J. Agard, J. M. Baskin, J. A. Prescher, A. Lo and C. R. Bertozzi, ACS Chem. Biol., 2006, 1, 644–648 CrossRef CAS.
- R. van Geel, G. J. Pruijn, F. L. van Delft and W. C. Boelens, Bioconjugate Chem., 2012, 23, 392–398 CrossRef CAS.
- G.-C. Kuang, H. A. Michaels, J. T. Simmons, R. J. Clark and L. Zhu, J. Org. Chem., 2010, 75, 6540–6548 CrossRef CAS PubMed.
- C. Uttamapinant, A. Tangpeerachaikul, S. Grecian, S. Clarke, U. Singh, P. Slade, K. R. Gee and A. Y. Ting, Angew. Chem., Int. Ed., 2012, 51, 5852–5856 CrossRef CAS.
- M. Wuhrer, C. I. A. Balog, C. A. M. Koeleman, A. M. Deelder and C. H. Hokke, Biochim. Biophys. Acta, Gen. Subj., 2005, 1723, 229–239 CrossRef CAS PubMed.
- D. W. Ralin, S. C. Dultz, J. E. Silver, J. C. Travis, M. Kullolli, W. S. Hancock and M. Hincapie, Clin. Proteomics, 2008, 4, 37–46 CrossRef CAS.
- F. Sutanto, M. Konstantinidou and A. Dömling, RSC Med. Chem., 2020, 11, 876–884 Search PubMed.
- A. K. Ghosh, I. Samanta, A. Mondal and W. R. Liu, ChemMedChem, 2019, 14, 889–906 CrossRef CAS PubMed.
- R. T. Dungo and G. M. Keating, Drugs, 2013, 73, 1503–1515 CrossRef CAS PubMed.
- Y. Tu, Y. OuYang, S. Xu, Y. Zhu, G. Li, C. Sun, P. Zheng and W. Zhu, Bioorg. Med. Chem., 2016, 24, 1495–1503 CrossRef CAS PubMed.
- D. E. Sun, X. Fan, Y. Shi, H. Zhang, Z. Huang, B. Cheng, Q. Tang, W. Li, Y. Zhu, J. Bai, W. Liu, Y. Li, X. Wang, X. Lei and X. Chen, Nat. Methods, 2021, 18, 107–113 CrossRef CAS PubMed.
- K. Park, E. H. Tan, K. O’Byrne, L. Zhang, M. Boyer, T. Mok, V. Hirsh, J. C. Yang, K. H. Lee, S. Lu, Y. Shi, S. W. Kim, J. Laskin, D. W. Kim, C. D. Arvis, K. Kölbeck, S. A. Laurie, C. M. Tsai, M. Shahidi, M. Kim, D. Massey, V. Zazulina and L. Paz-Ares, Lancet Oncol., 2016, 17, 577–589 CrossRef CAS PubMed.
- J. C. Soria, E. Felip, M. Cobo, S. Lu, K. Syrigos, K. H. Lee, E. Göker, V. Georgoulias, W. Li, D. Isla, S. Z. Guclu, A. Morabito, Y. J. Min, A. Ardizzoni, S. M. Gadgeel, B. Wang, V. K. Chand and G. D. Goss, Lancet Oncol., 2015, 16, 897–907 CrossRef CAS.
- Y.-C. Tsai, C.-H. Yeh, K.-Y. Tzen, P.-Y. Ho, T.-F. Tuan, Y.-S. Pu, A.-L. Cheng and J. C.-H. Cheng, Eur. J. Cancer, 2013, 49, 1458–1466 CrossRef CAS PubMed.
- Y. Chen, X. Chen, X. Ding and Y. Wang, Mol. Med. Rep., 2019, 20, 3317–3325 CAS.
- Y. Yamamoto, T. Saita, Y. Yamamoto, R. Sogawa, S. Kimura, Y. Narisawa, S. Kimura and M. Shin, Acta Histochem., 2019, 121, 151439 CrossRef CAS.
Footnote |
| † Electronic supplementary information (ESI) available. See DOI: 10.1039/d1cb00002k |
| This journal is © The Royal Society of Chemistry 2021 |