
 Open Access Article
 This Open Access Article is licensed under a Creative Commons Attribution-Non Commercial 3.0 Unported Licence
Light-induced modulation of DNA recognition by the Rad4/XPC damage sensor protein†
Amirrasoul
Tavakoli
 a,
Debamita
Paul
a,
Hong
Mu
b,
Jagannath
Kuchlyan‡
a,
Saroj
Baral
c,
Anjum
Ansari
c,
Suse
Broyde
b and
Jung-Hyun
Min
*a
a,
Debamita
Paul
a,
Hong
Mu
b,
Jagannath
Kuchlyan‡
a,
Saroj
Baral
c,
Anjum
Ansari
c,
Suse
Broyde
b and
Jung-Hyun
Min
*a
aDepartment of Chemistry and Biochemistry, Baylor University, Waco, TX 76798, USA. E-mail: JungHyun_Min@baylor.edu; Tel: +1 254-710-2095
bDepartment of Biology, New York University, New York, NY 10003, USA
cDepartment of Physics, University of Illinois at Chicago, Chicago, IL 60607, USA
First published on 6th January 2021
Abstract
Biomolecular structural changes upon binding/unbinding are key to their functions. However, characterization of such dynamical processes is difficult as it requires ways to rapidly and specifically trigger the assembly/disassembly as well as ways to monitor the resulting changes over time. Recently, various chemical strategies have been developed to use light to trigger changes in oligonucleotide structures, and thereby their activities. Here we report that photocleavable DNA can be used to modulate the DNA binding of the Rad4/XPC DNA repair complex using light. Rad4/XPC specifically recognizes diverse helix-destabilizing/distorting lesions including bulky organic adduct lesions and functions as a key initiator for the eukaryotic nucleotide excision repair (NER) pathway. We show that the 6-nitropiperonyloxymethyl (NPOM)-modified DNA is recognized by the Rad4 protein as a specific substrate and that the specific binding can be abolished by light-induced cleavage of the NPOM group from DNA in a dose-dependent manner. Fluorescence lifetime-based analyses of the DNA conformations suggest that free NPOM-DNA retains B-DNA-like conformations despite its bulky NPOM adduct, but Rad4-binding causes it to be heterogeneously distorted. Subsequent extensive conformational searches and molecular dynamics simulations demonstrate that NPOM in DNA can be housed in the major groove of the DNA, with stacking interactions among the nucleotide pairs remaining largely unperturbed and thus retaining overall B-DNA conformation. Our work suggests that photoactivable DNA may be used as a DNA lesion surrogate to study DNA repair mechanisms such as nucleotide excision repair.
Introduction
Biological processes entail dynamic yet coordinated assembly and disassembly of multiple molecules in solution. A key challenge in studying these processes in high structural and temporal resolution lies in the difficulties in controlled triggering of these events. Methods of triggers often involve either perturbing the equilibrium state using temperature-, salt- or pH-jumps or initiating the binding/unbinding through rapid mixing. Another method of triggering involves photo-induced chemical changes, as showcased by pioneering studies on dynamics of allosteric transitions in hemoglobin.1,2 Photoconvertible groups undergo structural changes upon irradiation by light, usually of a specific wavelength, in a reversible or irreversible manner.3,4 Such light-induced chemical/structural conversions have emerged as useful tools to control the properties and hence probe the functions of biomolecules harboring the photoconvertible groups, as light can be easily applied to biological systems in vitro or in vivo to trigger specific events.5–9 Photoconvertible modifications in small molecules,10–12 oligonucleotides,13 peptides,14,15 and proteins (mostly enzymes)16–19 have also been used to control and monitor a wide variety of biological outcomes including gene expression, enzyme activity, oligomerization states, cellular localization and immune responses.One of the photoconvertible groups, the 6-nitropiperonyloxymethyl (NPOM) has been introduced by the Deiters group as an improvement over previous o-nitrobenzyl derivatives for modifying biomolecules including oligonucleotides20–22 (Fig. 1). Irradiating an NPOM-modified nucleoside/DNA/RNA with light (λ = 365 nm) cleaves the NPOM from the substrate without damaging the parent compound and restores the unmodified structures with concomitant release of 1-(6-nitroso-1,3-benzodioxol-5-yl)ethenone (hereafter nitrosoacetophenone) (Fig. 1).23–26 Compared with the previous O-nitrobenzyl derivatives such as 6-nitroveratryl (NV) and 6-nitroveratryloxycarbonyl (NVOC) groups, NPOM features a higher quantum yield (Φ = 0.094 versus Φ = 0.0013 for NVOC), is highly stable in an aqueous environment at various pHs21,23,27 and penetrates cell membranes without altering growth rate or phenotype of the cells/organisms.28 The NPOM modification has been applied to various in vitro and in vivo biological studies. For instance, photocleavage of NPOM-modified DNA/RNA has been used to control the activities of DNAzymes,29 antisense DNA/RNA,13,30 restriction endonucleases,31 DNA-binding transcription factors,32 polymerase chain reaction (PCR) rates,33 as well as CRISPR-Cas gene editing.9,18,34,35 In these cases, NPOM-modifications prevent the DNA or RNA from hybridizing to the complementary strands, which could be reversed upon NPOM cleavage with light, converting the unhybridized ‘inactive’ molecules to hybridized ‘active’ molecules.
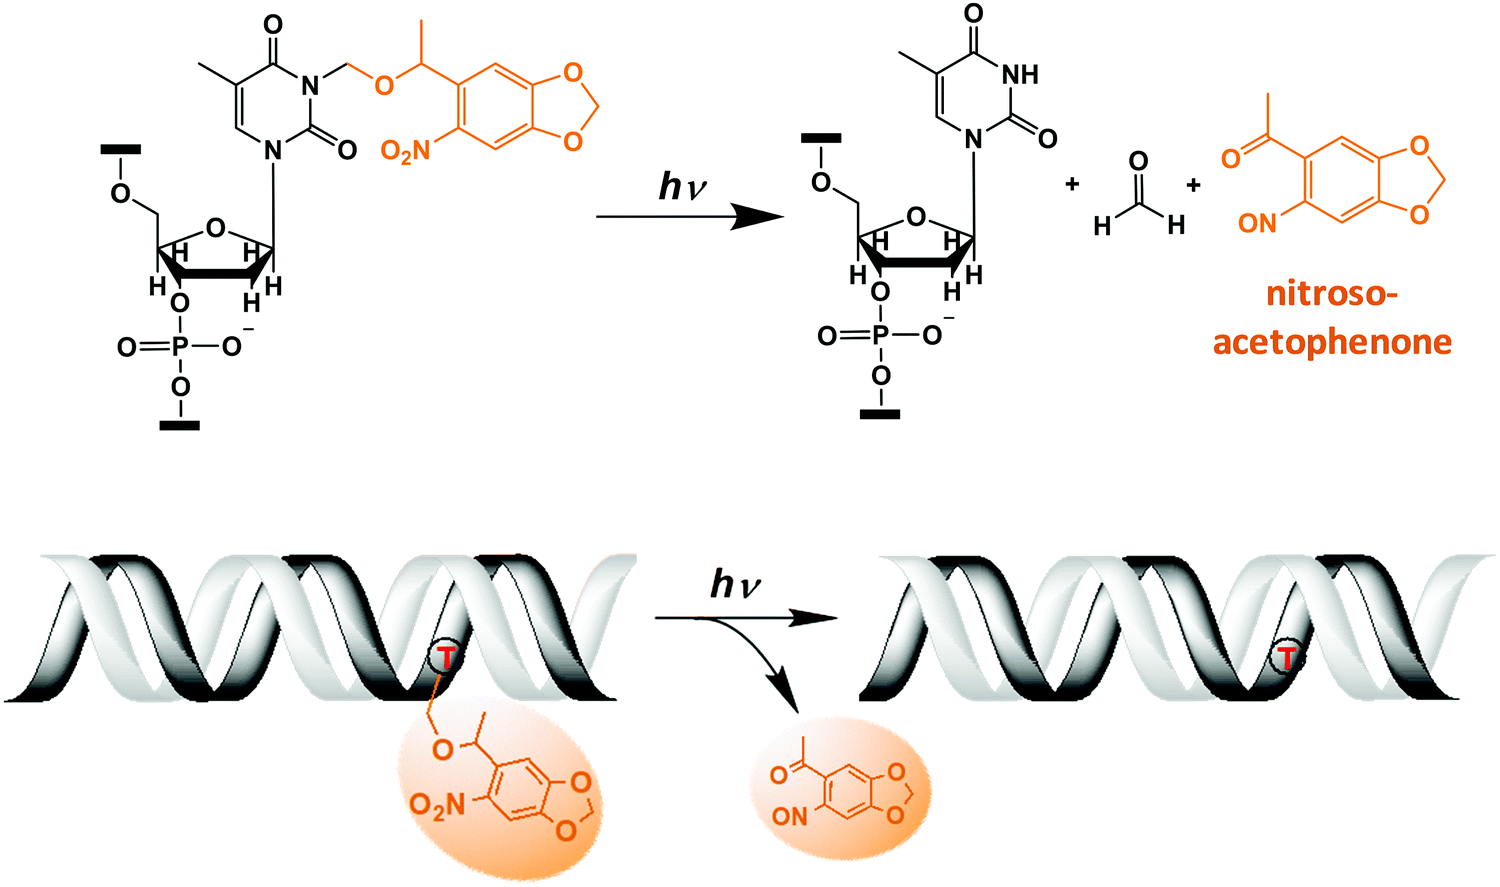 | ||
| Fig. 1 Light-induced photocleavage reaction of the NPOM group from DNA. (Top) Schematic of the photocleavage reaction. Upon light irradiation (λ = 365 nm or 405 nm), the NPOM group (orange) is cleaved from the modified thymidine (dT) in the DNA, restoring unmodified thymidine while releasing nitrosoacetophenone. (Bottom) Cartoon of the photocleavage reaction in NPOM-containing duplexed DNA. | ||
Here, we took advantage of the fact that DNA modifications such as NPOM are quite bulky and thus perhaps could be seen as a lesion on DNA by cellular DNA repair machineries, particularly those involved in the nucleotide excision repair (NER) pathway. NER repairs a wide spectrum of bulky adduct lesions in the DNA including sunlight-induced intra-strand crosslinks, bulky DNA adducts induced by various metabolites, reactive oxygen species, environmental pollutants and carcinogens (reviewed in ref. 36–38). Genetic impairment in NER causes high sun sensitivity xeroderma pigmentosum (XP) cancer predisposition syndrome in humans.37,39 In eukaryotic NER, the repair of these lesions scattered around the global genome is primarily initiated when the XPC–RAD23B complex (Rad4–Rad23 in yeast; hereafter referred to as XPC and Rad4) first specifically localizes to the lesion. The lesion binding by Rad4/XPC subsequently leads to the recruitment of the transcription factor IIH complex (TFIIH) containing XPD and XPB helicases, which verifies the presence of a bulky lesion and recruits other NER factors. Eventually, a 24–32 nucleotide (nt) lesion-containing portion of the DNA strand is excised by the XPF-ERCC1 and XPG endonucleases and the gap in the DNA is restored by repair synthesis and nick sealing.
Previous studies from our group have shown that Rad4 recognizes DNA lesions in an indirect manner: crystal structures of Rad4 bound to UV-lesions showed that the Rad4 flips two damage-containing nucleotide pairs out of the duplex with the damaged nucleotides flipped away from the protein, such that only the undamaged nucleotides on the complementary strand make direct contacts with the protein (the so-called ‘open’ conformation).40,41 This and other studies pose a puzzle as to the mechanism of this indirect readout by Rad4 and the nature of the structural intermediates along the recognition trajectory. These missing key steps led us to ponder whether photoconvertible adducts could serve as model DNA lesions and if their photoconvertible characteristics could be used to trigger the binding/unbinding events in a precisely controlled manner for structural and functional studies. So far, photoconvertible DNA/RNA has been mostly used for cellular and genetic studies but not as much for probing the biochemical and structural mechanisms, let alone for investigating NER.9,42
Here, using fluorescence lifetime-based Förster resonance energy transfer (FLT-FRET) measurements with cytosine analog FRET pair, tC° and tCnitro, that are uniquely sensitive to changes in B-DNA conformation,43–46 together with UV-visible spectroscopy and competitive electrophoretic mobility shift assays (EMSA), we show that (1) the NPOM modification on DNA, though largely retaining B-DNA form, is specifically recognized by Rad4, (2) this specific binding is accompanied by heterogeneous structural distortions in DNA and (3) this specific binding is abolished by photocleavage of the NPOM moiety from the DNA in a light-dose-dependent manner. Extensive conformational searches and molecular dynamics (MD) simulations of the DNA also corroborate with the fluorescence-based conformational analyses: the results demonstrate that the bulky NPOM moiety can be housed in the major groove of the DNA, with stacking interactions among the nucleotide pairs remaining largely unperturbed and thus retaining overall B-DNA conformation. Our findings provide the foundation for using NPOM and potentially other related photoconvertible DNA as novel probes to examine the damage recognition and repair mechanisms in the NER pathway. This groundwork opens doors to a variety of exciting future studies by coupling optical triggering with various techniques (e.g., fluorescence conformational dynamics spectroscopy, time-resolved X-ray crystallography, cellular repair kinetic studies) and contributes to expanding the current applicability of photochemistry to the DNA repair field.
Materials and methods
Preparation of Rad4–Rad23 complexes
The Rad4–Rad23 complex (or simply referred to as Rad4) was prepared as previously described.40,41,47 The Rad4 construct spans residues 101–632 and contains all four domains involved in DNA binding. This Rad4–Rad23 construct has previously been shown to exhibit the same DNA-binding characteristics as the full-length complex.41 While Rad23 does not participate in DNA binding directly, it is required for stabilizing Rad4.Hi5 insect cells co-expressing Rad4 and Rad23 proteins were harvested 2 days after infection. After lysis, the protein complex was purified by affinity chromatography (Ni-NTA Agarose, MCLAB), anion-exchange (Source Q, GE healthcare) and cation exchange (Source S, GE healthcare) chromatography followed by gel filtration (Superdex200, GE healthcare). The chromatogram and SDS-PAGE analyses of the gel filtration step show that peak fractions contain a homogeneous 1![[thin space (1/6-em)]](https://www.rsc.org/images/entities/char_2009.gif) :1 complex of Rad4 and Rad23 proteins. These peak fractions were pooled and further concentrated by ultrafiltration (Amicon Ultra-15, Millipore) to ∼13–14 mg ml−1 (135–150 μM) in 5 mM bis-tris propane–HCl (BTP–HCl), 800 mM sodium chloride (NaCl) and 5 mM dithiothreitol (DTT), pH 6.8. The complex was prepared without thrombin digestion, thus retaining the UBL domain of Rad23 and a histidine-tag on Rad4.
:1 complex of Rad4 and Rad23 proteins. These peak fractions were pooled and further concentrated by ultrafiltration (Amicon Ultra-15, Millipore) to ∼13–14 mg ml−1 (135–150 μM) in 5 mM bis-tris propane–HCl (BTP–HCl), 800 mM sodium chloride (NaCl) and 5 mM dithiothreitol (DTT), pH 6.8. The complex was prepared without thrombin digestion, thus retaining the UBL domain of Rad23 and a histidine-tag on Rad4.
Preparation of double-stranded DNA substrates
Unmodified DNA oligonucleotides were purchased from Biosynthesis or Integrated DNA Technologies (IDT). DNA oligomers synthesized with tC° and tCnitro were from Biosynthesis. All oligonucleotides were purchased as HPLC-purified. Oligonucleotides appeared as a single band on denaturing polyacrylamide gels, indicating high length-purity (>90%) of the oligonucleotides. The concentrations of each single-stranded DNA were determined by UV absorbance at 260 nm (NanoDrop OneC, ThermoFisher) using the A260 extinction coefficients calculated by the nearest neighbor method (Biosynthesis). To prepare DNA duplexes, two complementary oligonucleotides were mixed at 1:1 molar ratio at 100 μM in TE buffer (10 mM Tris–HCl pH 7.50, 1 mM EDTA) in a microcentrifuge tube and annealed by slow-cooling: the tube was immersed in a 1.2 L hot water bath (∼100 °C) placed on a hot plate; after 5 minutes, the hot plate was turned off and the samples were cooled to room temperature over 5 to 6 hours.
Photo-irradiation experiments and cleavage studies with NPOM DNA and NPOM-dT (NPOM-modified deoxythymidine)
NPOM-dT was purchased from Berry & Associates (Cat No. PY 7795). 50 μl of 10–50 μM of DNA samples or NPOM-dT were irradiated in a chamber encasing four UV-A lamps, at 6.4 mW cm−2 (measured by General Tools Digital UVA/UVB Meter, 280–400 nm; #UV513AB). At specified time intervals, 1.5 μl of the sample was taken out and its absorbance spectrum was measured with NanoDrop One UV-Vis Spectrophotometer. The experiments were done with lights off in the lab. Exposing the NPOM-dT 10–400 μM in TE buffer with 0.01–0.4% DMSO or NPOM-DNA 10–50 μM in TE buffer under ambient light in the lab for 24 hours did not change the absorbance spectra of the samples, indicating little photocleavage by ambient light. For irradiation at 405 nm (blue light), we used a 405 nm LED lamp strip (6 W total output with delivered power estimated as ∼4–8 mW cm−2). The progress of the photocleavage reaction was monitored using the UV-visible spectrophotometer as described above. The time courses of the photocleavage reactions were analyzed by single exponential fitting using OriginPro 9.7.0.188 software (OriginLab).Melting temperature measurements of DNA duplexes
The overall thermal stabilities of all DNA duplexes were measured as follows. The absorbance at 260 nm of each DNA duplex (1.5 μM) was measured in a sample cuvette of path length 1 cm, using Cary 300 Bio UV-Visible spectrophotometer equipped with a Varian temperature controller. The absorbance measurements were done from 10 to 85 °C at every 1.0 °C interval. Derivative method48 of Carry300 (Thermal software) was used to calculate the melting temperature (Tm) at which 50% of the DNA strands have separated. The derivatives were obtained numerically from the absorbance data using a Savitzky Golay technique where the difference between adjacent points was first computed followed by a smoothing procedure where 5 points surrounding an individual point were averaged to produce a new, smoothed point.49Competition electrophoretic mobility shift assays (EMSA)
To determine the relative affinities of Rad4 binding to different DNA substrates, competition EMSA (or gel-shift assays) were employed as previously described.40,41,43,47,50,51 The benefit of using this competition assay over the conventional single-substrate EMSA is that one can directly observe any preferential binding over the nonspecific binding, including factors such as potential DNA end-binding while avoiding multiple proteins aggregating on a single DNA, as is the case when protein is in excess of total DNA.51 Various concentrations of the Rad4–Rad23 complexes were mixed with 5 nM 32P-labelled DNA of interest (mismatched/damaged or matched/undamaged) in the presence of 1000 nM cold (unlabeled), matched DNA, CH7_NX in an EMSA buffer (5 mM BTP–HCl, 75 mM NaCl, 5 mM DTT, 5% glycerol, 0.74 mM 3-[(3-cholamidopropyl)dimethylammonio]-1-propanesulfonate (CHAPS), 500 μg ml−1 bovine serum albumin, pH 6.8). Mixed samples were incubated at room temperature for 20 min and separated on 4.8% non-denaturing polyacrylamide gels in 1× TBE buffer (89 mM Tris–HCl, 89 mM boric acid, 2 mM EDTA, pH 8.0), run at constant 150 V for 15 min at 4 °C. The gels were quantitated by autoradiography using Typhoon FLA9000 and Imagelab 6.0.1 software (Bio-Rad). The averages of the Rad4-bound DNA fractions quantified from three independent EMSA gels were used for subsequent calculations of the apparent dissociation constants (Kd,app).To obtain apparent dissociation constants (Kd,app) for different DNA substrates, we first used the matched CH7_NX DNA as both the ‘hot’ probe and the cold competitor DNA, and obtained the Kd,app for CH7_NX (Kns) by fitting the fraction of labelled DNA bound (f) to the equation
| f2·[Dns]t − f·([Dns]t + [P]t + Kns) + [P]t = 0. |
| f2·{Ks2 − ([Dns]t − [P]t + Kns)·Ks − [P]t·Kns} + f·{([Dns]t − [P]t + Kns) + 2·[P]t·Kns} − [P]t·Kns = 0. |
Time-resolved fluorescence spectroscopy for fluorescence lifetime (FLT) measurements
DNA duplexes labeled with both tC° and tCnitro (DNA_DA) or tC° alone (DNA_D) were prepared as described above. The DNA and Rad4–Rad23–DNA 1:1 complex were prepared at 5 μM in phosphate-buffered saline (PBS: 10 mM Na2HPO4, 2 mM KH2PO4, 137 mM NaCl, 2.7 mM KCl pH 7.4) with 1 mM DTT. Under this condition, native gel electrophoresis and dynamic light scattering experiments showed that the Rad4–Rad23–DNA samples form uniformly sized 1:1 protein:DNA complexes.51 Sample volume for each fluorescence lifetime (FLT) measurement was 12 μl. Fluorescence decay curves for the FRET donor tC° (in the absence and presence of the FRET acceptor tCnitro, which in itself is nonfluorescent) were measured with DeltaFlex single-photon counting instrument (HORIBA) equipped with a Ti-sapphire laser as the excitation light source (Mai Tai HP, Spectra-Physics). The beam for tC° excitation was produced by frequency doubling of the fundamental beam (730 nm) and pulse-picking at 4 MHz, which was then passed through a monochromator set at 365 nm (band pass 10 nm). The fluorescence signal emitted at 470 nm (band pass 10 nm) was collected by a Picosecond Photon Detection module (PPD-850, Horiba) using time-correlated single-photon counting (TCSPC) electronics. Fluorescence decay curves were recorded on a 100 ns timescale, resolved into 4096 channels, to a total of 10000 counts in the peak channel. All details are in Methods (ESI†).
Analysis of the fluorescence decay traces using discrete exponential (DE) fits
The discrete exponential (DE) analysis was carried out using EzTime software (version 3.2.9.9, Horiba) that uses a standard iterative reconvolution method, assuming a multiexponential decay function,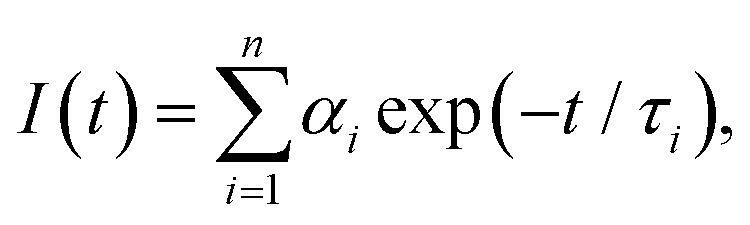 where αi is the amplitude and τi is the fluorescence lifetime of the i-th decay component (Table S1, ESI†). The maximum number of exponentials allowed by this software is five. For all measured decay traces, no more than four exponentials were needed to reasonably fit the data. The number of exponentials required for each trace was determined by the quality of the fit, evaluated based on the reduced chi-square χ2 and the randomness of residuals (Fig. S6, ESI†). Each exponential component for the donor–acceptor labeled samples (DNA_DA) was characterized in terms of a lifetime denoted as τDA,i, and a corresponding normalized amplitude or relative population
 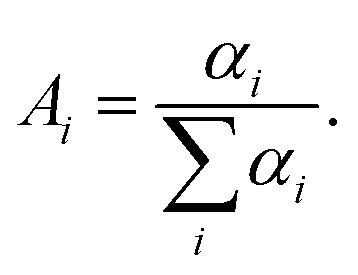 The FRET efficiency for the population in that component was computed from
 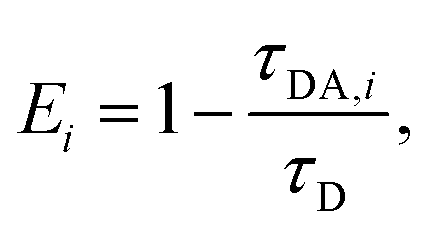 where τD indicates the intrinsic lifetime of the donor probe. The average FRET efficiency for each sample was computed as
 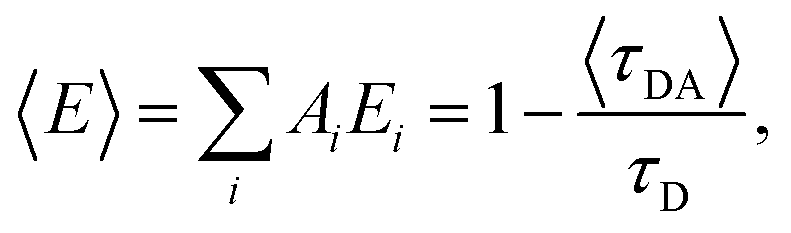 where
where  For cases where the intrinsic lifetime of the donor-only samples could not be described by a single exponential, τD was taken as the intrinsic lifetime of the donor probe obtained from unmodified DNA (AT10_D).
Analysis of the decay traces using maximum entropy method (MEM) and Gaussian fitting
Though the DE fitting has been traditionally used for fluorescence lifetime decay analyses, MEM has distinct advantages.43,52 In our previous studies, we have also shown that the results from the DE and MEM analyses corroborate with each another.43 The MEM analyses were carried out using MemExp software,53,54 as done previously.43 The reproducibility of the distributions obtained from the MEM analyses from three independent lifetime measurements on each sample are illustrated in (Fig. S8, ESI†). The data presented in (Fig. 4) are for one representative from this set. To further characterize the lifetime distributions from the MEM analyses, we fitted the measured distributions to a sum of Gaussians (Fig. S7, ESI†). Each Gaussian component was used to calculate the average FRET representing that component, and the area under the Gaussian curve was taken as a measure of the fractional population of that component. The results are summarized in Table S2 (ESI†). Errors are indicated with standard deviations (s.d.) from three independent sets of measurements.Conformational searches and molecular dynamics simulations of NPOM-dT-containing DNA duplex structures
In order to explore the structures of the NPOM-dT-containing DNA duplex, we first modeled NPOM-dT at the center of a 13-mer B-DNA duplex with the same sequence as in the AT2 NPOM-DNA (Table 1) employed in the experimental study. We carried out extensive conformational searches beginning with an NPOM-dT nucleoside to generate initial models for MD simulations of NPOM-dT in a B-DNA duplex, utilizing a sequence of protocols involving molecular modeling (Discovery Studio 2.5, Accelrys Software Inc.) and quantum mechanical geometry optimization (Gaussian 0955) to define sterically feasible NPOM-dT rotamer combinations for initiating the MD simulations (Fig. S13 and S14, ESI†). These protocols and obtained structures are summarized in Scheme 1. We used the AMBER18 suite of programs56 for MD simulations and analyses. Full details of NPOM-dT force field parameterization, MD simulation methods and analyses are given in the ESI,† Methods. Newly developed force field parameters for the NPOM-dT are given in Table S3 (ESI†).| a D: tC°(FRET donor); P: tCnitro(FRET acceptor). This design is based on design in ref. 43. b Red indicates NPOM-modified dT. c These values are from ref. 40.Bold indicates the position of the 3-bp sequence corresponding to the CCC/CCC mismatched site in CH10_NX. Tm values are reported as the average ± standard deviation (s.d.) of three independent measurements (see Fig. S3, ESI). The minimal uncertainty in Tm as judged by half the temperature interval between successive data points in the derivatives graph is 0.5 °C. |
|---|

|
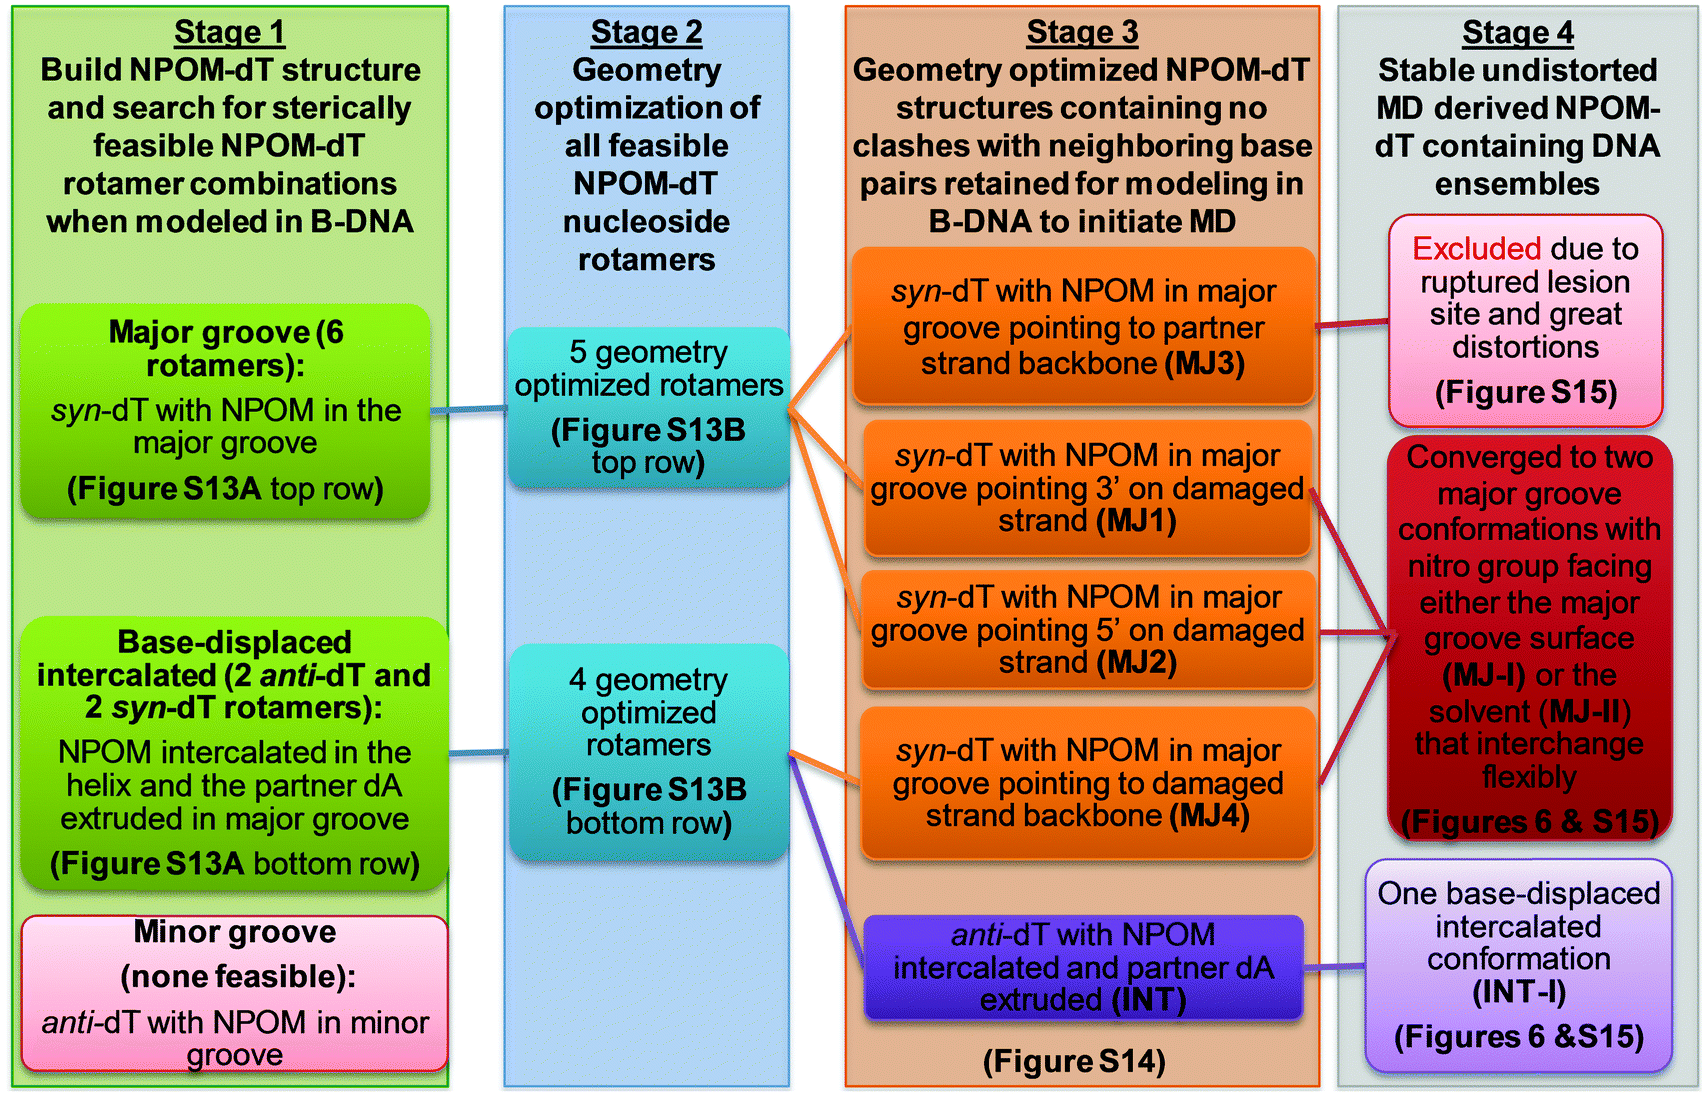 | ||
| Scheme 1 Conformational search strategy for NPOM-dT-containing DNA. | ||
Results
Dose-dependent photocleavage of NPOM from DNA as monitored by UV-visible absorption spectroscopy
Photoconversion reactions often induce changes in the absorption spectra of the chemical groups of interest, which in turn can be used to track the reaction progress. To monitor the NPOM's photocleavage reaction, we obtained the UV-visible absorption spectra of the NPOM-modified DNA duplex (NPOM-DNA or AT2; see Table 1 for the DNA sequences used in the study) and dT nucleoside (NPOM-dT) after they were irradiated for varying time periods with photocleavage-inducing light (λ = 365 nm). The overall absorbance in the 300–500 nm range increased with increased irradiation time, with the absorption maximum (λmax) shifting from 365 nm to 395 nm (red-shift) for both samples, saturating after ∼2 min (Fig. 2 and Fig. S1, ESI†). The time courses by which the absorbance at 395 nm reached saturation were similar for NPOM-DNA and NPOM-dT, accompanied by a common ∼3-fold increase upon saturation (Fig. 2A and B). Unmodified DNA duplex did not show absorption in this wavelength range with or without irradiation (Fig. 2B). The strong absorbance at 395 nm after irradiation comes from the photocleavage reaction product, nitrosoacetophenone (Fig. 1).57 When the nitrosoacetophenone was removed from DNA using a size-exclusion purification (G25, MWCO ∼5 kDa), the absorption spectrum of the sample largely returned to that of the unmodified DNA (Fig. S1D, ESI†). Recently, studies using visible light for release of o-nitrobenzyl or nitropiperonyl photocaging groups in DNA or RNA have been reported.58–60 At the suggestion of a reviewer, we thus also tried 405 nm light as the light source and observed that it also induced efficient photocleavage of nitrosoacetophenone from the NPOM-containing substrates (Fig. S2, ESI†). Altogether, the results confirm the photo-induced cleavage of NPOM-DNA and indicate that the photocleavage reaction can be modulated by light doses.9 The photocleavage reaction may, in principle, be accelerated by using light of higher intensity and shorter time duration, as indicated previously.9,61 Although there have been multiple studies using NPOM as photoactivatable group that elicit various biological outcomes, this is the first time the photocleavage reaction progress was characterized in situ (through monitoring of the absorption spectra).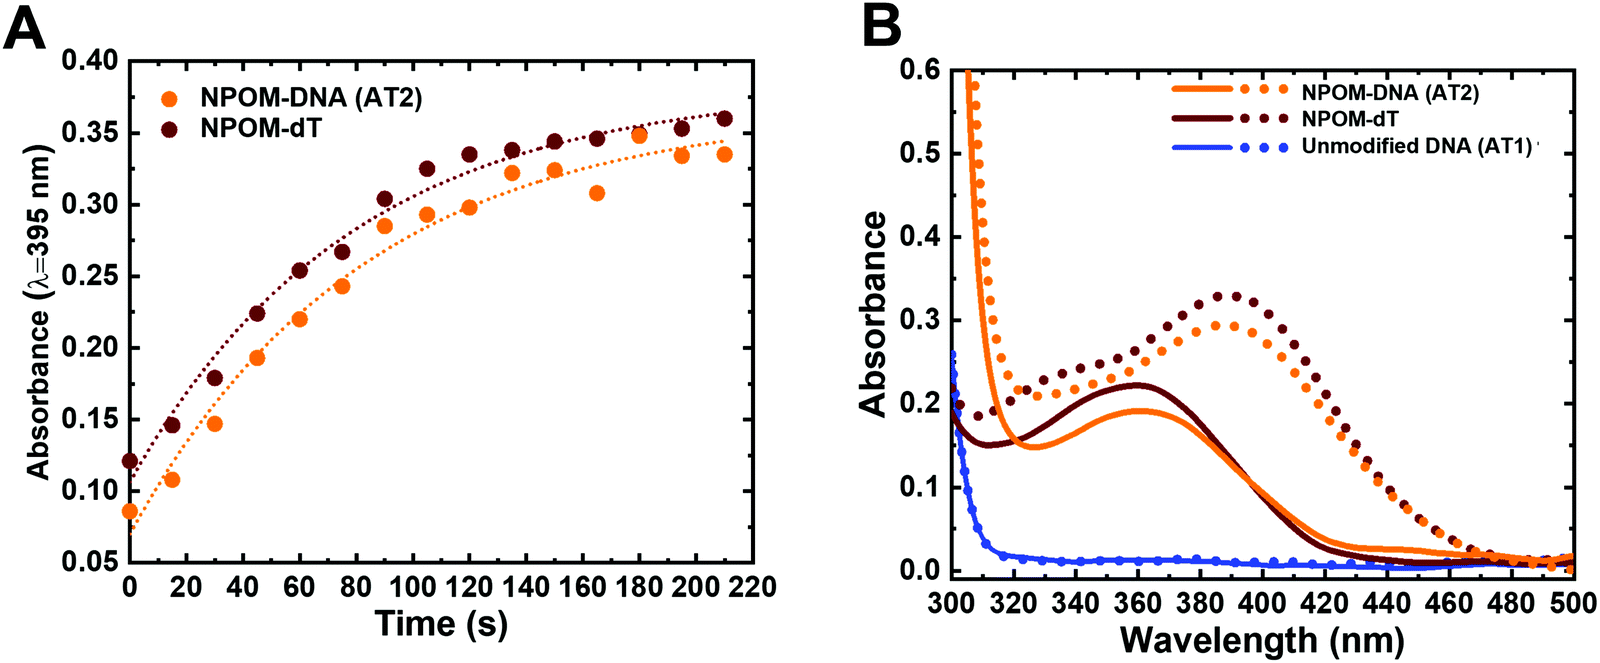 | ||
| Fig. 2 Dose-dependent photocleavage of NPOM from DNA as monitored in situ by UV-visible absorption spectroscopy. (A) Absorption at 395 nm versus time for NPOM-DNA (AT2, orange) and NPOM-dT nucleoside (brown). Dotted lines indicate single exponential fitting of the data (see also Fig. S1 and S2, ESI†). (B) Absorption spectra of NPOM-DNA (AT2, orange), NPOM-dT (brown), and unmodified DNA duplex (AT1, blue) before (solid line) and after 120 s of light irradiation (dotted line). | ||
NPOM lowers the thermal stability of DNA duplex which can be reversed by photocleavage
Several studies show that Rad4/XPC-binding and NER repair propensity for various lesions are positively correlated with the thermal destabilization induced by the lesion, which is reflected in part in the DNA melting temperatures.40,51,62 To see if thermal stability of DNA was impacted by the NPOM modification, we measured the melting temperatures (Tm) of the NPOM-DNA before and after photocleavage and compared them with that of the unmodified DNA. The Tm of NPOM-DNA (AT2, 45.2 °C) was ∼7 °C lower than that of the unmodified DNA (AT1, 52.0 °C) while the Tm of NPOM-DNA after photocleavage (2 min irradiation) was the same as that of the unmodified DNA (52.0 °C) (Table 1 and Fig. S3A, ESI†). These results showed that covalent NPOM adduct destabilized the DNA duplex but its photoremoval restored the DNA stability. The reaction products such as nitrosoacetophenone, though present in the reaction mix, did not affect the DNA thermal stability.Competitive electrophoretic mobility shift assays (EMSA) show that NPOM-DNA is specifically recognized by Rad4, which is abolished upon NPOM photocleavage
After observing that NPOM is a helix-destabilizing DNA adduct, we set out to examine if the adduct can indeed be recognized as a DNA lesion by Rad4/XPC, by using a competitive electrophoretic mobility shift assay (EMSA) as extensively used before (Fig. 3).40,41,43,47,50,51 In this assay, the binding of the protein to 5 nM 32P-labeled DNA substrate is monitored in the presence of 1000 nM unlabeled, undamaged ‘competitor’ DNA (CH7_NX). The NPOM-DNA (AT2) showed ∼15-fold lower apparent dissociation constant (Kd,app ∼ 48 nM) than the corresponding unmodified DNA (AT1) (Kd,app ∼ 701 nM). This specificity of NPOM-DNA (AT2) is even slightly higher than another specific model DNA substrate containing CCC/CCC mismatches (CH10_NX; Kd,app ∼ 79 nM), and is comparable to that of a bona fide NER lesion, 6-4 thymidine-thymidine photoproduct (6-4PP) (Kd,app ∼ 35 nM).40 On the other hand, the NPOM-DNA after photocleavage (AT2 + hν) showed Kd,app (∼744 nM) comparable to that of the unmodified DNA (AT1). These results show that the NPOM adduct in DNA is specifically recognized by Rad4/XPC as a lesion and that its photoremoval abolishes the specific binding. Additionally, when the protein and NPOM-DNA mixture was co-irradiated, the level of protein-bound NPOM-DNA progressively decreased with increasing irradiation time, consistent with the loss of specificity as NPOM is photo-cleaved from the DNA. This observation also confirms that the photoirradiation did not induce erratic protein-DNA crosslinks (Fig. S4, ESI†). These results therefore reveal the potential of NPOM adduct to be used as a new model DNA lesion system whose specificity can be controlled by light, for studying the mechanism of damage recognition by Rad4/XPC in NER.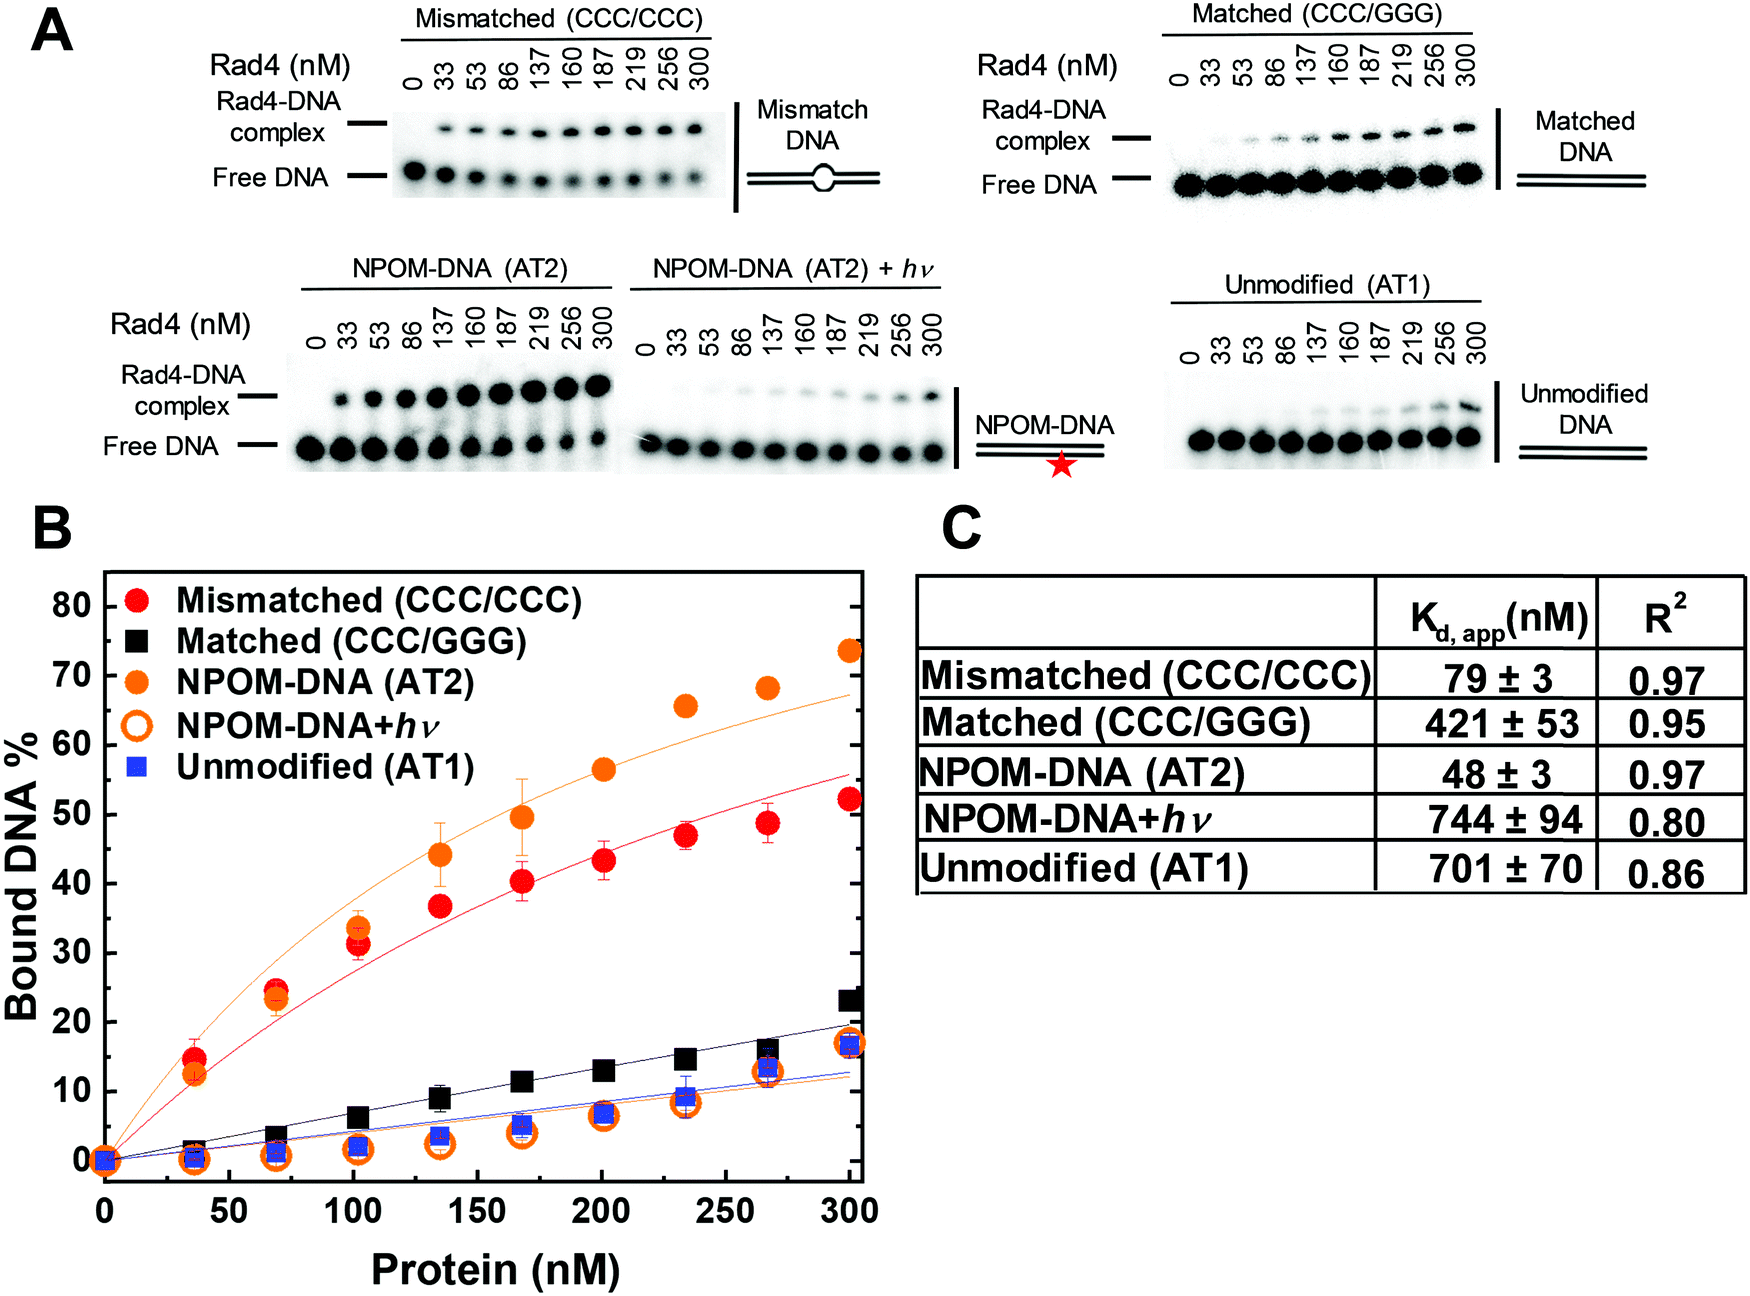 | ||
| Fig. 3 Apparent Rad4-binding affinities of DNA constructs measured by competition electrophoretic mobility shift assays (EMSA). (A) Typical gel images showing the wild-type Rad4–Rad23 complex binding to various DNA constructs. ‘NPOM-DNA + hν’ indicates NPOM-DNA photocleaved by λ = 365 nm light applied for 3 min. Mismatched (CCC/CCC) and matched (CCC/GGG) DNA represent typical specific and nonspecific binding substrates, respectively. The sequences of DNA are in Table S1 (ESI†). (B) Quantification of the Rad4-bound DNA fractions versus total concentrations of the protein from gels including those shown in (B). The symbols and error bars indicate the means and ranges as calculated by ± sample standard deviations, respectively, from triplicate experiments. Solid lines indicate the fit curves of the data point. (C) Kd,app and R2 of the fits derived from (B). The errors indicate the errors of the nonlinear regression fit. | ||
DNA conformation landscape mapped by fluorescence lifetime analyses of the tC°–tCnitro-labeled DNA shows NPOM-DNA becomes heterogeneously distorted upon binding to Rad4
Previously, we showed that fluorescence lifetime (FLT) analyses combined with a set of FRET probes, tC° and tCnitro, in DNA can be used to map the conformations of DNA in solution.43 The tC° and tCnitro are a FRET pair that serve as donor and acceptor, respectively.44,45 As cytosine analogs, these probes retain normal Watson–Crick pairing with guanines with minimal perturbation of DNA structure and stability.44,51 Furthermore, the rigid exocyclic ring and its base stacking interactions hold these nucleotide analogs in relatively fixed orientations within the DNA helical structure, making their FRET sensitive to subtle distortions in DNA helicity that alter the probes’ separation and/or relative orientation.63–65 For example, Rad4-induced untwisting and ‘opening’ of 3-bp mismatched DNA could be monitored by the FRET efficiency between tC° and tCnitro placed on either side of the mismatch.43,51 The FRET efficiency (E) relates directly to the lifetimes of the excited donor fluorophore, as where τDA and τD are the donor lifetimes in the presence and absence of the acceptor, respectively. The lifetime approach offers distinct advantages over other techniques such as single-molecule FRET and is a more robust way to obtain FRET efficiency than the intensity-based steady-state measurements.43,66 Here, we adopted our previous approach and incorporated the tC°–tCnitro FRET probes in the context of the NPOM-DNA construct (AT2) in the same positions relative to the lesion site as before (Table 1).43,51 As expected, tC°–tCnitro probes did not significantly alter the overall DNA duplex stability (as measured by Tm) of these constructs (Fig. S3B, ESI†).43,51 Next, the fluorescence decays of each sample were obtained (Fig. S5, ESI†) and analyzed using two different methods, discrete exponential (DE) and maximum entropy method (MEM), as before.43 Results from DE analyses are shown in Fig. S6, S7 and Table S1 (ESI†), and MEM results are detailed in Fig. S7, S8 and Table S2 (ESI†). Both analyses resulted in FLT components largely consistent with each other (Fig. S7, ESI†), as shown before.43 Our discussion below is primarily based on the results obtained from MEM.
First, for the unmodified DNA (AT10), the donor-only construct (AT10_D) showed a single major lifetime peak (τD) at 5.1 ns, which corresponds to the intrinsic lifetime of the donor fluorescence (since there is no acceptor and thus no FRET), consistent with previous results by us and the Wilhelmsson group (Fig. 4A and Fig. S7A, ESI†).43,50,67 In comparison, the DNA containing both the donor and acceptor (AT10_DA) showed a major lifetime peak (τDA) at 0.27 ns with 86% fractional population with minor peaks at 1.8 ns (7%) and 4.8 ns (7%) (Fig. 4A and Fig. S7B, Table S2, ESI†). The major lifetime peak of ∼0.3 ns corresponds to a FRET efficiency of ∼0.94, which closely matches the calculated FRET of 0.936 for an ideal B-DNA structure.43,67,68 The 4.8 ns lifetime is close to the intrinsic lifetime of the donor in the absence of the acceptor; however, this was not due to an excess of unannealed donor strand, as the same was observed even in the presence of 50% excess acceptor strand (Fig. S9, ESI†). These characteristics of AT10_DA agree well with those of other matched DNA duplexes we had previously examined and confirm that AT10 mainly adopts B-DNA conformation with perhaps a minor population of non-B-DNA conformations.43,50 Also, Rad4-binding to the DNA did not alter the FLT profile, as shown previously with other nonspecific DNA, indicating that nonspecific binding by Rad4 does not lead to detectable changes in tC°–tCnitro–based FRET (Fig. 4A and Fig. S7C, ESI†).
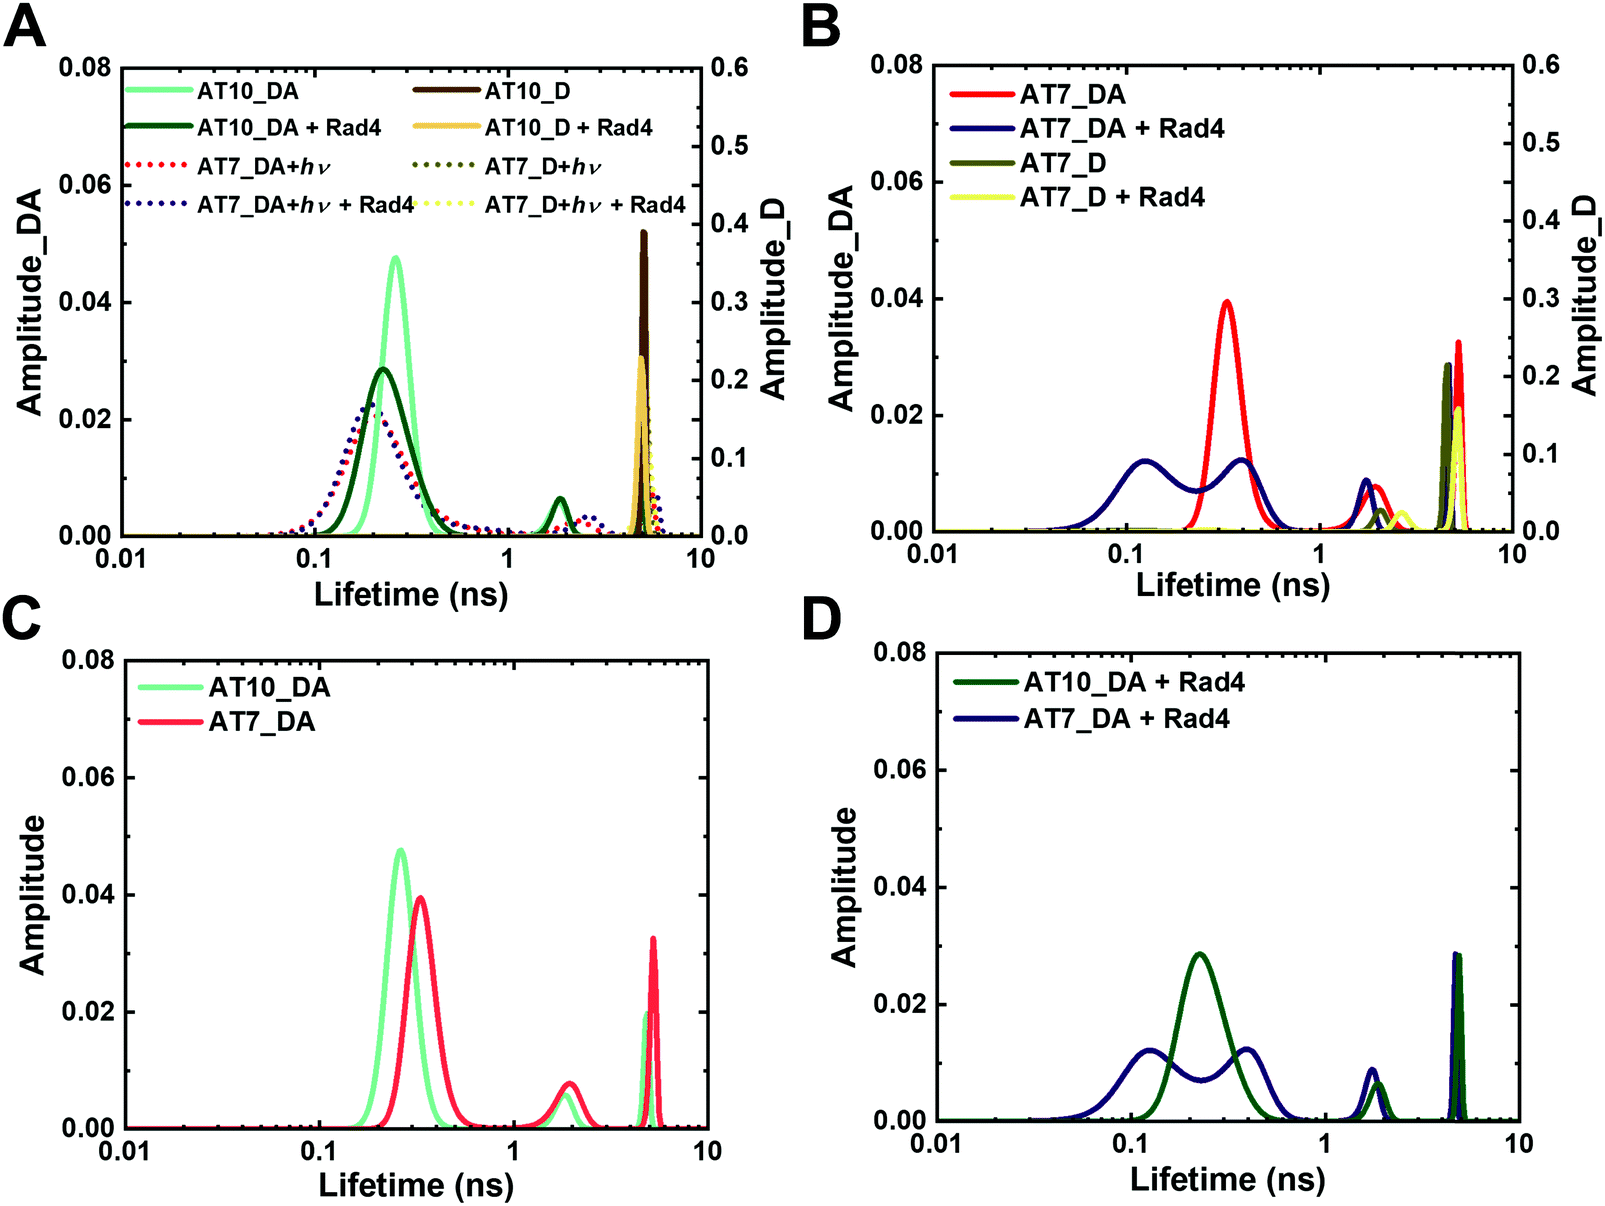 | ||
| Fig. 4 Fluorescence lifetime distributions obtained from MEM analyses for various tC°–tCnitro-labeled DNA and DNA–protein complexes. “_D” indicate DNA with donor only; “_DA” indicate DNA with donor/acceptor pair. (A) Unmodified DNA (AT10) in the absence and presence of Rad4 and its comparison with NPOM-DNA after 120 s of photocleavage reaction (AT7 + hν). (B) NPOM-modified DNA (AT7) in the absence and presence of Rad4. (C and D) Overlay of unmodified (AT10_DA) and NPOM-DNA (AT7_DA) without Rad4 (C) and in the presence of Rad4 (D) Reproducibility of MEM FLT distributions for each DA sample is shown in Fig. S8 (ESI†). Full reports of the lifetimes, fractional amplitudes, FRET efficiencies of each peak as well as the sample's average FRET efficiencies are in Table S2 (ESI†). | ||
In comparison to a single peak profile in the unmodified AT10_D, the donor-only NPOM-modified DNA (AT7_D) showed two peaks: one major peak with a lifetime of 4.5 ns, similar to the τD of AT10, but also a minor, 2.0 ns peak (Fig. 4B and Fig. S7D, ESI†). This additional 2.0 ns peak was present even for unannealed, single-stranded AT7_D, indicating that it is not sensitive to the DNA's conformation (Fig. S7J, ESI†), and it disappeared upon photocleavage, as seen for AT7_D irradiated for 120 s (AT7_D + hν), indicating an influence of NPOM on the tC° fluorescence (Fig. 4A and Fig. S7G, ESI†). However, despite this minor interference by NPOM on the tC° fluorescence, the donor–acceptor-labeled NPOM-DNA (AT7_DA) showed remarkable resemblance to that of the unmodified DNA (AT10_DA) with one major (0.31 ns (74%)) and two minor peaks (1.8 ns (13%) and 4.8 ns (13%)) (Fig. 4B, C and Fig. S7E, ESI†). The similarity between the two DNA constructs indicates that the conformations of NPOM-modified DNA as sensed by the tC°–tCnitro pair are largely unperturbed by the NPOM modification and most retain B-DNA-like conformation. Upon binding to Rad4, however, the FLT profile of AT7_DA changed distinctly compared with unbound DNA, unlike with AT10_DA (Fig. 4B, D and Fig. S7F, ESI†). Two broader and shorter lifetime peaks (0.16 ns (55%) and 0.39 ns (31%)) replaced the single major peak for unbound AT7_DA at ∼0.3 ns while the 1.7 ns and 4.7 ns peaks reduced to 8% and 6% in the fractional population, compared with DNA without Rad4. Such changes in the lifetime distribution translates to an increase in the average FRET efficiency from 0.78 to 0.87 upon Rad4 binding. A broader distribution of lifetimes with multiple peaks in AT7_DA indicated that NPOM-DNA, when specifically bound to Rad4, can access a broader range of distinct conformations with some that deviate from B-DNA. However, the FRET value of the Rad4-bound DNA increased compared with free DNA, in contrast to a decrease in FRET previously observed for Rad4-bound specific complexes, suggesting perhaps a different binding mode for this DNA than other specific substrates.41
Lastly, NPOM-DNA after photocleavage (AT7 + hν) showed profiles closely resembling that of the unmodified AT10 without or with Rad4, consistent with the expected photoconversion of NPOM-DNA to unmodified DNA (Fig. 4A and Fig. S7G–I, ESI†). The small differences in the peak positions and widths were due to the nitrosoacetophenone released after photocleavage, as such differences largely disappeared upon its removal using a G25 size-exclusion resin (Fig. S7K, ESI†). These results reaffirm that light-induced cleavage of the NPOM group from DNA abolishes the specific binding of Rad4 to the DNA while also revealing the unique conformational landscape of NPOM-DNA when it is specifically bound to Rad4.
:1) before irradiation but their ratios gradually increased with irradiation (2.8:1 at 60 s), eventually merging as a single peak with τ of ∼0.3 ns, closely resembling the non-specifically bound unmodified AT10_DA (Fig. S10J, ESI†). Interestingly, the same tendency was observed when the ratio between specific and nonspecific binding was altered by progressive change in DNA:protein ratios (Fig. 5B and Fig. S11, S12, ESI†). The FLT profiles after 30 s or 60 s irradiations resemble the profiles obtained when NPOM-DNA was bound to 2- or 3-fold molar excess of Rad4 (Fig. 5C and D). These results indicate that partial irradiation results in a mixture of specifically and nonspecifically bound complexes, as anticipated, yielding conformational distributions that are similar to when there is excess of protein and thus competition between specific and nonspecific binding.
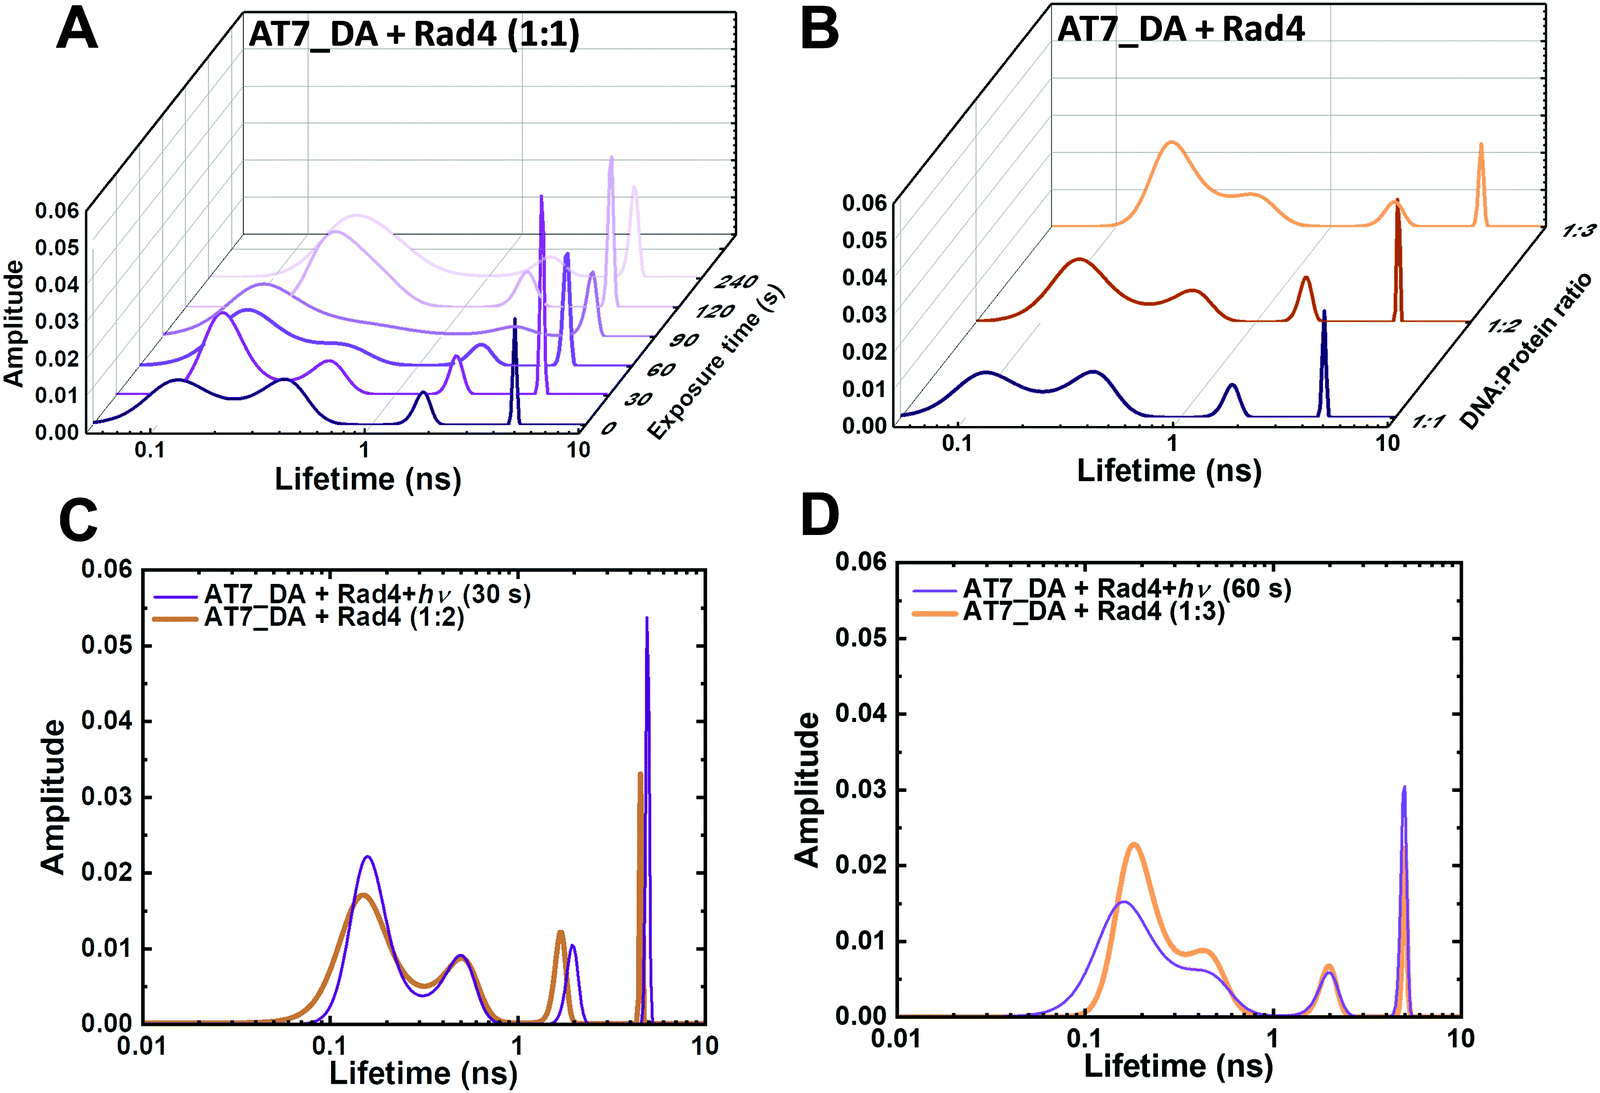 | ||
| Fig. 5 Light-induced conversion from specific to nonspecific Rad4–DNA complexes as tracked by FLT. (A) FLT distributions obtained from MEM analyses of Rad4-bound NPOM-DNA (AT7_DA) irradiated with varying photocleavage times (0–240 s). (B) FLT distributions of NPOM-DNA with varying DNA:Rad4 ratios. (C) Overlay of 30 s irradiation and 1:2 AT7_DA:Rad4 complex. (D) Overlay of 60 s irradiation and 1:3 AT7_DA:Rad4 complex. | ||
Conformational searches and MD simulations reveal two predominant major groove and one base-displaced intercalated conformations for the NPOM-modified DNA duplex
Our FLT-FRET study indicates that the NPOM-modified DNA retains a majority B-DNA conformation, at least as sensed by the tC° and tCnitro FRET probes in these constructs. To gain molecular insights into the FLT-FRET data and understand how the NPOM adduct may impact the DNA duplex structure, we turned to extensive all-atom molecular dynamics (MD) simulations on NPOM-modified DNA. As there is currently no structure available for the NPOM-adduct containing DNA, we first carried out extensive conformational searches to obtain initial models for MD simulations of NPOM-dT in B-DNA (Scheme 1). The search produced five geometry optimized rotamer combinations of NPOM-dT that could fit into the 13-mer B-DNA structure without causing extensive distortions to the duplex (Fig. S13, ESI†). Among these five conformations of NPOM-dT, there were four major groove conformations where NPOM adopted various orientations in the major groove with the dT in syn conformation (MJ1, MJ2, MJ3 and MJ4 in Fig. S14, ESI†), and one base-displaced intercalated conformation where NPOM-dT intercalated into the helix with the dT in anti conformation and its partner dA extruded into the major groove (INT in Fig. S14, ESI†). We carried out 1.5 μs MD simulations for each of these systems as well as an unmodified control duplex (Fig. S15, ESI†). Among our MD simulations of major groove conformations, one trajectory exhibited denaturing of the duplex and extensive distortions (MJ3 in Fig. S15A, ESI†) and hence was excluded from our further analyses of the structural ensembles.Our stable 1.5 μs MD simulations of major groove structures (trajectories MJ1, 2 and 4) for NPOM-dT converged to two predominant conformations: two rotamers around the long axis of the NPOM rings that placed the nitro group toward the major groove surface (MJ-I) or toward the solvent (MJ-II) (Fig. 6 and Fig. S15C, ESI†). These two conformations were observed in all three stable MD trajectories with varying proportions in each population (Fig. 6A); they were able to flexibly interchange through different combinations of rotations around the dihedral angles between the NPOM rings and the modified dT (Fig. 6 and Fig. S16, ESI†). Of the combined trajectories, 66% adopted either of these two major groove conformations. In the major groove conformation with the nitro group facing the major groove surface (MJ-I; 31% of the population), the NPOM rings were oriented along the helix axis on the major groove surface with the five-atom ring pointing toward the 5′ end of the lesion-containing strand, and its partner dA extruded moderately toward the major groove. With the nitro group facing the solvent (MJ-II; 35% of the population), the NPOM rings were oriented along the base pair planes with the five-atom ring pointing toward its partner dA, protecting the dA from solvent. The remaining 34% of the major groove population were transients that occurred during the transition between the two predominant interchanging rotamers.
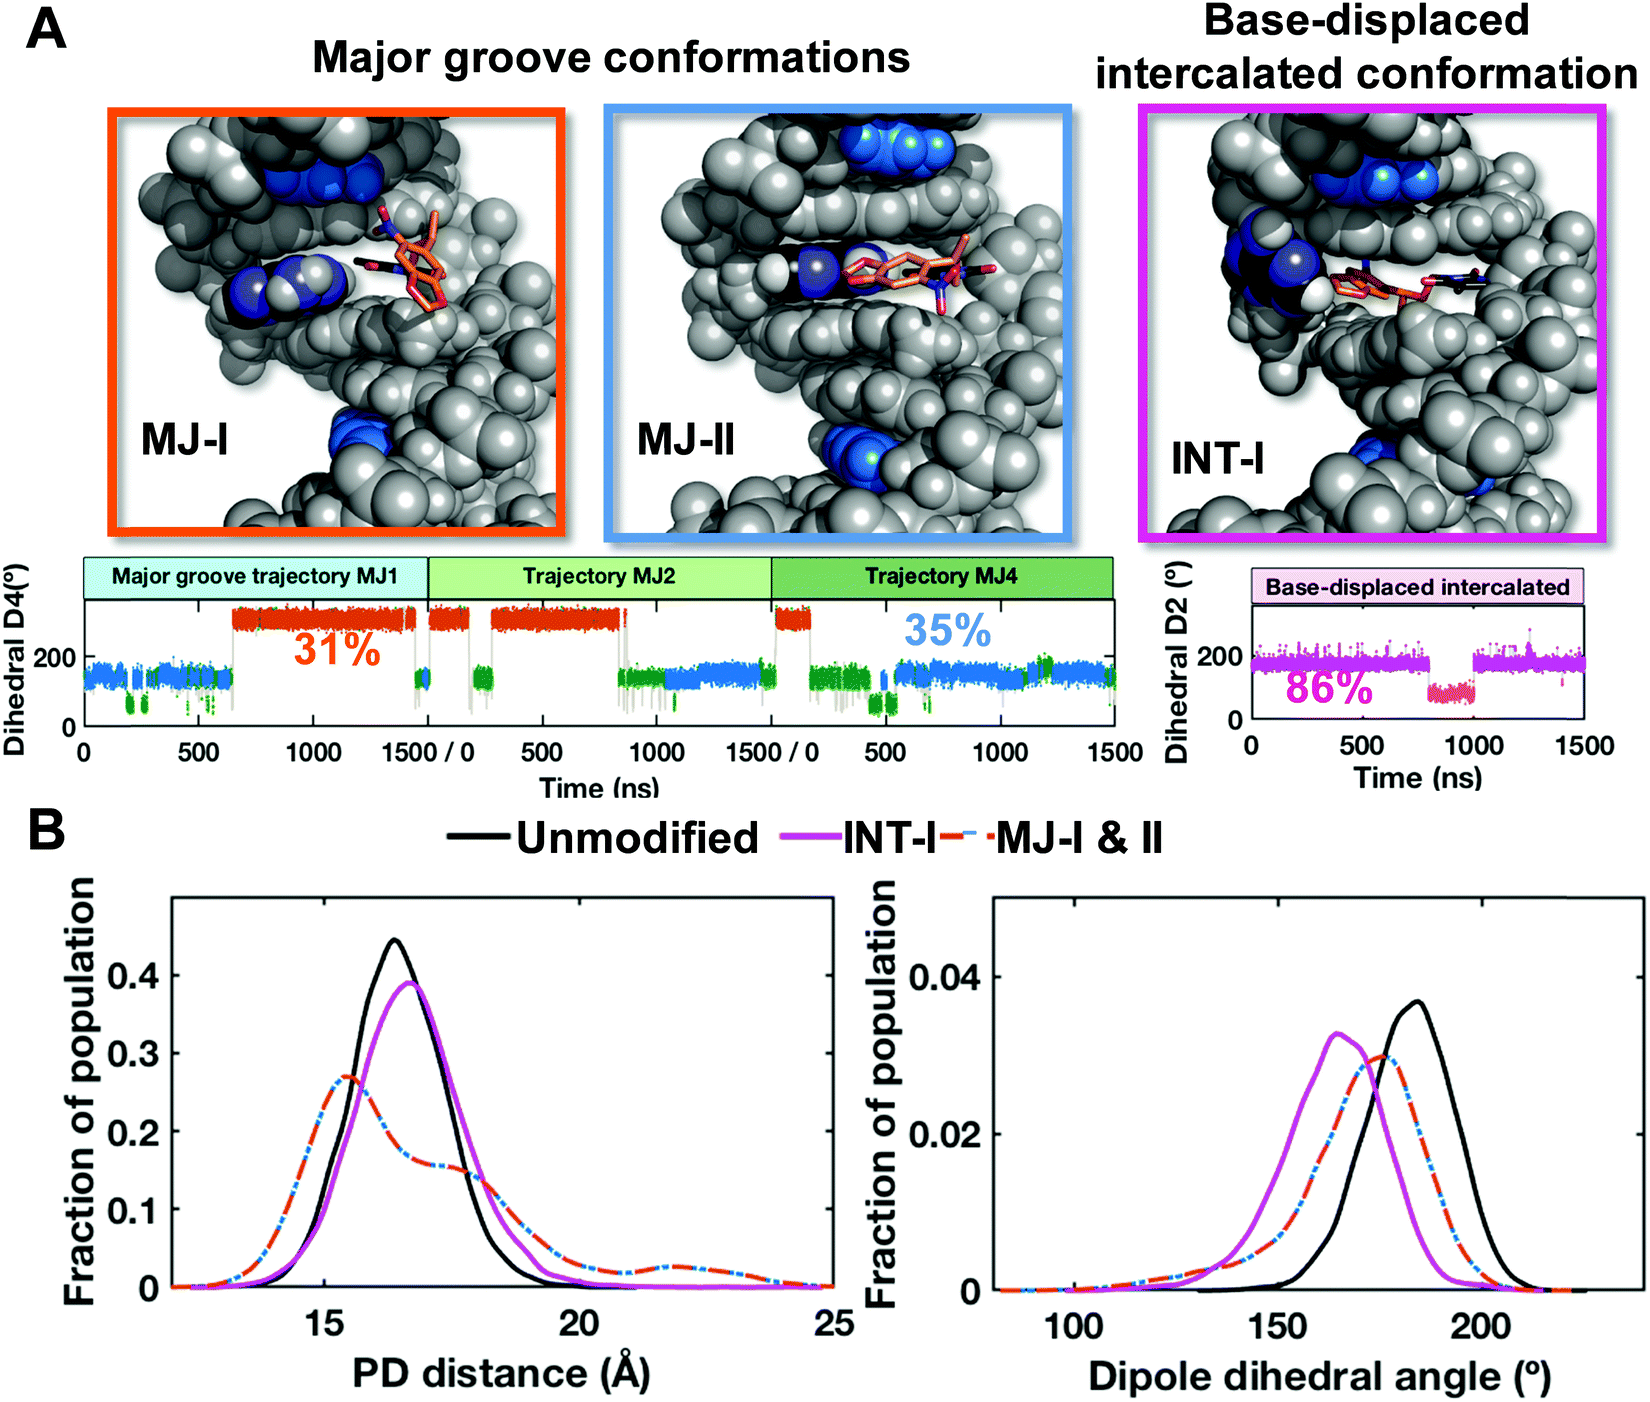 | ||
| Fig. 6 NPOM-containing DNA structures obtained from stable MD derived ensembles. (A) Best representative structures for the two major groove (MJ-I and MJ-II) and one base-displaced intercalated (INT-I) conformations. The NPOM-dT dihedral angles (Fig. S16, ESI†) that determine these different conformations are shown for each conformational family (major groove and intercalated) with each conformational cluster color-coded and labeled with its percentage of population. The conformers MJ-I (orange) and MJ-II (blue) are derived from three trajectories (MJ1, 2 and 4). Transient conformational clusters in the major groove ensembles are colored green. These structures are shown in cartoon in Fig. S15 (ESI†). (B) The distributions of the modeled FRET pair distances (PD distance) and dipole dihedral angles for the major groove and base-displaced intercalated NPOM-dT-containing DNA and unmodified DNA. The definitions for the PD distance and dipole dihedral angle are given in Fig. S17 (ESI†). The major groove values are for the two dominant major groove conformations (MJ-I 31% and MJ-II 35%, 66% of the population), and the base-displaced intercalated values are for the stable intercalated conformation (INT-I, 86% of the population). | ||
For the base-displaced intercalated NPOM-dT, the trajectory remained structurally stable, with the NPOM rings intercalated into the DNA helix stacked with neighboring base pairs; the partner dA was flipped into the major groove and protects the NPOM from the solvent (INT-I; Fig. 6 and Fig. S15C, S16, ESI†). This intercalated conformation comprised 86% of this base-displaced intercalated conformational family. The remaining 14% represented one brief excursion during the MD simulation where the NPOM rings were folded back to stack with dT and stretched the base pair steps (INT-II; Fig. S16, ESI†).
To gain insight on the experimental FLT-FRET data, the two major groove conformations, the intercalated conformation and the unmodified duplex were further analyzed. We modeled the tC°–tCnitro FRET pairs at the respective nucleotide positions and calculated their distances and dihedral angles between the dipoles (detailed in ESI,† Methods). The distances were measured between the center of mass for the middle ring of each fluorophore model (Fig. S17A, ESI†). The dipole dihedral angles were calculated between the modeled dipoles of the FRET pair (Fig. S17B, ESI†). The distance between the FRET pairs was very similar in all conformations of the NPOM-dT-containing DNA and the unmodified DNA: 16.8 ± 1.8 Å for the major groove conformations, averaged for the two rotamers, 16.7 ± 0.3 Å for the intercalated one, and 16.5 ± 0.1 Å for the unmodified DNA (Fig. 6B). While the dipole dihedral angles showed slight differences between the NPOM-dT-containing DNA and the unmodified DNA, the major groove conformations averaged for the two rotamers had a value of 170 ± 11° which was close to the unmodified DNA of 182 ± 2°. However, the intercalated conformation was further from the unmodified duplex with a value of 164 ± 5° (Fig. 6B). The FRET efficiencies based on the modeled FRET pairs were ∼0.96–0.98 for the best representative structures of these conformers, not far away from the value expected of ideal B-DNA (0.936) and consistent with the FLT experimental results. The major groove conformations also were close to the unmodified DNA in that the Watson–Crick hydrogen bonding was retained at 97–99% occupancy at the two base pairs on each side of the NPOM-dT; however, the syn conformation of the NPOM-dT precluded any Watson–Crick base pairing. Hence the distortions induced by the NPOM are very local for the major groove case. On the other hand, the base-displaced intercalated conformation was somewhat more distorted. In addition to the absence of Watson–Crick pairing at the NPOM-dT site, the A:T base pair on the 5′ side of the NPOM-dT showed reduced Watson–Crick hydrogen bond occupancies of 81% (N6–H61⋯O4) and 85% (N3–H3⋯N1), although the other hydrogen bonds of adjacent base pairs all retained occupancies of 97–99%.
These MD simulations provide atomistic models for the NPOM-DNA and insights into their structural dynamics. While the major groove lesion-containing DNA structures were similar to the unmodified DNA, they also exhibited local lesion conformational dynamics (Fig. 6A) that may be relevant to the recognition of the NPOM adduct by Rad4 (see Discussion).
Discussion
Though a variety of photoconvertible DNA/RNA have been shown to modulate DNA/RNA structures and functions, their applications for DNA repair mechanisms have been relatively few. Such chemistry has been used for inducing site-specific, single or double strand breaks in DNA69–71 and for triggering structural transition in a base excision repair enzyme to study its mechanism.42 NPOM-DNA was also reported to bind to AlkB, a bacterial direct DNA/RNA repair enzyme that acts on alkylated base damage.72 NPOM-related, 2-nitrobenzyl or 2-(2-nitrophenyl)propyl groups have also been shown to mask the recognition of a single nucleotide bulge typically recognized by the mismatch repair protein MutS, which photo-irradiation could restore.73Nucleotide excision repair (NER) is unique among DNA repair mechanisms in that it repairs an extraordinarily wide range of DNA lesions caused by various environmental and endogenous agents, including intra-strand crosslinks and bulky adduct lesions. A key to its versatility lies in its initial damage sensor protein, Rad4/XPC, that can indirectly detect local thermodynamic destabilization induced by DNA damage without making direct contacts with the lesions themselves. Here in this study, we show for the first time that a photoconvertible modification on DNA can be recognized by Rad4 with specificity similar to that for a bona fide lesion (such as the 6-4 photoproduct induced by UV) and that its specific binding can be abolished upon photocleavage of the NPOM-adduct in a light-dose-dependent manner. We also provide, for the first time, valuable structural characterization of the NPOM-modified DNA duplex using FLT-FRET analyses and extensive MD simulations.
Notably, the FLT-FRET studies revealed that NPOM-DNA does not entail a large deviation from the canonical B-DNA form and its specific binding to Rad4 results in an increase in the average FRET. This is in contrast to a previously studied CCC/CCC mismatched DNA which also binds to Rad4/XPC with high specificity. CCC/CCC mismatched DNA, when labeled with tC°–tCnitro FRET probes in analogous positions, showed a broad heterogeneous distributions of fluorescence lifetimes that significantly deviated from B-DNA towards longer lifetime, thus decrease in average FRET.43 Furthermore, its specific binding to Rad4 further decreased the average FRET, a direction of change in line with expected FRET changes based on the known DNA conformation in the ‘open’ crystal structure.43,50 These results indicate an intriguing possibility that the conformation of NPOM-DNA when specifically bound to Rad4 may be different from those of CCC/CCC or other DNA lesions that form the ‘open’ conformation.
Our subsequent atomistic structures obtained by MD simulation provide novel insights into how NPOM may be recognized by Rad4/XPC as a lesion. The existence of the two nitro group conformations in the major groove is interesting in relation to the recognition by Rad4: the electronegative nitro group, when facing the solvent, may favorably interact with positively charged Arg and Lys amino acids in the DNA binding surface of Rad4 to foster Rad4 binding to a major-groove NPOM conformer. The base-displaced intercalated conformer has a smaller FRET dipole dihedral angle, with somewhat more distorted Watson–Crick pairing, than our unmodified control or the major groove conformers (Fig. 6). This smaller dihedral angle is associated with the well-known intercalation-induced untwisting.74,75 In comparison, untwisting, reflected in the dipole dihedral angles, is more modest in the major groove conformers. Base-displaced intercalated conformers have been shown to facilitate Rad4 recognition in computational and experimental work.76,77 Computational studies have revealed that the displaced partner base in the case of the NER-proficient (+) cis-benzo[a]pyrene-dG adduct is readily captured by a pocket between BHD2 and BHD3 while the BHD2 hairpin binds into the minor groove and untwists the duplex; in contrast, these structural hallmarks of initial lesion recognition by Rad4 are missing when the partner nucleotide is absent, in which case the lesion becomes NER-resistant.77 Different conformers of 2-(acetyl)aminofluorene-dG lesions have also been shown to play a role in their recognition and repair by NER.78,79 While it is difficult to ascertain which conformation is prevalent in solution here for NPOM-DNA, base-displaced intercalated conformers can be preferentially represented in specific sequence contexts while being in equilibrium with major groove conformers.80–82 Further structural studies are needed to reveal the impact of different NPOM-DNA conformations on the recognition by Rad4/XPC and the NER repair.
Overall, our study sets the stage for future studies in which optical triggering can be coupled with a variety of other techniques (e.g., fluorescence conformational dynamics spectroscopy, time-resolved X-ray crystallography, cellular repair kinetic studies, etc.). For instance, NPOM-DNA could be used in monitoring the reverse reaction of the lesion recognition process, using time-resolved crystallography to potentially provide molecular insights into the intermediate steps en route to damage recognition. The light-triggered unbinding reaction could also be useful in studying the biochemical processes of NER in vitro and in vivo, for instance, to probe the timing and structural mechanisms of TFIIH recruitment and lesion verification, albeit in the reverse direction. The large body of literature on protein folding studies shows how deep insights were gained about the folding mechanisms by triggering and monitoring the unfolding of a protein from a folded state. Similarly, triggering an unbinding reaction can provide meaningful insights into the free energy barriers and bottlenecks relevant for the binding reaction; these should be intriguing problems to investigate for the critical steps in biological pathways such as NER in vitro and in vivo.
Funding
This work was funded by National Science Foundation (NSF) grants (MCB-1412692 to J.-H. M and MCB-1715649 to A. A.), National Institutes of Health grants (R21-ES028384 to J.-H. M, R01-ES025987 to S. B.), and Baylor University. This work used the Extreme Science and Engineering Discovery Environment (XSEDE), which is supported by National Science Foundation (NSF) Grant MCB-060037 to S. B., and the high-performance computing resources of New York University (NYU-ITS).Conflicts of interest
There are no conflicts to declare.Acknowledgements
We thank the members of the Min, Broyde, and Ansari groups.References
- B. I. Greene, R. M. Hochstrasser, R. B. Weisman and W. A. Eaton, Proc. Natl. Acad. Sci. U. S. A., 1978, 75, 5255–5259 CrossRef CAS.
- J. Hofrichter, J. H. Sommer, E. R. Henry and W. A. Eaton, Proc. Natl. Acad. Sci. U. S. A., 1983, 80, 2235–2239 CrossRef CAS.
- D. Bleger and S. Hecht, Angew. Chem., Int. Ed., 2015, 54, 11338–11349 CrossRef CAS.
- P. Klan, T. Solomek, C. G. Bochet, A. Blanc, R. Givens, M. Rubina, V. Popik, A. Kostikov and J. Wirz, Chem. Rev., 2013, 113, 119–191 CrossRef CAS.
- E. R. Ballister, C. Aonbangkhen, A. M. Mayo, M. A. Lampson and D. M. Chenoweth, Nat. Commun., 2014, 5, 5475 CrossRef.
- M. J. Hansen, F. M. Feringa, P. Kobauri, W. Szymanski, R. H. Medema and B. L. Feringa, J. Am. Chem. Soc., 2018, 140, 13136–13141 CrossRef CAS.
- J. Schimer, M. Pavova, M. Anders, P. Pachl, P. Sacha, P. Cigler, J. Weber, P. Majer, P. Rezacova, H. G. Krausslich, B. Muller and J. Konvalinka, Nat. Commun., 2015, 6, 6461 CrossRef CAS.
- G. Xue, K. Wang, D. Zhou, H. Zhong and Z. Pan, J. Am. Chem. Soc., 2019, 141, 18370–18374 CrossRef CAS.
- Y. Liu, R. S. Zou, S. He, Y. Nihongaki, X. Li, S. Razavi, B. Wu and T. Ha, Science, 2020, 368, 1265 CrossRef CAS.
- R. Gostl, A. Senf and S. Hecht, Chem. Soc. Rev., 2014, 43, 1982–1996 RSC.
- N. N. Mafy, K. Matsuo, S. Hiruma, R. Uehara and N. Tamaoki, J. Am. Chem. Soc., 2020, 142, 1763–1767 CrossRef CAS.
- R. A. Meldrum, S. Shall and C. W. Wharton, Biochem. J., 1990, 266, 891–895 CAS.
- Q. Liu and A. Deiters, Acc. Chem. Res., 2014, 47, 45–55 CrossRef CAS.
- T. J. Measey and F. Gai, Langmuir, 2012, 28, 12588–12592 CrossRef CAS.
- P. J. Salveson, S. Haerianardakani, A. Thuy-Boun, A. G. Kreutzer and J. S. Nowick, J. Am. Chem. Soc., 2018, 140, 5842–5852 CrossRef CAS.
- T. M. Courtney and A. Deiters, Nat. Commun., 2019, 10, 4384 CrossRef.
- G. M. Grotenbreg, N. R. Roan, E. Guillen, R. Meijers, J. H. Wang, G. W. Bell, M. N. Starnbach and H. L. Ploegh, Proc. Natl. Acad. Sci. U. S. A., 2008, 105, 3831–3836 CrossRef CAS.
- J. Hemphill, E. K. Borchardt, K. Brown, A. Asokan and A. Deiters, J. Am. Chem. Soc., 2015, 137, 5642–5645 CrossRef CAS.
- J. Hemphill, C. Chou, J. W. Chin and A. Deiters, J. Am. Chem. Soc., 2013, 135, 13433–13439 CrossRef CAS.
- H. Lusic, D. D. Young, M. O. Lively and A. Deiters, Org. Lett., 2007, 9, 1903–1906 CrossRef CAS.
- A. Deiters and H. Lusic, Synthesis, 2006, 2147–2150 CrossRef.
- R. S. Givens and J.-I. Lee, J. Photosci., 2003, 10, 37–48 CAS.
- J. Luo, J. Torres-Kolbus, J. Liu and A. Deiters, ChemBioChem, 2017, 18, 1442–1447 CrossRef CAS.
- A. S. Stroppel, M. Paolillo, T. Ziegler, R. Feil and T. Stafforst, ChemBioChem, 2018, 19, 1312–1318 CrossRef CAS.
- A. Hanswillemenke, T. Kuzdere, P. Vogel, G. Jekely and T. Stafforst, J. Am. Chem. Soc., 2015, 137, 15875–15881 CrossRef CAS.
- J. Hemphill, Q. Liu, R. Uprety, S. Samanta, M. Tsang, R. L. Juliano and A. Deiters, J. Am. Chem. Soc., 2015, 137, 3656–3662 CrossRef CAS.
- P. Berroy, M. L. Viriot and M. C. Carré, Sens. Actuators, B, 2001, 74, 186–189 CrossRef CAS.
- D. D. Young and A. Deiters, Bioorg. Med. Chem. Lett., 2006, 16, 2658–2661 CrossRef CAS.
- D. D. Young, M. O. Lively and A. Deiters, J. Am. Chem. Soc., 2010, 132, 6183–6193 CrossRef CAS.
- A. Deiters, R. A. Garner, H. Lusic, J. M. Govan, M. Dush, N. M. Nascone-Yoder and J. A. Yoder, J. Am. Chem. Soc., 2010, 132, 15644–15650 CrossRef CAS.
- D. D. Young, J. M. Govan, M. O. Lively and A. Deiters, ChemBioChem, 2009, 10, 1612–1616 CrossRef CAS.
- J. M. Govan, R. Uprety, J. Hemphill, M. O. Lively and A. Deiters, ACS Chem. Biol., 2012, 7, 1247–1256 CrossRef CAS.
- D. D. Young, W. F. Edwards, H. Lusic, M. O. Lively and A. Deiters, Chem. Commun., 2008, 462–464, 10.1039/b715152g.
- E. V. Moroz-Omori, D. Satyapertiwi, M.-C. Ramel, H. Høgset, I. K. Sunyovszki, Z. Liu, J. P. Wojciechowski, Y. Zhang, C. L. Grigsby, L. Brito, L. Bugeon, M. J. Dallman and M. M. Stevens, ACS Cent. Sci., 2020, 6, 695–703 CrossRef CAS.
- W. Zhou, W. Brown, A. Bardhan, M. Delaney, A. S. Ilk, R. R. Rauen, S. I. Kahn, M. Tsang and A. Deiters, Angew. Chem., Int. Ed., 2020, 59, 8998–9003 CrossRef CAS.
- L. C. Gillet and O. D. Scharer, Chem. Rev., 2006, 106, 253–276 CrossRef CAS.
- J. A. Marteijn, H. Lans, W. Vermeulen and J. H. Hoeijmakers, Nat. Rev. Mol. Cell Biol., 2014, 15, 465–481 CrossRef CAS.
- M. R. Puumalainen, P. Ruthemann, J. H. Min and H. Naegeli, Cell. Mol. Life Sci., 2016, 73, 547–566 CrossRef CAS.
- K. H. Kraemer, N. J. Patronas, R. Schiffmann, B. P. Brooks, D. Tamura and J. J. DiGiovanna, Neuroscience, 2007, 145, 1388–1396 CrossRef CAS.
- D. Paul, H. Mu, H. Zhao, O. Ouerfelli, P. D. Jeffrey, S. Broyde and J. H. Min, Nucleic Acids Res., 2019, 47, 6015–6028 CrossRef CAS.
- J. H. Min and N. P. Pavletich, Nature, 2007, 449, 570–575 CrossRef CAS.
- S. Lee, C. T. Radom and G. L. Verdine, J. Am. Chem. Soc., 2008, 130, 7784–7785 CrossRef CAS.
- S. Chakraborty, P. J. Steinbach, D. Paul, H. Mu, S. Broyde, J. H. Min and A. Ansari, Nucleic Acids Res., 2018, 46, 1240–1255 CrossRef CAS.
- K. Borjesson, S. Preus, A. H. El-Sagheer, T. Brown, B. Albinsson and L. M. Wilhelmsson, J. Am. Chem. Soc., 2009, 131, 4288–4293 CrossRef.
- S. Preus, K. Borjesson, K. Kilsa, B. Albinsson and L. M. Wilhelmsson, J. Phys. Chem. B, 2010, 114, 1050–1056 CrossRef CAS.
- B. Dumat, A. F. Larsen and L. M. Wilhelmsson, Nucleic Acids Res., 2016, 44, e101 CrossRef.
- X. Chen, Y. Velmurugu, G. Zheng, B. Park, Y. Shim, Y. Kim, L. Liu, B. Van Houten, C. He, A. Ansari and J. H. Min, Nat. Commun., 2015, 6, 5849 CrossRef.
- R. E. Cuellar, G. A. Ford, W. R. Briggs and W. F. Thompson, Proc. Natl. Acad. Sci. U. S. A., 1978, 75, 6026–6030 CrossRef CAS.
- R. Palais and C. T. Wittwer, Computer Methods, Part A, Academic Press, 2009, vol. 454, pp. 323–343 Search PubMed.
- D. Paul, H. Mu, A. Tavakoli, Q. Dai, X. Chen, S. Chakraborty, C. He, A. Ansari, S. Broyde and J.-H. Min, Nucleic Acids Res., 2020, 48, 12348–12364 CrossRef.
- Y. Velmurugu, X. Chen, P. Slogoff Sevilla, J. H. Min and A. Ansari, Proc. Natl. Acad. Sci. U. S. A., 2016, 113, E2296–2305 CrossRef CAS.
- A. K. Livesey and J. C. Brochon, Biophys. J., 1987, 52, 693–706 CrossRef CAS.
- P. J. Steinbach, Anal. Biochem., 2012, 427, 102–105 CrossRef CAS.
- P. J. Steinbach, R. Ionescu and C. R. Matthews, Biophys. J., 2002, 82, 2244–2255 CrossRef CAS.
- M. J. Frisch, G. W. Trucks, H. B. Schlegel, G. E. Scuseria, M. A. Robb, J. R. Cheeseman, G. Scalmani, V. Barone, G. A. Petersson, H. Nakatsuji, X. Li, M. Caricato, A. Marenich, J. Bloino, B. G. Janesko, R. Gomperts, B. Mennucci, H. P. Hratchian, J. V. Ortiz, A. F. Izmaylov, J. L. Sonnenberg, D. Williams-Young, F. Ding, F. Lipparini, F. Egidi, J. Goings, B. Peng, A. Petrone, T. Henderson, D. Ranasinghe, V. G. Zakrzewski, J. Gao, N. Rega, G. Zheng, W. Liang, M. Hada, M. Ehara, K. Toyota, R. Fukuda, J. Hasegawa, M. Ishida, T. Nakajima, Y. Honda, O. Kitao, H. Nakai, T. Vreven, K. Throssell, J. A. J. Montgomery, J. E. Peralta, F. Ogliaro, M. Bearpark, J. J. Heyd, E. Brothers, K. N. Kudin, V. N. Staroverov, T. Keith, R. Kobayashi, J. Normand, K. Raghavachari, A. Rendell, J. C. Burant, S. S. Iyengar, J. Tomasi, M. Cossi, J. M. Millam, M. Klene, C. Adamo, R. Cammi, J. W. Ochterski, R. L. Martin, K. Morokuma, O. Farkas, J. B. Foresman and D. J. Fox, Gaussian 09 Revision E.01, Gaussian Inc., Wallingford CT, 2016 Search PubMed.
- D. A. Case, I. Y. Ben-Shalom, S. R. Beozell, D. S. Cerutti, I. Cheatham, T.E., V. W. D. Cruzeiro, T. A. Darden, R. E. Duke, D. Ghoreishi, M. K. Gilson, H. Gohlke, A. W. Goetz, D. Greene, R. Harris, N. Homeyer, Y. Huang, S. Izadi, A. Kovalenko, T. Kurtzman, T. S. Lee, S. LeGrand, P. Li, C. Lin, J. Liu, T. Luchko, R. Luo, D. J. Mermelstein, K. M. Merz, Y. Miao, G. Monard, C. Nguyen, H. Nguyen, I. Omelyan, A. Onufriev, F. Pan, R. Qi, D. R. Roe, A. Roitberg, C. Sagui, S. Schott-Verdugo, J. Shen, C. L. Simmerling, J. Smith, R. Salomon-Ferrer, J. Swails, R. C. Walker, J. Wang, H. Wei, R. M. Wolf, X. Wu, L. Xiao and D. M. York, AMBER 2018, University of California, San Francisco: CA, 2018 Search PubMed.
- G. H. McGall, A. D. Barone, M. Diggelmann, S. P. A. Fodor, E. Gentalen and N. Ngo, J. Am. Chem. Soc., 1997, 119, 5081–5090 CrossRef CAS.
- S. Boháčová, Z. Vaníková, L. Poštová Slavětínská and M. Hocek, Org. Biomol. Chem., 2018, 16, 5427–5432 RSC.
- A. Ovcharenko, F. P. Weissenboeck and A. Rentmeister, Angew. Chem., Int. Ed., 2020 DOI:10.1002/anie.202013936.
- Z. Vaníková, M. Janoušková, M. Kambová, L. Krásný and M. Hocek, Chem. Sci., 2019, 10, 3937–3942 RSC.
- M. Liu, S. Jiang, O. Loza, N. E. Fahmi, P. Sulc and N. Stephanopoulos, Angew. Chem., Int. Ed., 2018, 57, 9341–9345 CrossRef CAS.
- O. D. Scharer, Cold Spring Harbor Perspect. Biol., 2013, 5, a012609 Search PubMed.
- Y. Shi, A. Dierckx, P. H. Wanrooij, S. Wanrooij, N. G. Larsson, L. M. Wilhelmsson, M. Falkenberg and C. M. Gustafsson, Proc. Natl. Acad. Sci. U. S. A., 2012, 109, 16510–16515 CrossRef CAS.
- S. Xia, M. Wood, M. J. Bradley, E. M. De La Cruz and W. H. Konigsberg, Nucleic Acids Res., 2013, 41, 9077–9089 CrossRef CAS.
- V. Posse, E. Hoberg, A. Dierckx, S. Shahzad, C. Koolmeister, N. G. Larsson, L. M. Wilhelmsson, B. M. Hallberg and C. M. Gustafsson, Nucleic Acids Res., 2014, 42, 3638–3647 CrossRef CAS.
- D. Klostermeier and D. P. Millar, Biopolymers, 2001, 61, 159–179 CrossRef.
- P. Sandin, K. Borjesson, H. Li, J. Martensson, T. Brown, L. M. Wilhelmsson and B. Albinsson, Nucleic Acids Res., 2008, 36, 157–167 CrossRef CAS.
- S. Preus, K. Kilsa, F. A. Miannay, B. Albinsson and L. M. Wilhelmsson, Nucleic Acids Res., 2013, 41, e18 CrossRef CAS.
- A. Dussy, C. Meyer, E. Quennet, T. A. Bickle, B. Giese and A. Marx, ChemBioChem, 2002, 3, 54–60 CrossRef CAS.
- P. Ordoukhanian and J. S. Taylor, Bioconjugate Chem., 2000, 11, 94–103 CrossRef CAS.
- K. Zhang and J. S. Taylor, Biochemistry, 2001, 40, 153–159 CrossRef CAS.
- C. Yi and C. He, Sci. China: Chem., 2009, 53, 86–90 CrossRef.
- K. Seio, Y. Ohno, K. Ohno, L. Takeshita, T. Kanamori, Y. Masaki and M. Sekine, Bioorg. Med. Chem. Lett., 2016, 26, 4861–4863 CrossRef CAS.
- S. C. Jain and H. M. Sobell, J. Biomol. Struct. Dyn., 1984, 1, 1179–1194 CrossRef CAS.
- J. Dikic and R. Seidel, Biophys. J., 2019, 116, 1394–1405 CrossRef CAS.
- H. Mu, Y. Zhang, N. E. Geacintov and S. Broyde, Chem. Res. Toxicol., 2018, 31, 1260–1268 Search PubMed.
- H. Mu, N. E. Geacintov, J. H. Min, Y. Zhang and S. Broyde, Chem. Res. Toxicol., 2017, 30, 1344–1354 Search PubMed.
- J. E. Yeo, A. Khoo, A. F. Fagbemi and O. D. Scharer, Chem. Res. Toxicol., 2012, 25, 2462–2468 Search PubMed.
- V. Jain, B. Hilton, S. Patnaik, Y. Zou, M. P. Chiarelli and B. P. Cho, Nucleic Acids Res., 2012, 40, 3939–3951 CrossRef CAS.
- V. Jain, V. G. Vaidyanathan, S. Patnaik, S. Gopal and B. P. Cho, Biochemistry, 2014, 53, 4059–4071 CrossRef CAS.
- K. M. Stavros, E. K. Hawkins, C. J. Rizzo and M. P. Stone, Nucleic Acids Res., 2014, 42, 3450–3463 CrossRef CAS.
- F. Wang, C. E. Elmquist, J. S. Stover, C. J. Rizzo and M. P. Stone, Biochemistry, 2007, 46, 8498–8516 CrossRef CAS.
Footnotes |
| † Electronic supplementary information (ESI) available. See DOI: 10.1039/d0cb00192a |
| ‡ Current address: Department of Chemistry, University of Oxford, Oxford, OX1 3TA, UK. |
| This journal is © The Royal Society of Chemistry 2021 |