 Open Access Article
Interrogating cardiac muscle cell mechanobiology on stiffness gradient hydrogels†
Ian L.
Chin
 a,
Livia
Hool
 ab and
Yu Suk
Choi
 *a
*a
aSchool of Human Sciences, The University of Western Australia, Perth, WA, Australia. E-mail: yusuk.choi@uwa.edu.au
bVictor Chang Cardiac Research Institute, Sydney, NSW, Australia
First published on 20th September 2021
Abstract
Extracellular matrix (ECM) remodeling is a major facet of cardiac development and disease, yet our understanding of cardiomyocyte mechanotransduction remains limited. To enhance our understanding of cardiomyocyte mechanosensation, we studied stiffness-driven changes to cell morphology and mechanomarker expression in H9C2 cells and neonatal rat cardiomyocytes (NRCMs). Linear stiffness gradient polyacrylamide hydrogels (2–33 kPa) coated with ECM proteins including Collagen I (Col), Fibronectin (Fn) or Laminin (Ln) were used to represent necrotic, healthy, and infarcted cardiac tissue on a continuous stiffness gradient. Cell size, cell shape and nuclear size were found to be mechanosensitive in H9C2 cells, as was the expression or nuclear translocalization of the mechanomarkers Lamin-A, YAP, and MRTF-A. Minor differences were observed between the different ECM coatings, with the same overarching stiffness-dependent trends being observed across Col, Fn and Ln coated hydrogels. Inhibition of mechanotransduction in H9C2 cells using blebbistatin or Y27632 resulted in disruptions to cell shape, nuclear shape, and nuclear size, however, trends in cell size and mechanomarker expression were not significantly attenuated. Mechanosensation in NRCMs was much less marked, with no significant changes in cell morphology being detected, although YAP did become increasingly nuclear localized with increasing stiffness. In α-actinin positive cells, striations formed with regular structure and frequency at all stiffnesses for Col and Fn coated hydrogels, but not Ln coated gels. In this study, we used our stiffness gradient hydrogels to comprehensively map the relationship between ECM stiffness and cardiac cell phenotype and found that less mature H9C2 cardiac cells are more sensitive to ECM changes than the more developed neonatal cardiomyocytes.
Introduction
Growing appreciation of mechanobiology has led to a greater understanding of the mechanotransduction process. Conventionally, it is understood that cells interact with the extracellular matrix (ECM) via membrane bound integrins, which enable the cells to generate traction forces that ultimately lead to phenotypic changes within the cell.1–3 We believe that cells use this dynamic process to sense and respond to remodeling of the ECM and their local microenvironment. In the heart, ECM remodeling is a component of normal tissue; during organogenesis, soft mesoderm (∼0.5 kPa)4 develops into firm (∼10 kPa) cardiac tissue and mimicking this process can promote the maturation of cardiomyocytes.5,6ECM remodeling is also a major facet of cardiac disease progression and can involve both ECM degradation and deposition (reviewed by Frangogiannis7) – a marked example of this is the post-infarct scar formation, which can be four-fold stiffer (18 kPa vs. 55 kPa) than healthy myocardium.8 In the context of ischemic injury to the heart, tissue death and subsequent ECM remodeling exposes cardiac cells to dramatic biophysical change,8 which has been associated with the onset of heart disease and could be the source of aberrant signaling that drives maladaptive changes to cardiac cells. The knowledge of mechanobiology is already being used to enhance growth and maturation of stem cell-derived cardiomyocytes6 and embryonic cardiomyocytes.5 Despite these advances, the mechanisms behind mechanosensation in cardiac cells remains unclear, especially with respect to the current understanding of integrin-mediated mechanotransduction.
The bulk of our understanding of mechanosensation has been developed using adult stem cells, which have shown that cell growth, morphology, differentiation, and cell viability can all be controlled through integrin-mediated biophysical cues.2,9 Past studies have illustrated that cardiac cells are mechanosensitive: shape, sarcomere organization10,11 and muscle contraction12 have all been shown to change with substrate stiffness, however it is unclear whether the mechanisms of mechanosensation are shared between cardiac cells and the stem cells used to develop our current understandings.
To unpack mechanotransduction process in cardiac cells, we used immature rat myoblast H9C2 cardiac-derived cells and neonatal rat cardiac cells (NRCM) as our representative cardiac muscle cells. In this study, we combined our polyacrylamide stiffness gradient hydrogel platform13 with collagen I (Col), fibronectin (Fn), and laminin (Ln) protein coatings to recapitulate biophysical elements of aberrantly soft and pathologically stiff cardiac tissue on a single continuous stiffness gradient. Using this platform, we directly compared a range of biophysical conditions to provide insight into cardiomyocyte–ECM interactions and the mechanisms behind mechanosensation in cardiac muscle cells.
Methods
Fabrication of stiffness gradient PA hydrogels
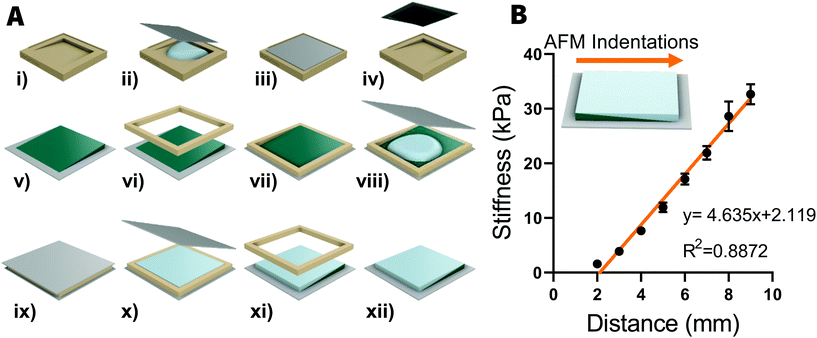
The technique for fabricating stiffness gradient polyacrylamide (PA) hydrogels was adapted from.13 A pair of 3D-printed molds were designed for fabricating the gels [Fig. 1A]; a primary (1°) mold to produce a wedge-shaped hydrogel and the secondary (2°) mold for producing a 12 × 12 × 1 mm hydrogel incorporating the first hydrogel.First, 15 × 15 mm glass coverslips (Menzel-Gläser) were ozone cleaned (Bioforce Nanosciences UV/Ozone ProCleaner) for 1 min on each side. Coverslips were than functionalized for 5 min in a solution containing 100 μL 3-(trimethoxysilyl)propyl methacrylate (Merk), 600 μl glacial acetic acid and 20 ml ethanol before rinsing in ethanol for 1 min. This process enables the polyacrylamide hydrogels to covalently attach to the glass coverslips. The pair of hydrogel molds and a separate set of coverslips were coated with dimethydichlorosilane (DCDMS) to prevent hydrogel adhesion to these surfaces.
A polymer solution was prepared with final concentrations of 12% (v/v) acrylamide monomers (Bio-Rad), 0.4% (v/v) N,N′-methylene-bis-acrylamide cross-linker and 1× Dulbecco's PBS (Mg2+ and Ca2+ free) (Life Technologies). To initiate the polymerization process, 10 μl of 0.1 g ml−1 ammonium persulfate (APS) (Merk) was mixed in to a 1 ml aliquot of polymer solution before 1 μl of N,N,N′,N′-tetramethylethylenediamine (TEMED) (Bio-Rad) was also added to the solution. After mixing for 1 s, 120 μl of this solution was added to the 1° mold and a functionalized coverslip was placed on top. The solution was allowed 20 min to polymerize before a wedge-shaped gel was extracted from the mold. The 2° mould was then placed over the top of the wedge-shaped gel to act as a retaining wall before APS and TEMED were mixed in to a second 1 ml aliquot of polymer solution, as previously described. One hundred and twenty microliters of this solution was added to the 2° mold and a DCDMS-coated coverslip was placed on top. The solution was allowed 20 min to polymerize before the DCDMS-coated coverslip and the 2° mold were removed, leaving a 12 × 12 × 1 hydrogel adhered to the 15 × 15 mm functionalized coverslip.
Stiffness characterization of hydrogels
The compressive Young's moduli of gradient hydrogels were characterized using an MFP-3D atomic force microscope (Asylum Research), using 200 μm chromium/gold-coated, pyrex-nitride cantilevers with triangular-shaped tips (Nano World model PNP-TR-50). Hydrogels were immersed in 1× PBS and probed with 2 nN indentations at an approach velocity of 2 μm s−1 and with a retraction velocity of 10 μm s−1. A custom-written code in Igor Pro was used to determine Young's modulus from the linear portion of contact-generated force curves, as previously described.13To confirm the presence of a stiffness gradient, 8 indentations were made at 1 mm intervals along the axis of the stiffness gradient, starting 2 mm away from the softest edge. All indentations were made in triplicate and averaged to give an average stiffness per location indented. Stiffness measurements in kilopascals were then plotted against displacement from the edge of the hydrogel in GraphPad Prism.
Cell culture
H9C2 cells (ATCC CRL1446) were cultured in growth media containing DMEM (Life Technologies) with 10% FBS (Life Technologies) and 1×antibiotic–antimycotic. H9C2 cells were seeded into hydrogel-containing 12-well plates, at an initial density of approximately 3.95 × 10³ cells per cm2 to achieve 60% confluence after 2-days of culture; this was the time required to achieve complete spreading, consistent with past studies.11,12,38 Media was changed after the first day of culture and cells were fixed after 48 hours.Neonatal Rat Ventricular Myocytes (NRCM) (Lonza R-CM-561) were cultured in RCBM Basal Medium (Lonza) supplemented by a Rat Cardiac Myocyte Growth Medium SingleQuots Kit (Lonza). As above, NRVCMs were seeded into hydrogel-containing 12-well plates, at a density of approximately 8.76 × 10⁴ cells per cm2 to achieve 100% confluency after 4-days of culture. Media was changed every day of culture and cells were fixed after 96 hours.
Mechanosensation inhibition
Inhibition of mechanosensation was performed on H9C2 cells by treating cells for 48 hours with either the myosin II inhibitor blebbistatin (Merk) or the Rho-associated protein kinase (ROCK) inhibitor Y27632 (Merk). Cells were seeded on hydrogels and cultured in growth media for 5 hours before the media was changed for growth media containing either blebbistatin (50 μM) or Y27632 (10 μM). Inhibition media was changed after 24 hours and cells were fixed after 48 hours of exposure to inhibitors.Single-cell AFM
Single-cell AFM was performed on H9C2 cells cultured on stiffness-gradient hydrogels for 4-days. Using the same AFM configuration as for characterizing hydrogels, cells were indented every 1 mm along the stiffness gradient of the gel from 2 mm to 9 mm from the edge of the gel. For each cell indented, a nearby portion of hydrogel was also indented to confirm the stiffness of the hydrogel. Cells were indented close to the center of the cell and force curves were analyzed as previously described.Results and discussion
Fabricating stiffness gradient hydrogels
The fabrication process for producing stiffness gradient hydrogels was adapted from a previous study13 and is schematically illustrated in [Fig. 1A]. We improved the ease of use of the molds and the success rate of hydrogel fabrication by redesigning mold geometry. Computer aided design software (Autodesk Fusion 360) was used to design 12 × 12 × 1 mm form factor, which fits in a standard 12-well plate, which were then 3D printed (Form Labs Form 2). The new molds made it easier to avoid trapping bubbles during the fabrication process and reduced that amount of hydrogel-tearing experienced when retrieving the hydrogels from the molds.Using 12% acrylamide and 0.4% bisacrylamide for the first and second hydrogels, we produced a linear stiffness gradient ranging from 2 kPa to 33 kPa (Young's elastic modulus) (Pearson's correlation coefficient, R2 = 0.89, P < 0.001, n = 8), as characterized by AFM indentation [Fig. 1B]. This was the same stiffness range observed in the original 20 × 24 × 1 mm hydrogels13 but with a stronger stiffness gradient (4.1 kPa mm−1vs. 2.9 kPa mm−1), indicating that this fabrication technique can effectively scale the size of the hydrogel while still maintaining the highly tunable stiffness range.
It was important to target a stiffness range that extended above and below the stiffness of healthy cardiac tissue (10–18 kPa)8 as ECM varies across the different stages of heart disease; for example following a myocardial infarction, the ECM becomes soft during wound healing and is stiff after scar formation.7,14,15 In the present study, the softer and stiffer regions of hydrogel are representative of these compromised environments. Although this platform does not incorporate any temporal elements, which have been shown to be important in cardiomyocyte maturation,5 stiffness gradient hydrogels allow for a comprehensive study cardiomyocyte mechanosensation across a range of disease states.
H9C2 morphology and mechanomarker expression correlate with stiffness
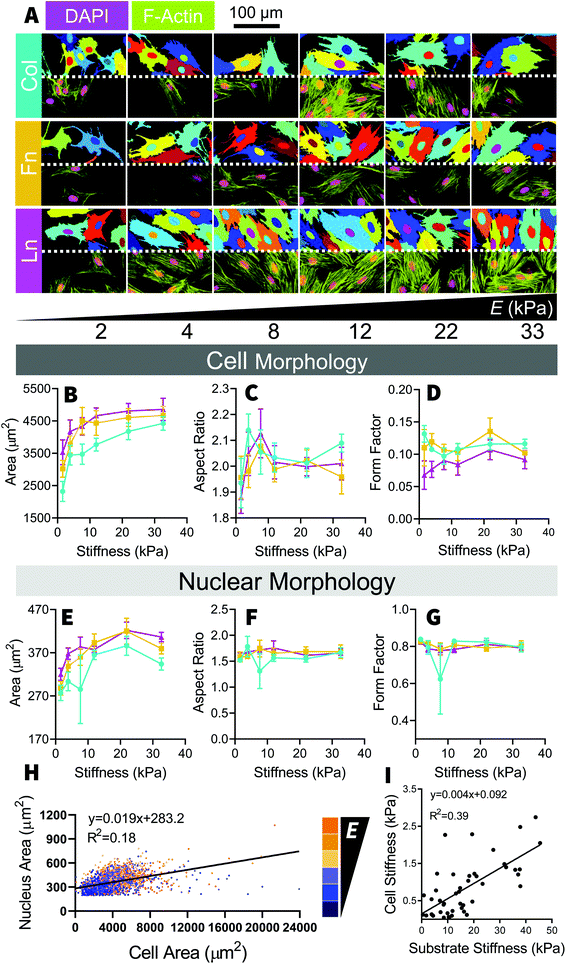
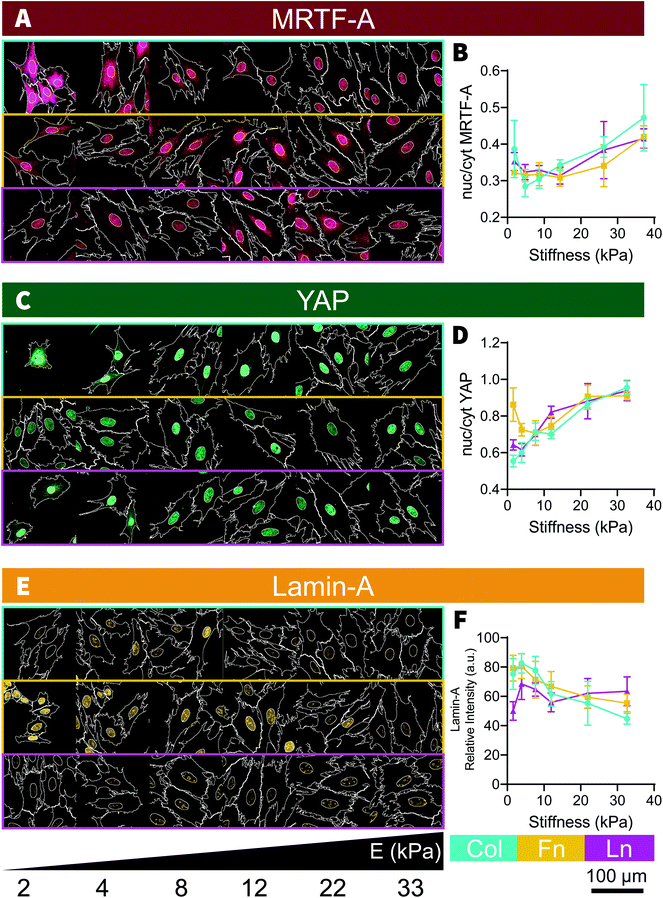
After 48 hours of culture, H9C2 cells were distributed relatively evenly across the stiffness gradient [Fig. S1†]. Mechanosensation in H9C2 cells was measured through changes in cell morphology and changes in mechanomarker expression, with comparisons being made across the different stiffnesses and between the different ECM coating types. F-Actin and DAPI stains were analyzed in CellProfiler [Fig. 2A] to measure cell size and nucleus size, respectively, showing positive, non-monotonic, trends with increasing substrate stiffness. Cell and nucleus sizes increased steadily between 2 kPa and 12 kPa, where it plateaued [Fig. 2B]. H9C2 cells maintained the same general shape across all stiffnesses, although with substantially greater variability on soft substrates (<10 kPa) [Fig. 2C and D]. While nuclear size followed a similar trend to cell size, increasing with substrate stiffness [Fig. 2E], nucleus shape remained uniform across the stiffness gradient [Fig. 2F and G]. There was no clear relationship between nuclei area and the corresponding cell area, although it tended to be that larger cells had larger nuclei [Fig. 2H]. When mechanically probed with the AFM, we found a positive correlation between cell stiffness and underlying substrate stiffness, where cells cultured on stiff substrates adapted to be stiffer [Fig. 2I]. These morphological changes are consistent with past studies, where cell size and aspect ratio increased markedly as substrate stiffness increased from soft to moderately stiff (1 kPa–10 kPa) and continued to increase, but then rapidly plateaus at greater substrate stiffnesses (>10 kPa).11,12To unpack the mechanotransduction process, we used immunofluorescent analysis to examine MRTF-A, YAP and Lamin-A expression; three well studied mechanomarkers believed to play a role in communicating mechanical signals from the ECM to the nucleus. Traditionally, MRTF-A and YAP will be found in both the cytoplasm and the nucleus, but will become increasingly nuclear localized with increasing substrate stiffness13,16–18 and Lamin-A, which is only found in the nucleus, becomes expressed more intensely with increasing substrate stiffness.13,18,19 In the present study, MRTF-A and YAP became increasingly nuclear localized with increasing stiffness, as indicated by their respective nuc/cyt ratio [Fig. 3A–D], and Lamin-A expression decreased with increasing stiffness on Col and Fn coated substrates [Fig. 3E and F]. Unlike the changes in cell size, the nuclear localization of YAP and MRTF-A increased linearly with increasing substrate stiffness, similar to what we observed in our previous study using the same platform with adipose-derived stem cells (ASC).13,18
Surprisingly, cell area did not seem to be correlated with mechanomarker expression [Fig. S2†], as has been observed in past stem cell studies.13,16,20 The relationships between cell, nucleus size and mechanomarker expression can be cell-specific and the cause of this discrepancy is unclear in this case. Both MRTF-A13,17,21 and YAP16,20,22 are known to respond to microenvironment-driven changes to cell morphology and potentially may play a role in driving cell morphology.16,21 However both MRTF-A23–25 and YAP (reviewed by Heng et al.26) are also known to regulate differentiation in stem cells. It is possible that after differentiation in to myocytes, MRTF-A and YAP activity may become less sensitive to changes in cell morphology due to lineage-specific activation and inactivation of transcription pathways, such as MRTF-A-SRF mediated maturation of contractile apparatus27 or inactivation of YAP mediated proliferation.28
No major differences were observed between each of the ECM coatings, with stiffness-based trends being conserved across the collagen, fibronectin, and laminin coated substrates [Fig. 3]; an observation that held true in the subsequent inhibition study and investigation of NRCM cells. Whilst minor differences do exist (e.g. collagen-cultured cells were slightly smaller [Fig. 2A and B], fibronectin-cultured cells expressed more Lamin-A [Fig. 3E and F]), overall trends were consistent across the three different types of ECM coating, which remained true for the subsequent inhibition study and NRCM culture we performed. Past studies have indicated that cells can have ECM specific responses, for example fibroblasts have been found to respond to durotactic gradients when substrates were coated with fibronectin but not laminin29 and human embryonic stem cell, differentiation into cardiomyocytes is most efficient on tissue culture plastic coated with a mixture of fibronectin and laminin,30 however in our study, the H9C2 cells appear to be insensitive to the ECM protein they were exposed to while being mechanosensitive to the underlying substrate stiffness.
Disruption of traction force generation altered H9C2 mechanotransduction
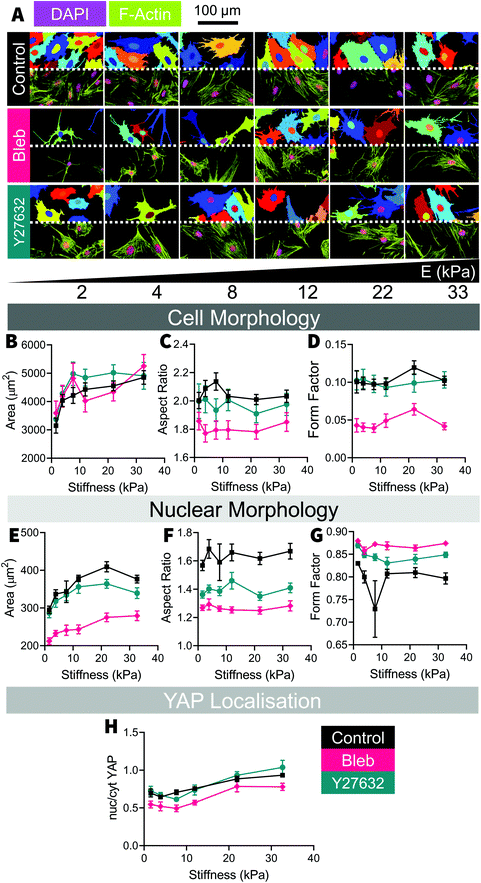
To further investigate traction force-mediated mechanosensation in H9C2 cells, we used blebbistatin and Y27632 to pharmacologically targeted two critical elements of the integrin-mediated mechanotransduction pathway: actin-myosin activity31 and Rho/ROCK activity.32 In a conventional model of mechanosensation, substrate stiffness mediated activation of ROCK results in contraction of cytoskeletal actomyosin via myosin light chain kinase activity, leading to the generation of traction forces and mechanosensation. We have used blebbistatin and Y27632 in the past to impair mechanonsensation in ASCs, observed through changes to cell shape, cell size and YAP expression.18Blebbistatin had a marked effect on H9C2 cell shape, yet no discernible impact on YAP expression when compared to control samples [Fig. 4]. In blebbistatin treated samples, H9C2 cells were less elongated and less rounded than control samples [Fig. 4C and D], as shown by the reduced aspect ratio and form factor measurements at all stiffnesses; evidence that blebbistatin had disrupted acto-myosin structure in treated cells. By comparison, Y27632 samples had a comparable cell shape to control cells, where the aspect ratio and form factor of the cells were comparable to those of control samples. In both blebbistatin and Y27632 treated cells, nuclei were smaller and more circular, shown by reduced nuclear aspect ratio, and increased nuclear form factor [Fig. 4E–G] compared to the control samples. Surprisingly, trends in cell size and YAP localization did not appear to be altered by blebbistatin or Y27632 treatment: both treatment groups had similar cell areas and expressed similar YAP ratios to the control samples [Fig. 4H].
As blebbistatin primarily targets myosin II activity,33,34 it has the capacity to affect both muscle actomyosin as well as the stress fibres that form the cytoskeletal network. The loss of actomyosin contractility has been demonstrated to impair focal adhesion clustering and maturation,35,36 resulting in a disrupted cytoskeleton. On the other hand, Y27632 inhibits RhoA/ROCK signalling, which regulates stress fibre actomyosin activity37 but not muscle actomyosin activity, it has been suggested that cardiomyocytes sense their microenvironment through a mixture of muscle and non-muscle contractions,38 so it is possible that H9C2 cells behave similarly, whereby the actomyosin in the cytoskeleton behaves more like muscle actomyosin than stress fibres, potentially explaining why Y27632 had such a small effect on cell shape. In explaining YAP expression, the literature has suggested that myosin II contractility is not necessary for YAP translocation in some cells39 and that the function of healthy cardiac cells may not be affected by mild ROCK inhibition.40 The results of blebbistatin treatment are more difficult to explain as the consensus is that stable F-actin must still be present for nuclear YAP accumulation to occur16,18,39 and in the present study, the F-actin of blebbistatin cells was clearly disrupted. The reason and significance of this result remains unclear.
Neonatal cardiomyocytes and substrate stiffness
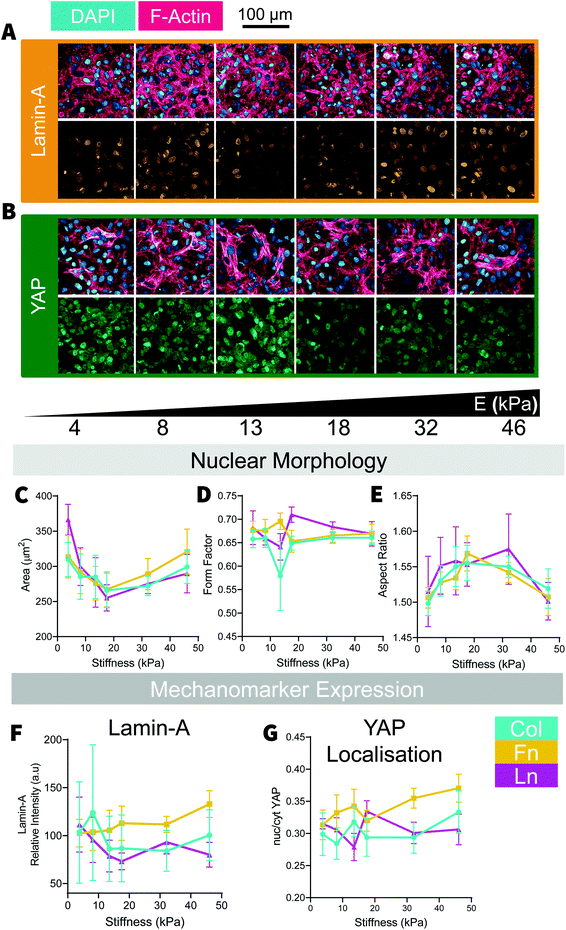
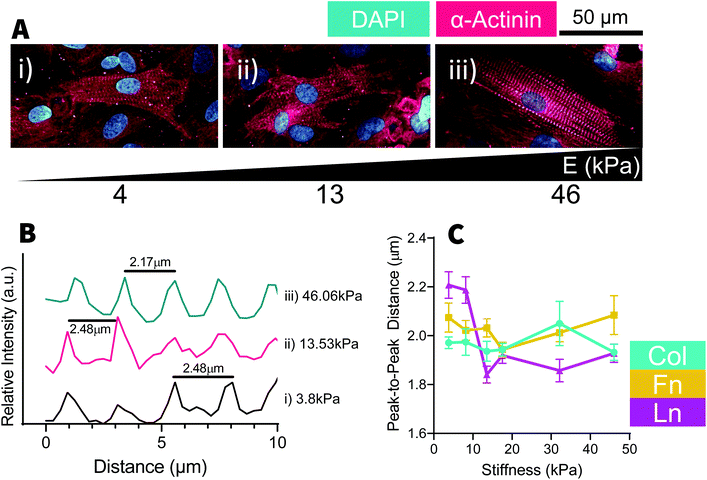
Culture of cardiomyocytes of any form has been a consistent challenge within cardiac research. Cardiac cell culture requires a complex combination of biomechanical and biochemical signaling from both the ECM and neighboring cells. Under the conditions used, we found cells needed to be cultured near to 100% confluence and would often form a multilayered culture, where striated cells could often be found growing on a dense bed of cardiac fibroblasts. As a consequence, analysis of cell morphology was extremely challenging as it was very difficult to distinguish between neighboring cells, which could be above and below in addition to being lateral to each other. At a glance, NRCM nuclei area reduced until ∼18 kPa before gradually increasing with increasing stiffness [Fig. 5C] and inversely the nuclei became increasingly elongated up to 18 kPa (on Col- and Fn-coated substrates) with reduced aspect ratios above and below that substrate stiffness [Fig. 5E]. NRCM nuclear circularity [Fig. 5D] and Lamin-A expression [Fig. 5F] were relatively constant as stiffness but YAP became more nuclear localized with increasing stiffness, particularly on Fn-coated samples [Fig. 5G]. Similar to the H9C2 cells, NRCM adopted similar trends across all substrate coatings with minor differences, such as slightly elevated expression of Lamin-A and greater nuclear localization of YAP in cells cultured on Fn-coated samples [Fig. 5F and G]. In NRCMs presenting with myofibrils, sarcomeres regularity was measured by the distance between Z-disks [Fig. 6]. The distance between Z-disks was relatively constant across the stiffness gradient on Col- and Fn-coated hydrogels, but with increased distance between Z-disks on soft (<10 kPa) Ln-coated substrates [Fig. 6C]. Of the trends observed, none of the changes to nuclear morphology had statistically significant relationships with substrate stiffness, however for cells cultured on Fn-coated substrates, there was a positive correlation between substrate stiffness and Lamin-A expression and substrate stiffness and YAP localization [Fig. 5F and G].Like the H9C2 cells, some properties of NRCMs appear to be mechanosensitive, such as the expression of mechanomarkers like Lamin-A and YAP [Fig. 3D, F and 5F, G], and some properties are relatively stable with changes to substrate stiffness, such as with nuclear shape [Fig. 2E–G and 5C–E]. Likewise, whilst all ECM protein coatings induced similar trends, trends appeared to be more sensitive to stiffness changes depending on the ECM coating, such as with Lamin-A expression in both H9C2 and NRCMs cultured on Fn-coated substrates. As an analogue for cardiac muscle cell mechanobiology, H9C2 cells provided us with useful insights towards the trends we observed in the NRCMs but do not necessarily replicate the exact behaviors of a primary cell culture.
Conclusion
In this study, we used stiffness gradient hydrogels to directly compare the effects of stiffness on cardiac cell morphology and the expression of mechanosensitive proteins. We assumed that, under the circumstances, we would observe conventional integrin-mediated mechanosensation, whereby mechanical cues from the ECM would be transmitted to the cells via membrane-bound integrins and then transduced into biochemical signals by elements of the focal adhesion complex and the actin cytoskeleton, ultimately resulting in changes to gene transcription.Changes to cell morphology and to the expression of the mechanosensitive proteins YAP and MRTF-A in H9C2 cells supported our belief that cardiac cells are mechanosenstive, however our proposed mechanotransduction pathway did not provide a satisfactory explanation for our data. The retention of trends in cell size and YAP expression despite clear disruption to the actin cytoskeleton suggested that these characteristics of H9C2 cells are not solely dependent on actin-mediated forces and possibly even Rho/ROCK activity. We also found that the H9C2 cells were largely insensitive to the type of ECM they were exposed to and did not observe any protein-coating specific trends or phenomena.
When we expanded our scope to the primary culture of neonatal cardiac muscle cells, some of the trends we observed in H9C2 cells were also present in NRCMs, whereas some deviated from what we observed in the H9C2 cells. We may have been able to increase the sensitivity of our experiment if a purer culture of cardiomyocytes or cardiac-fibroblasts had been used, allowing us to more stringently examine interactions between the given cell types and their microenvironment, however this would not represent the reality of the cardiac microenvironment. Myocardium is a complex arrangement of cells not recapitulated by our model, including endothelial cells and vascular smooth muscle cells. It is possible that cell–cell interactions derived from both the composition and arrangement of cells provide the dominant cue in cardiac cells, defining the expressed phenotype.
Our study has outlined a basic relationship between ECM stiffness and cardiac cell phenotypes; however, it has also illustrated the challenges involved in studying isolated elements of the cardiac microenvironment- the physiological significance of ECM stiffness or composition can be very different when comparing simple cell culture platforms to more complex combinatorial systems or even the in vivo context. Though we see our stiffness gradient platform as an improvement over traditional cell culture plastic, it does not capture the intricacies of naturally deposited ECM, let alone the temporally dynamic compositions observed in vivo. Several studies have identified that heterogenous ECM coatings can elicit cell responses not detectable from homogenous ECM coatings30,41,42 and cells have been shown to respond to the arrangement of ECM ligands on a nanoscale,43,44 illustrating that the composition and spatial arrangement of the ECM can provide important environmental cues. Furthermore, we only studied cardiac cells in a 2D context, where cellular arrangements are limited to various forms of monolayers. With the emergence of biomaterials that support three-dimensional (3D) cell growth, it has become apparent that the dynamics of 3D cell culture are very different to that of 2D culture20–22,45 as more 3D cellular constructs are adopted, such as organoids and spheroids, it has become increasingly important that we understand how cells respond to these environments. We hope that emerging systems and methods enhance our recapitulation of the cardiac microenvironment and unlock new understandings of the role of the ECM in the development and treatment of heart disease.
Author contributions
I. L. C and Y. S. C designed and planned the study. I. L. C drafted the manuscript. Y. S. C provided supervision and funding. All authors discussed the data and contributed to the final version of the manuscript. All authors have given approval to the final version of the manuscript.Conflicts of interest
There are no conflicts to declare.Acknowledgements
This work was supported National Health and Medical Research Council (NHMRC) Project Grant 1098449 (to Y. S. C), Heart Foundation Future Leader Fellowship 101173 (to Y. S. C), UWA fellowship support 2018/RA/1/1997/70 (to Y. S. C), NHMRC Senior Research Fellowship APP1117366 (to L. C. H) and Australian Government Research Training Program Scholarship (to I. L. C).References
- N. Q. Balaban, U. S. Schwarz, T. Ishizaki and S. Narumiya, J. Cell Biol., 2001, 153, 1175–1185 CrossRef PubMed.
- A. J. Engler, S. Sen, H. L. Sweeney and D. E. Discher, Cell, 2006, 126, 677–689 CrossRef CAS PubMed.
- A. D. Rape, W. H. Guo and Y. L. Wang, Biomaterials, 2011, 32, 2043–2051 CrossRef CAS PubMed.
- M. Krieg, Y. Arboleda-Estudillo, P. H. Puech, J. Käfer, F. Graner, D. J. Müller and C. P. Heisenberg, Nat. Cell Biol., 2008, 10, 429–436 CrossRef CAS PubMed.
- J. L. Young and A. J. Engler, Biomaterials, 2011, 32, 1002–1009 CrossRef CAS PubMed.
- T. J. Herron, A. M. Da Rocha, K. F. Campbell, D. Ponce-Balbuena, B. C. Willis, G. Guerrero-Serna, Q. Liu, M. Klos, H. Musa, M. Zarzoso, A. Bizy, J. Furness, J. Anumonwo, S. Mironov and J. Jalife, Circ.: Arrhythmia Electrophysiol., 2016, 9, 1–12 Search PubMed.
- N. G. Frangogiannis, Circ. Res., 2019, 125, 117–146 CrossRef CAS PubMed.
- M. F. Berry, A. J. Engler, Y. J. Woo, T. J. Pirolli, L. T. Bish, V. Jayasankar, K. J. Morine, T. J. Gardner, D. E. Discher and H. L. Sweeney, Am. J. Physiol.: Heart Circ. Physiol., 2006, 290, H2196–H2203 CrossRef CAS PubMed.
- J. H. Wen, L. G. Vincent, A. Fuhrmann, Y. S. Choi, K. C. Hribar, H. Taylor-Weiner, S. Chen and A. J. Engler, Nat. Mater., 2014, 13, 979–987 CrossRef CAS PubMed.
- J. G. Jacot, A. D. McCulloch and J. H. Omens, Biophys. J., 2008, 95, 3479–3487 CrossRef CAS PubMed.
- A. Chopra, E. Tabdanov, H. Patel, P. A. Janmey and J. Y. Kresh, Am. J. Physiol.: Heart Circ. Physiol., 2011, 300, H1252–H1266 CrossRef CAS PubMed.
- N. Hersch, B. Wolters, G. Dreissen, R. Springer, N. Kirchgessner, R. Merkel and B. Hoffmann, Biol. Open, 2013, 2, 351–361 CrossRef CAS PubMed.
- W. J. Hadden, J. L. Young, A. W. Holle, M. L. McFetridge, D. Y. Kim, P. Wijesinghe, H. Taylor-Weiner, J. H. Wen, A. R. Lee, K. Bieback, B.-N. Vo, D. D. Sampson, B. F. Kennedy, J. P. Spatz, A. J. Engler and Y. S. Choi, Proc. Natl. Acad. Sci. U. S. A., 2017, 114, 5647–5652 CrossRef CAS PubMed.
- A. Haunstetter and S. Izumo, Circ. Res., 1998, 82, 1111–1129 CrossRef CAS PubMed.
- G. M. Fomovsky and J. W. Holmes, Am. J. Physiol.: Heart Circ. Physiol., 2010, 298, H221–H228 CrossRef CAS PubMed.
- S. Dupont, L. Morsut, M. Aragona, E. Enzo, S. Giulitti, M. Cordenonsi, F. Zanconato, J. Le Digabel, M. Forcato, S. Bicciato, N. Elvassore and S. Piccolo, Nature, 2011, 474, 179–184 CrossRef CAS PubMed.
- O. M. Yu, S. Miyamoto and J. H. Brown, Mol. Cell. Biol., 2016, 36, 39–49 CrossRef CAS PubMed.
- C. Kim, J. L. Young, A. W. Holle, K. Jeong, L. G. Major, J. H. Jeong, Z. M. Aman, D.-W. Han, Y. Hwang, J. P. Spatz and Y. S. Choi, Ann. Biomed. Eng., 2020, 48, 893–902 CrossRef PubMed.
- J. Swift, I. L. Ivanovska, A. Buxboim, T. Harada, P. C. D. P. Dingal, J. Pinter, J. D. Pajerowski, K. R. Spinler, J.-W. Shin, M. Tewari, F. Rehfeldt, D. W. Speicher and D. E. Discher, Science, 2013, 341, 1240104–1240104 CrossRef PubMed.
- S. R. Caliari, S. L. Vega, M. Kwon, E. M. Soulas and J. A. Burdick, Biomaterials, 2016, 103, 314–323 CrossRef CAS PubMed.
- L. G. Major, A. W. Holle, J. L. Young, M. S. Hepburn, K. Jeong, I. L. Chin, R. W. Sanderson, J. H. Jeong, Z. M. Aman, B. F. Kennedy, Y. Hwang, D. W. Han, H. W. Park, K. L. Guan, J. P. Spatz and Y. S. Choi, ACS Appl. Mater. Interfaces, 2019, 11, 45520–45530 CrossRef CAS PubMed.
- H. Lee, R. Stowers and O. Chaudhuri, Nat. Commun., 2019, 10, 529 CrossRef PubMed.
- H. Nobusue, N. Onishi, T. Shimizu, E. Sugihara, Y. Oki, Y. Sumikawa, T. Chiyoda, K. Akashi, H. Saya and K. Kano, Nat. Commun., 2014, 5, 3368 CrossRef PubMed.
- H. Bian, J. Z. Lin, C. Li and S. R. Farmer, Mol. Metab., 2016, 5, 970–979 CrossRef CAS PubMed.
- S. Werner, J. Lützkendorf, T. Müller, L. P. Müller and G. Posern, Sci. Rep., 2019, 9, 1–12 CAS.
- B. C. Heng, X. Zhang, D. Aubel, Y. Bai, X. Li, Y. Wei, M. Fussenegger and X. Deng, Front. Cell Dev. Biol., 2020, 8, 1–23 CrossRef PubMed.
- M. H. Mokalled, K. J. Carroll, B. K. Cenik, B. Chen, N. Liu, E. N. Olson and R. Bassel-Duby, Dev. Biol., 2015, 406, 109–116 CrossRef CAS PubMed.
- A. Von Gise, Z. Lin, K. Schlegelmilch, L. B. Honor, G. M. Pan, J. N. Buck, Q. Ma, T. Ishiwata, B. Zhou, F. D. Camargo and W. T. Pu, Proc. Natl. Acad. Sci. U. S. A., 2012, 109, 2394–2399 CrossRef CAS PubMed.
- C. D. Hartman, B. C. Isenberg, S. G. Chua and J. Y. Wong, Exp. Cell Res., 2017, 359, 361–366 CrossRef CAS PubMed.
- S. Sa, L. Wong and K. E. McCloskey, BioRes. Open Access, 2014, 3, 150–161 CrossRef CAS PubMed.
- S. Shu, X. Liu and E. D. Korn, Proc. Natl. Acad. Sci. U. S. A., 2005, 102, 1472–1477 CrossRef CAS PubMed.
- M. Uehata, T. Ishizaki, H. Satoh, T. Ono, T. Kawahara, T. Morishita, H. Tamakawa, K. Yamagami, J. Inui, M. Maekawa and S. Narumiya, Nature, 1997, 389, 990–994 CrossRef CAS PubMed.
- M. Kovács, J. Tóth, C. Hetényi, A. Málnási-Csizmadia and J. R. Seller, J. Biol. Chem., 2004, 279, 35557–35563 CrossRef PubMed.
- Y. Dou, P. Arlock and A. Arner, Am. J. Physiol. - Cell Physiol., 2007, 293, C1148–C1153 CrossRef CAS PubMed.
- C. G. Galbraith, K. M. Yamada and M. P. Sheetz, J. Cell Biol., 2002, 159, 695–705 CrossRef CAS PubMed.
- C. K. Choi, M. Vicente-Manzanares, J. Zareno, L. A. Whitmore, A. Mogilner and A. R. Horwitz, Nat. Cell Biol., 2008, 10, 1039–1050 CrossRef CAS PubMed.
- M. Vicente-Manzanares, X. Ma, R. S. Adelstein and A. R. Horwitz, Nat. Rev. Mol. Cell Biol., 2009, 10, 778–790 CrossRef CAS PubMed.
- P. Pandey, W. Hawkes, J. Hu, W. V. Megone, J. Gautrot, N. Anilkumar, M. Zhang, L. Hirvonen, S. Cox, E. Ehler, J. Hone, M. Sheetz and T. Iskratsch, Dev. Cell, 2018, 44, 326–336 CrossRef CAS PubMed.
- A. Das, R. S. Fischer, D. Pan and C. M. Waterman, J. Biol. Chem., 2016, 291, 6096–6110 CrossRef CAS PubMed.
- G. Lin, G. P. Craig, L. Zhang, V. G. Yuen, M. Allard, J. H. McNeill and K. M. MacLeod, Cardiovasc. Res., 2007, 75, 51–58 CrossRef CAS PubMed.
- L. Hou, J. J. Kim, M. Wanjare, B. Patlolla, J. Coller, T. J. Hastie and N. F. Huang, Sci. Rep., 2017, 1–12 Search PubMed.
- R. G. Ireland, M. Kibschull, J. Audet, M. Ezzo, B. Hinz, S. J. Lye and C. A. Simmons, Biomaterials, 2020, 248, 120017 CrossRef CAS PubMed.
- G. Roman, M. Martin and P. S. Joachim, Nanotechnology, 2003, 14, 1153 CrossRef.
- J. L. Young, X. Hua, H. Somsel, F. Reichart, H. Kessler and J. P. Spatz, Nano Lett., 2020, 20, 1183–1191 CrossRef CAS PubMed.
- C. Crocini, C. J. Walker, K. S. Anseth and L. A. Leinwand, Prog. Biophys. Mol. Biol., 2020, 154, 71–79 CrossRef CAS PubMed.
Footnote |
| † Electronic supplementary information (ESI) available. See DOI: 10.1039/d1bm01061a |
| This journal is © The Royal Society of Chemistry 2021 |

![[thin space (1/6-em)]](https://www.rsc.org/images/entities/char_2009.gif) :
: