 Open Access Article
In silico study of PEI-PEG-squalene-dsDNA polyplex formation: the delicate role of the PEG length in the binding of PEI to DNA†
Tudor
Vasiliu
a,
Bogdan Florin
Craciun
 a,
Andrei
Neamtu
b,
Lilia
Clima
a,
Dragos Lucian
Isac
a,
Stelian S.
Maier
ag,
Mariana
Pinteala
a,
Andrei
Neamtu
b,
Lilia
Clima
a,
Dragos Lucian
Isac
a,
Stelian S.
Maier
ag,
Mariana
Pinteala
 *a,
Francesca
Mocci
 *ac and
Aatto
Laaksonen
 *adef
*adef
aCenter of Advanced Research in Bionanoconjugates and Biopolymers, “Petru Poni” Institute of Macromolecular Chemistry, Iasi 700487, Romania. E-mail: aatto@mmk.su.se; pinteala@icmpp.ro; fmocci@unica.it; Tel: +46 704571445
bBioinformatics Laboratory, TRANSCEND IRO, Iaşi 700843, Romania
cDipartimento di Scienze Chimiche e Geologiche, Università di Cagliari, Monserrato, 09042 Cagliari, Italy
dDepartment of Materials and Environmental Chemistry, Division of Physical Chemistry, Arrhenius Laboratory, Stockholm University, 106 91 Stockholm, Sweden
eState Key Laboratory of Materials-Oriented and Chemical Engineering, Nanjing Tech University, 210009 Nanjing, PR China
fDepartment of Engineering Sciences and Mathematics, Division of Energy Science, Luleå University of Technology, 97187 Luleå, Sweden
gPolymers Research Center, “Gheorghe Asachi” Technical University of Iasi, Iasi, 700487, Romania
First published on 13th August 2021
Abstract
Biocompatible hydrophilic polyethylene glycol (PEG) is widely used in biomedical applications, such as drug or gene delivery, tissue engineering or as an antifouling component in biomedical devices. Experimental studies have shown that the size of PEG can weaken polycation–polyanion interactions, like those between branched polyethyleneimine (b-PEI) and DNA in gene carriers, but details of its cause and underlying interactions on the atomic scale are still not clear. To better understand the interaction mechanisms in the formation of polyplexes between b-PEI-PEG based carriers and DNA, we have used a combination of in silico tools and experiments on three multicomponent systems differing in PEG MW. Using the PEI-PEG-squalene-dsDNA systems of the same size, both in the all-atom MD simulations and in experimental in-gel electrophoresis measurements, we found that the binding between DNA and the vectors is highly influenced by the size of PEG, with the binding efficiency increasing with a shorter PEG length. The mechanism of how PEG interferes with the binding between PEI and DNA is explained using a two-step MD simulation protocol that showed that the DNA–vector interactions are influenced by the PEG length due to the hydrogen bond formation between PEI and PEG. Although computationally demanding we find it important to study molecular systems of the same size both in silico and in a laboratory and to simulate the behaviour of the carrier prior to the addition of bioactive molecules to understand the molecular mechanisms involved in the formation of the polyplex.
Introduction
Polyethylene glycol (PEG) is a polymer used in complex drug delivery systems, approved by the FDA. It is found highly attractive due to its biosafety profile, tunable properties, and ability to sterically stabilize and protect the bioactive molecule from the host's immune defense system. PEG molecules are commonly used in non-viral carriers in gene therapy, a class of medical treatments aimed at eliminating the cause of diseases instead of relieving the symptoms that relies on recombinant nucleic acids to regulate, repair, replace, add/or delete a genetic sequence in the cells of a patient.1 Still, after 30 years of research and development, roughly ten projects have been approved by regulatory agencies, including Glybera® (alipogene tiparvovec), Imlygic® (talimogene laherparepvec) or Strimvelis® (autologous CD34 + cells transduced to express ADA).2 This is largely due to the great difficulties in creating carriers capable of efficiently delivering large amounts of genetic material into the targeted cells. The most efficient carriers available today are viral vectors,3 “designed” by nature. However, it is difficult to engineer them for use as general transporters, due to their rigid structure, and to the prohibitive costs of manufacturing them in large amounts. Although very efficient, they can elicit immune responses in the body, which may go out of control in therapeutics. Therefore, a better alternative is to continue to develop synthetic (non-viral) vectors using decorated nanoparticles or relying on polymeric systems, either linear, branched, or dendrimer. They are cheap to produce and highly tunable and can be easily designed for specific applications, achieving nearly the same efficiency as the viral vectors. Usually, non-viral vectors for delivering anti-cancer drugs are made of stimuli-responsive polymers or block-copolymers, in order to be able to deliver their cargo inside the malignant cells, where the pH is lower and temperature is higher than that in the healthy cells. For DNA delivery, one of the most common building blocks is the cationic polymer polyethyleneimine (PEI), either linear (l-PEI) or branched (b-PEI). PEI interacts strongly with DNA through electrostatic forces between its positively charged protonated amine groups and the negatively charged phosphate groups of DNA, forming condensed complexes (polyplexes) capable of penetrating the cell wall.4–6 However, the capability of positively charged b-PEI to form strong electrostatic interactions with negatively charged bio-compounds regularly leads to increased cytotoxicity.7 A common approach to reduce the toxicity caused by b-PEI is to cover it with a “stealth agent”. Hydrophilic polymers, like polyethylene glycol (PEG), or proteins, like the blood plasma human serum albumin (HSA), can be used to shield or mask the positive charges of PEIs.8–14 In particular, PEG has been extensively used in this field, e.g., to reduce the immunogenicity and/or to prolong the circulation of viral gene vectors, to improve gene vector delivery to the airway tract or the gastro-intestinal system, just to cite a few of the applications. Both Suk et al.14 and Yadav et al.15 published comprehensive reviews on the multitude of successful utilization of PEGylation.Due to the highly charged nature of nucleic acid molecules, the interaction with ions is fundamental in regulating their functions. Many experimental and theoretical investigations have been focused on understanding nucleic acid DNA interactions with relatively simple physiological ions, how they are affected by the ion's nature and DNA sequence, and how they affect the nucleic acid structural organization, dynamics, and biophysical and biological behaviour (see for example ref. 16–22 and references therein). The understanding of DNA interactions with complex charged systems, as those used for gene delivery, is a very challenging task, and molecular simulations have been only recently used to help the design and evaluation of polymer-based drug/gene delivery systems.23–33
Both experimentally and theoretically, PEI remains one of the most studied polycations used for DNA binding and gene transfection. The behaviour of this polycation has been analysed extensively using both atomistic and coarse-grain models in both Monte Carlo and classical MD simulations, as a stand-alone polymer or as a part of a block-copolymer with PEG or lipids.26,34–42 At the same time several experimental studies have shown that the PEG length influences the binding efficiency of PEI and other cationic polymers to DNA or RNA,43–48 although the molecular mechanisms behind this phenomenon have not been clarified yet, due to the difficulty in obtaining detailed structural data of polymeric systems from the experiments. In detail, Malek et al.44 observed by using Heparin displacement assays, “the impaired complexation efficacy of PEI upon PEGylation”. Yang et al.45 observed, using gel electrophoresis and FRET experiments, that “a longer PEG chain hinders the complexation with siRNA”. Previous investigations from our laboratory reported differences in the binding ability of PEG + PEI vectors to DNA as a function of the length of molecular segments of PEG.49–52 The in-depth explanation of this macroscopical behaviour requires the understanding of the microscopical organization, with details of the intra and inter molecular interactions either between the vector main components and between the vector and the cargo. The needed molecular insight into the binding mechanisms, which could not be reached with the experiments alone, can be obtained by simulating at the atomistic level the vector and the polyplex.
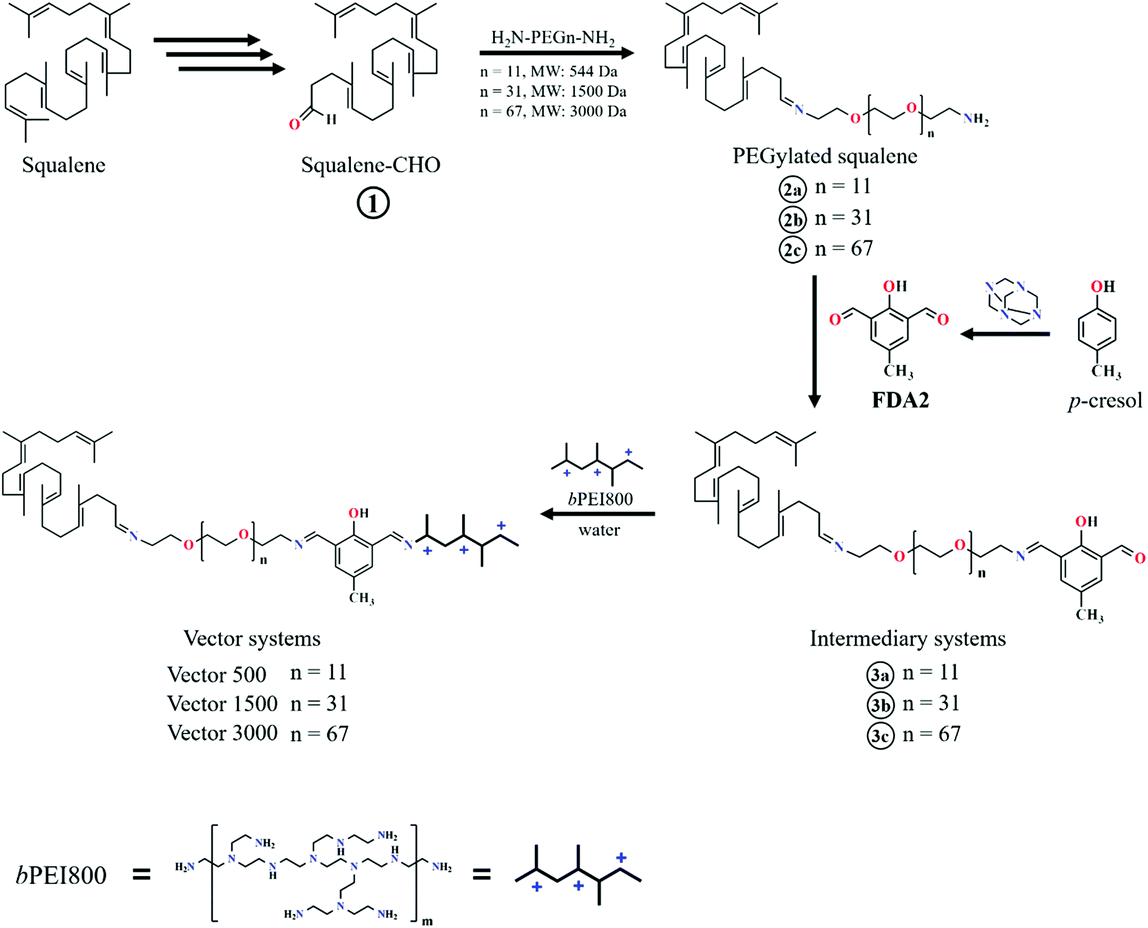
With the aim of understanding this phenomenon, in the present work we investigate the molecular mechanism of how PEG mediates the PEI–DNA complex by means of molecular modelling and an agarose gel electrophoresis measurement. To this end, we have chosen a model system related to our previous work where we already observed some differences in binding in relation to PEG molecular weight transfection.49–52 Each model system has a PEG (of 500, 1500 and 3000 Da) attached to a squalene derivative and been linked to PEI of 800 Da via 2,6-diformyl-4-methylphenol (FDA2), (Scheme 1).
The size and sequence of the DNA in the simulations were the same as in the experiments, namely 25 base-pairs long (5′-CAAGCCCTTAACGAACTTCAACGTA-3′). In parallel, we did perform an agarose gel electrophoresis measurement to investigate the interaction of the synthesized vectors with DNA. These experiments did clearly show that the binding properties of vectors did strongly depend on the PEG length, as also observed in the MD simulations of the same systems performed in a two-step protocol which mimics the experimental preparation of the loaded vectors. In order to maximize the matching between “wet” and “in silico” experiments, the same sizes for vectors and DNA fragments were used in both experiments, requiring sizes of the simulated systems rather large compared to those typically used for this category of polymeric–biopolymeric systems. The simulation time and space lengths allowed explaining the polyplex behaviour by identifying the key mechanisms by which PEG interacts with b-PEI, and elucidating why and how the chain length of PEG impacts the process.
Results
MD simulations
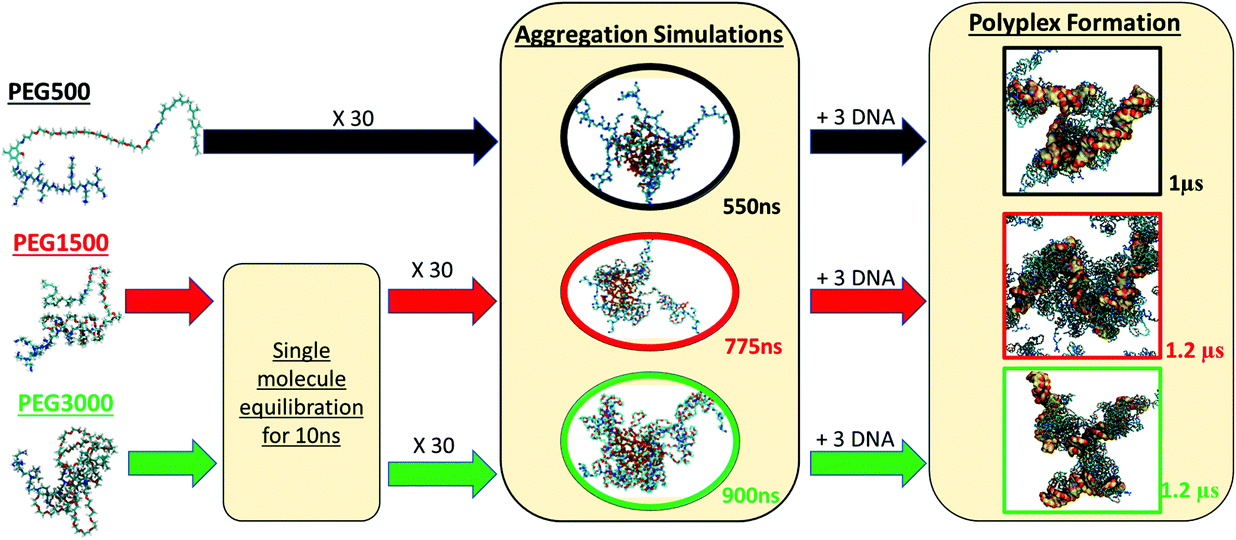
To determine the way that PEG influences the binding of b-PEI to dsDNA, we developed a two-step modelling approach for each polyplex system, as explained in detail in the Materials and methods section. Here we start by describing the preparation of the vector solution, then the micellization of the charged polymers, and thereafter its complexation with the DNA. A summary of the simulation protocol is presented in Scheme 2.Vector solution preparation
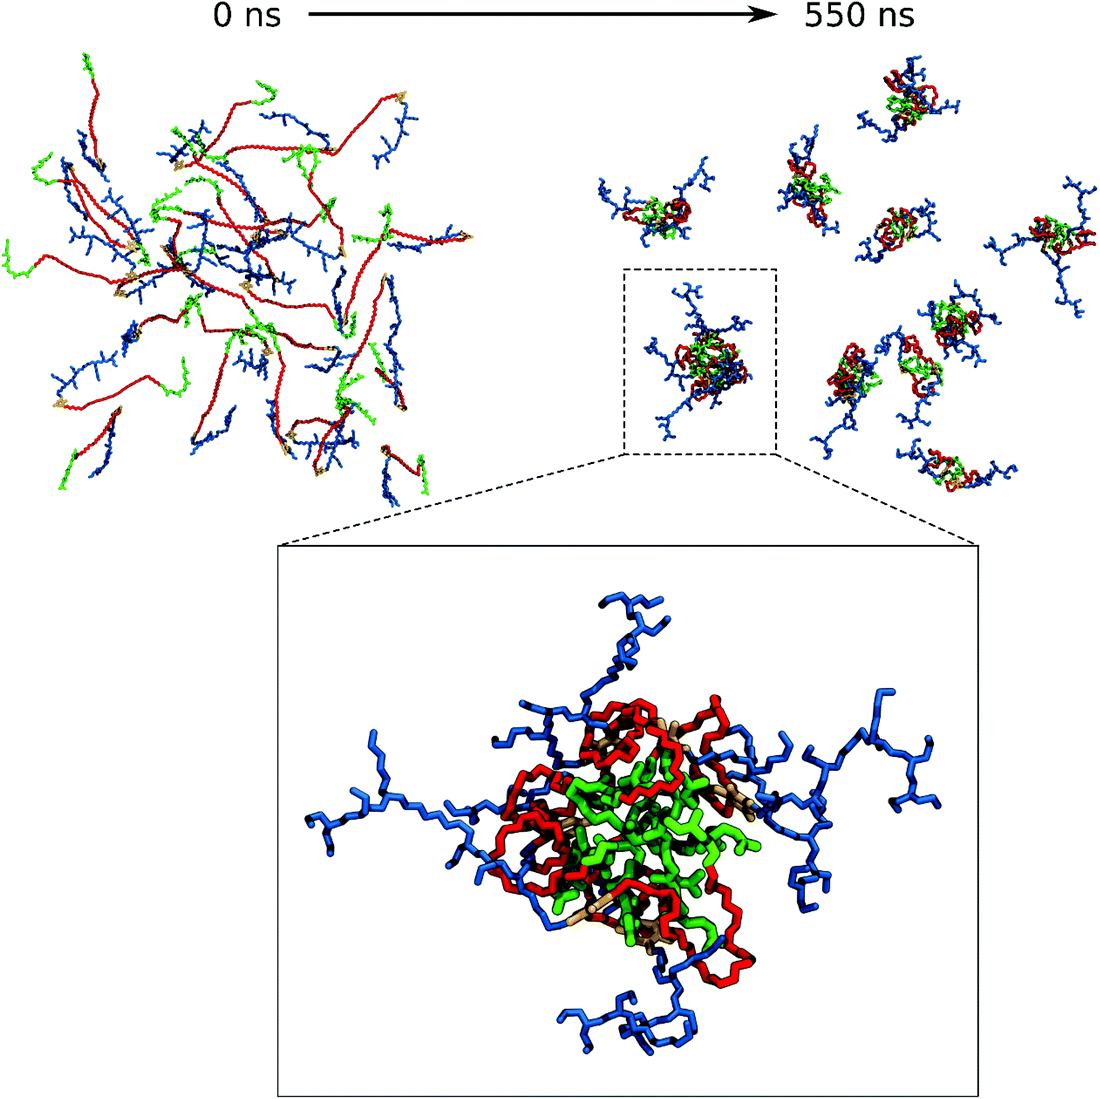
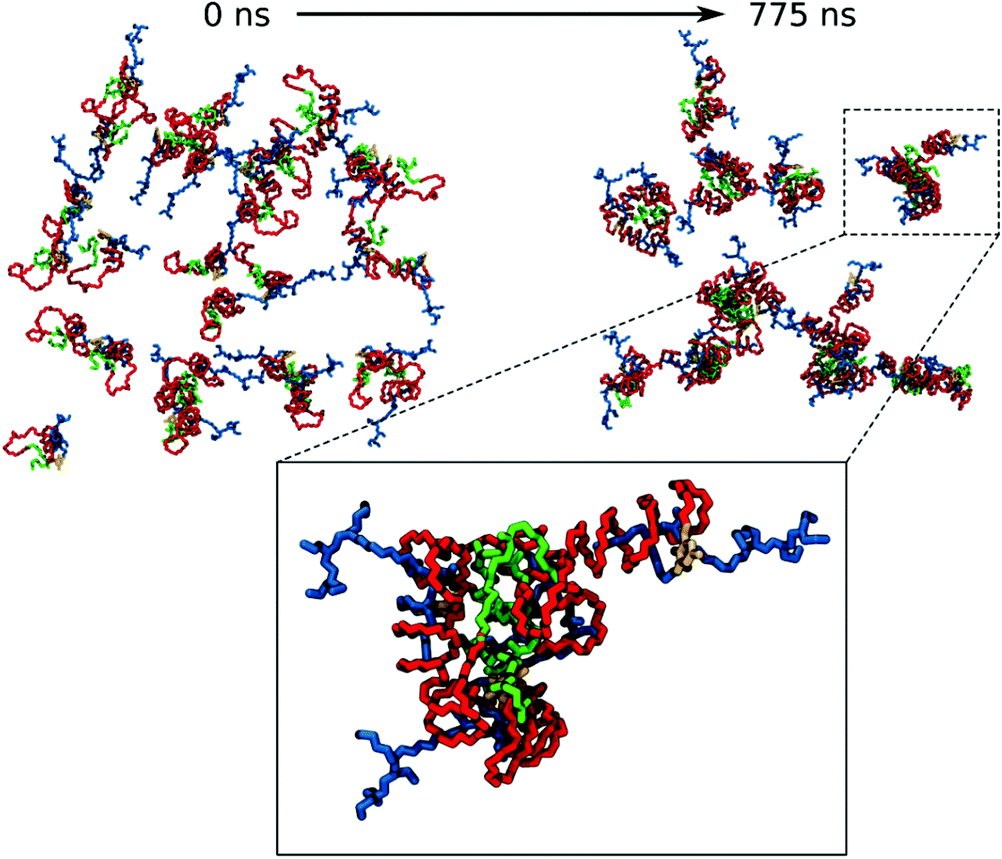
For VECTOR 500 we started the simulations from an extended conformation. Visual analysis of the trajectory shows that the individual molecules quickly collapsed in forming small micelles, already during the first 10 ns. After that, the system remained nearly unchanged for the rest of the simulation (550 ns). Fig. 1 shows the starting and final snapshots of the trajectory. In the latter, we can see that squalene and the FDA2 (in green and yellow in Fig. 1) aggregate in the centre of the micelle, and that the b-PEI moieties (in blue) extend in the solvent. The PEG chains (in red) wrap around the small branches of the b-PEI, forming a middle layer in the aggregate, in between the squalene/FDA2 core and the b-PEI chains.For the VECTOR 1500, as detailed in the Material and methods section, the starting configuration was generated by inserting in the simulation box several copies of the vector molecules already in a slightly compacted form. Since we did observe that in simulating the system VECTOR 500, the originally elongated vector compacted rapidly at the beginning of the simulation without any inter-molecular interactions, we considered it reasonable to start the simulations of the two larger vectors from a slightly compacted form. This allowed to save computing time and use the savings to prolong the simulation, rather than moving an excess amount of water molecules in a very large simulation box after the vector had collapsed. In order to naturally reduce the extended size of the large vector, we performed a simulation of a single vector in a large water box, for 10 ns; during this short simulation, we could see that the vector did behave similarly to the shorter VECTOR 500, adopting a collapsed conformation with the PEG chains wrapped around the b-PEI. After the initial simulation of the single vector, we followed the same protocol as that for VECTOR 500. Fig. 2 shows the starting and final snapshots of the trajectory with details of an aggregate of VECTOR 1500.
Fig. 2 also illustrates how the chain of VECTOR 1500 wrapped itself around a bigger portion of the b-PEI, as compared to VECTOR 500. However, the formed aggregates still show the same structural features as seen for VECTOR 500 with a squalene/FDA2 core, a middle PEG layer and PEI at the outside.
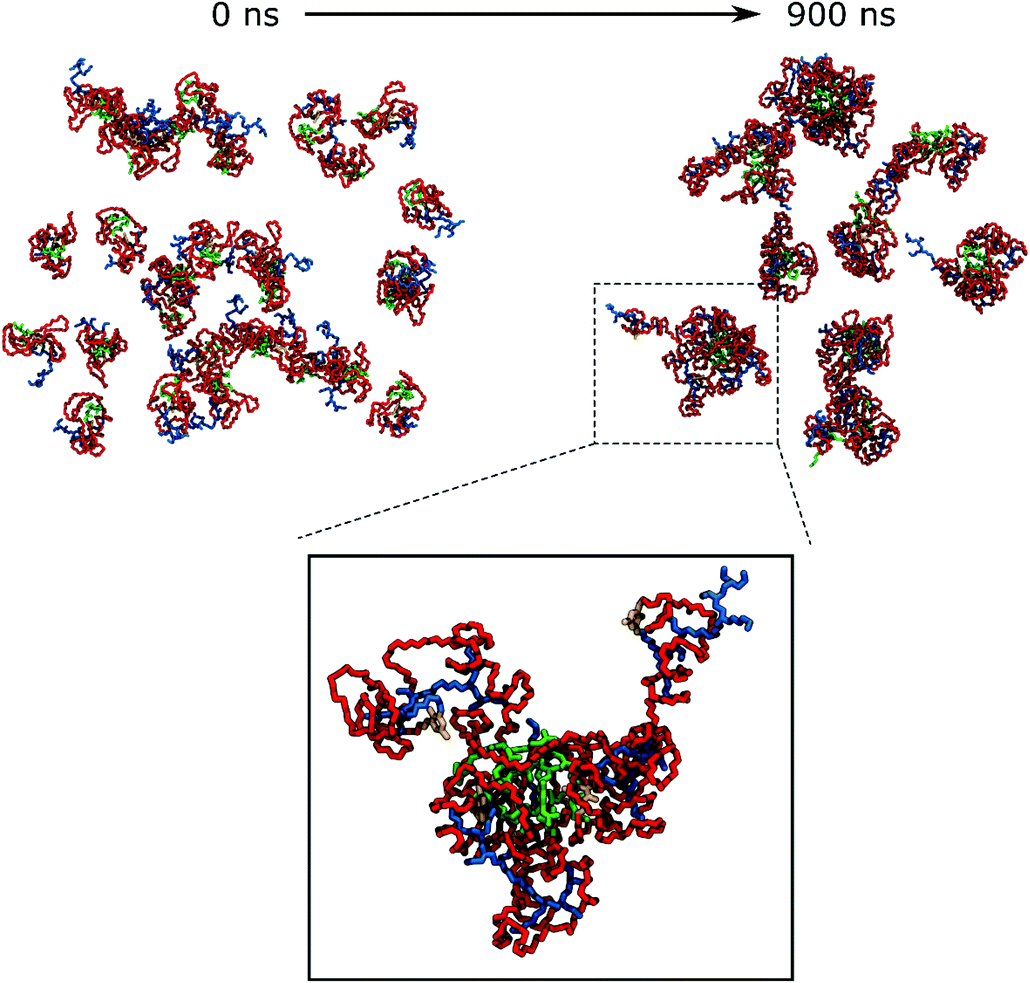
For generating the starting coordinates of VECTOR 3000, we used the same procedure as for the VECTOR 1500, by simulating a single vector in water and allowing it to begin to fold. After that, we simulated the aggregation process for 900 ns. Fig. 3 shows the starting and final snapshots of the trajectory and details of micelle organization. Visual inspection of the trajectory of VECTOR 3000 did show the same behaviour as for the smaller VECTORS 1500 and 500. The main difference is however in the amount of b-PEI wrapped by the PEG chain, which is now much bigger: b-PEI chains have become completely wrapped by PEG.
The aggregation process
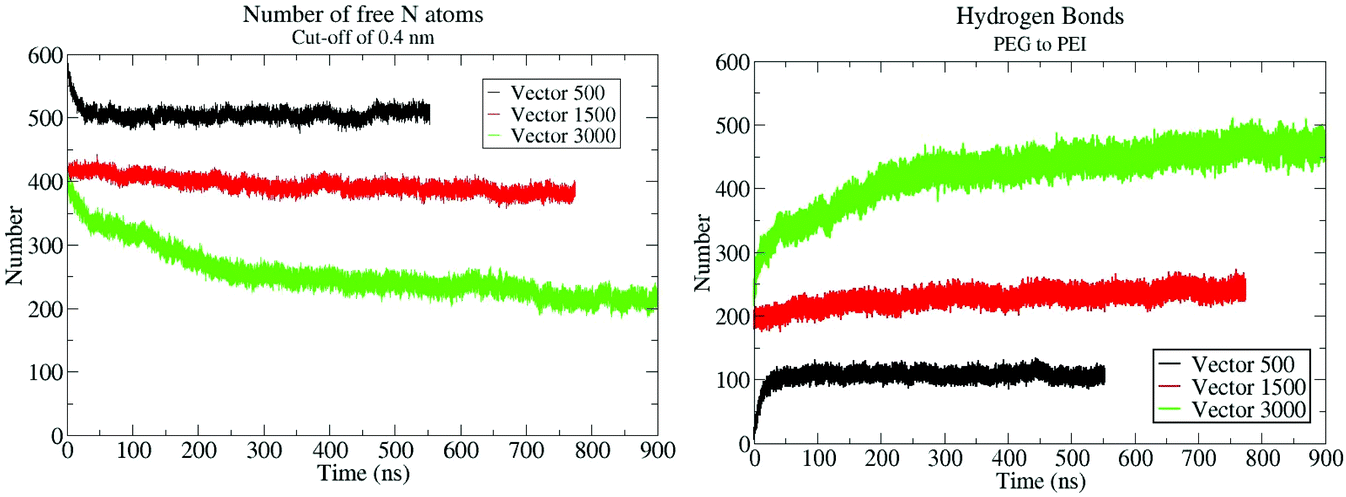
To quantitatively monitor the aggregation process and the interactions between PEG and b-PEI, we have counted the number of b-PEI nitrogen atoms not in contact with PEG (named here “the free-N atoms”), and also the number of hydrogen bonds formed between PEG and PEI. Fig. 4 shows their evolution over time. The counting algorithm automatically excludes the two N atoms linking the PEG with the squalene and the dialdehyde, since they are permanently in contact with PEG.The graph in Fig. 4A shows that for the VECTOR 500 system the number of free-N atoms decreases rapidly during the first 10 ns and thereafter remains constant until the end of the simulation. This is due to the rapid micelle formation, also observed by the visual analysis of the trajectory, with almost no structural changes occurring after micelle formation.
For VECTOR 1500 and VECTOR 3000 systems, the initial number of free N-atoms is smaller than that for the VECTOR 500, although there is the same amount of b-PEI in all three vectors. This is due to the different protocols, described above, used to generate the starting structures for the simulation of the two larger polymeric systems, for which an initial short simulation of a single vector in water was performed. During this period, some intra-molecular PEG–b-PEI interactions were established. In the case of VECTOR 1500, the number of free-N atoms remains almost constant over the simulation simply because PEG had initially formed all the possible intra-molecular H-bonds with the PEI sequence during the initial process. Therefore, when the vector molecules started to aggregate there were no “unbound” PEG polymers left to interact with b-PEI.
For the VECTOR 3000 system, intra-molecular interactions between PEI and PEG were formed during the initial pre-folding process in a similar extent to what observed in the case of VECTOR 1500. However, as shown in Fig. 2 (green), the folding of VECTOR 3000 continues in the simulations with 30 vector molecules, as witnessed by the number of free-N atoms which rapidly decreases during the first 300 ns of simulation. This is due to the fact that, PEG 3000 being twice larger than PEG 1500, the number of “unbound” oxygen atoms able to form intermolecular H-bonds with the neighbouring b-PEI inside the micelle was still large after the 10 ns of MD simulation of a single VECTOR 3000 molecule.
The simulation results also show that PEG chains interact with the protonated N atoms of the b-PEI segment, forming hydrogen bonds, see Fig. 4B. This affirmation is supported also by quantum mechanics calculations discussed later in the text. These interactions are so strong that, once they are formed, the number of total hydrogen bonds remains stable over the entire simulation, and we do not see a large fluctuation of this number. This means that the PEG remains in close contact to the b-PEI throughout the simulation and even if some hydrogen bonds break, they are replaced by new ones immediately. Fig. 4B shows the evolution of the number of hydrogen bonds over time, which is inversely proportional to the number of free-N atoms since the two are directly related.
It was the aim of this work to model in silico and study experimental systems with the same molecular size and composition and physical and chemical working conditions, in order to better follow and analyse the details of the molecular processes and interactions. This is why we have first simulated the process of vector forming starting from the coiling of the polymer components to the micelle formation, followed by wrapping of the aggregated vectors (micelles) around dsDNA (as described in the next paragraph). The performed modelling steps allowed us to follow the formation of every individual H-bond after interplay of long- and short-ranged interactions. At the same time, we were able to compare and verify the simulation results with the experimental ones, obtained for the same systems, synthesized and then complexed with the dsDNA. We did interrupt the simulation of the vector aggregation once we noticed a clear stabilisation of the interactions that later may play a role in the interaction with the DNA (number of free-N atoms, and number of hydrogen bonds between PEG and PEI; see Fig. 4). We did not consider extending the simulations past this point, to a complete equilibration (at a great computational cost), as it would not provide any new or different information.
QM calculation of the PEG-PEI complex
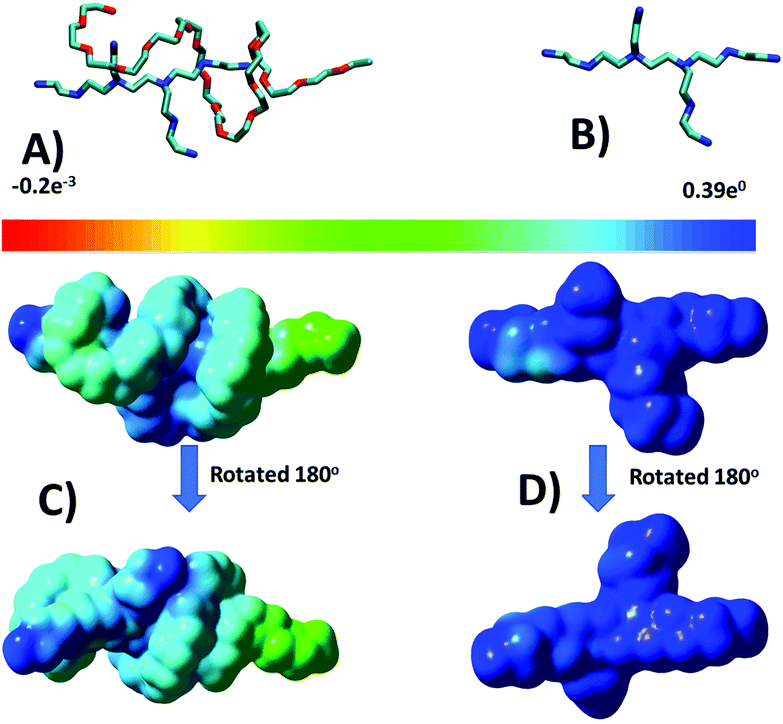
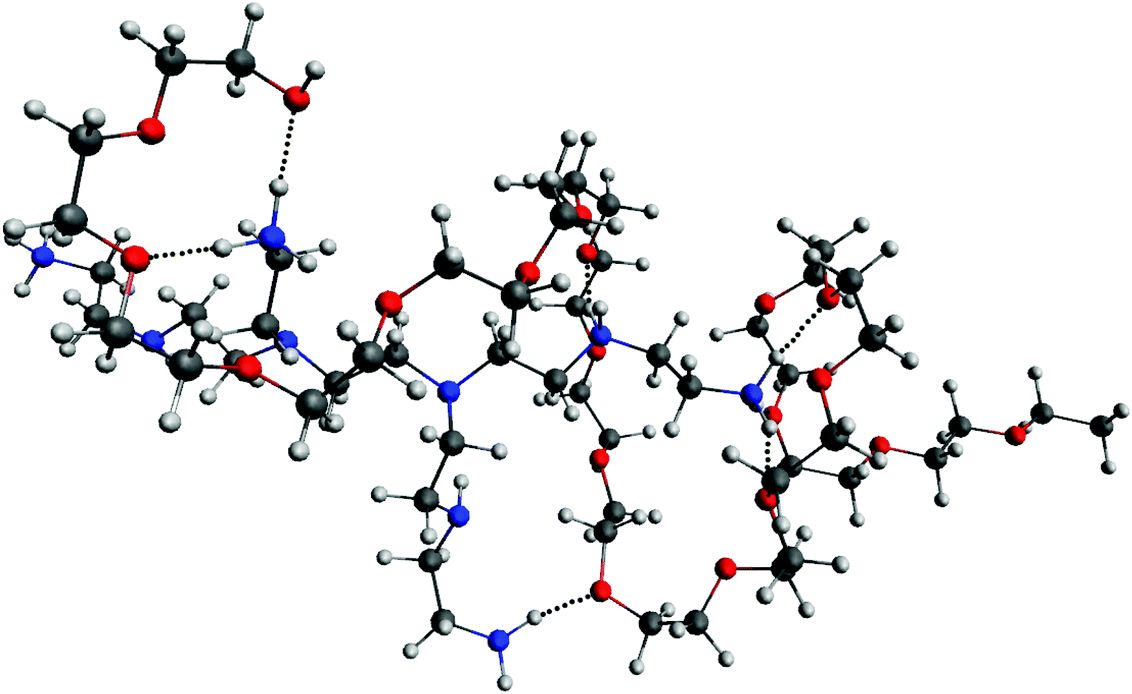
To provide more insight into the results obtained in MD simulations concerning the conformations of the PEG-b-PEI complex, we performed QM geometry optimization and frequency calculations. We chose a complex formed in the VECTOR 1500 simulation that contained fragments from two molecules where the PEG was wrapped around the b-PEI, in a fashion representative of the typical arrangement observed in all the performed simulations. The QM optimized structure is displayed in Fig. 5A, showing how the components of the complex interact with one another, and the corresponding electro-static potential (ESP) is displayed in Fig. 5C.The results from QM calculations (Fig. 5A) confirm the molecular association between PEI and PEG sequences as observed in the classical simulations, thus ruling out that the observed hydrogen bonds could result from the force field parameters. Furthermore, the ESP map indicates that after association of PEG-PEI there is a considerable polarization taking place (Fig. 5C). The computed ESP distribution for an isolated PEI is rather uniform, with a highly positively charged surface (Fig. 5D). The electrostatic interactions between PEI and PEG components lead to polarization of the molecular ESP, due to hydrogen bond associations between the N–H groups (of PEI) and O atoms (from PEG). The hydrogen bond distances are less than 2 Å (ca. 1.85 Å), corresponding to strong interactions (see Fig. 6).
Polyplex simulation
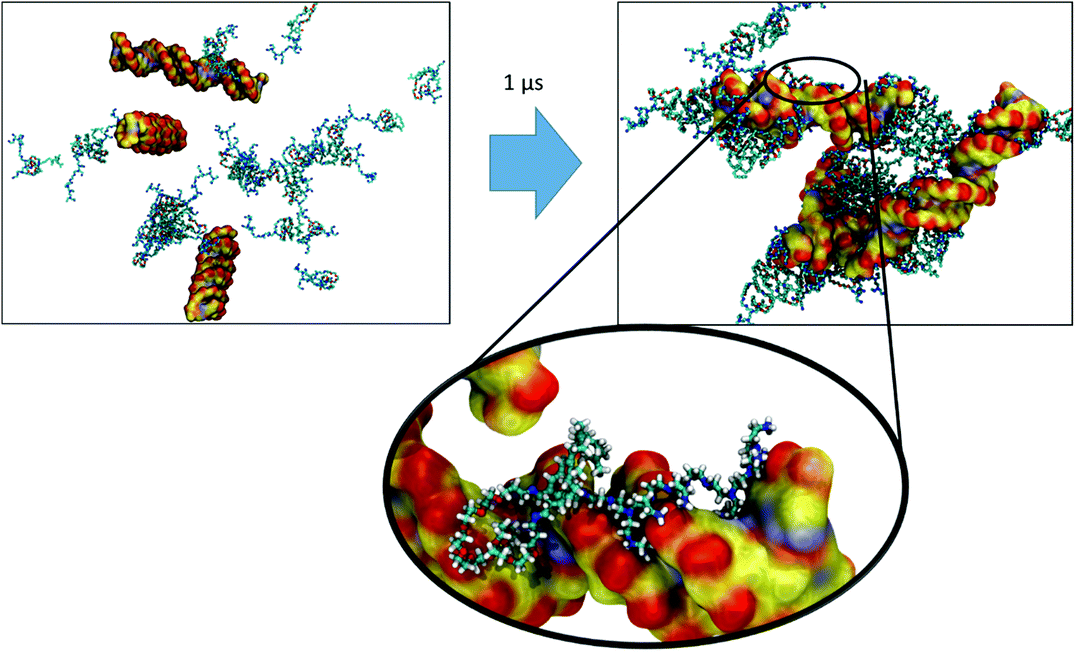
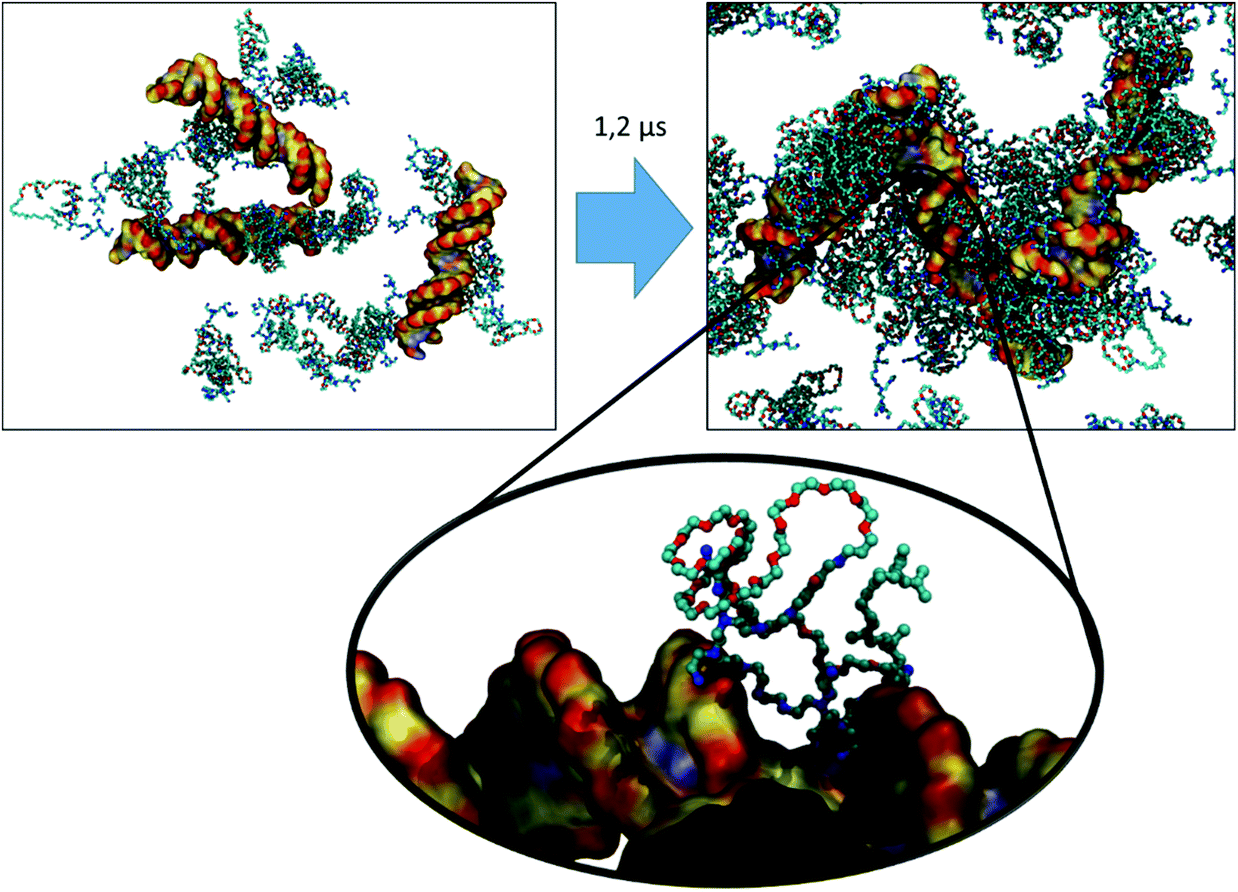
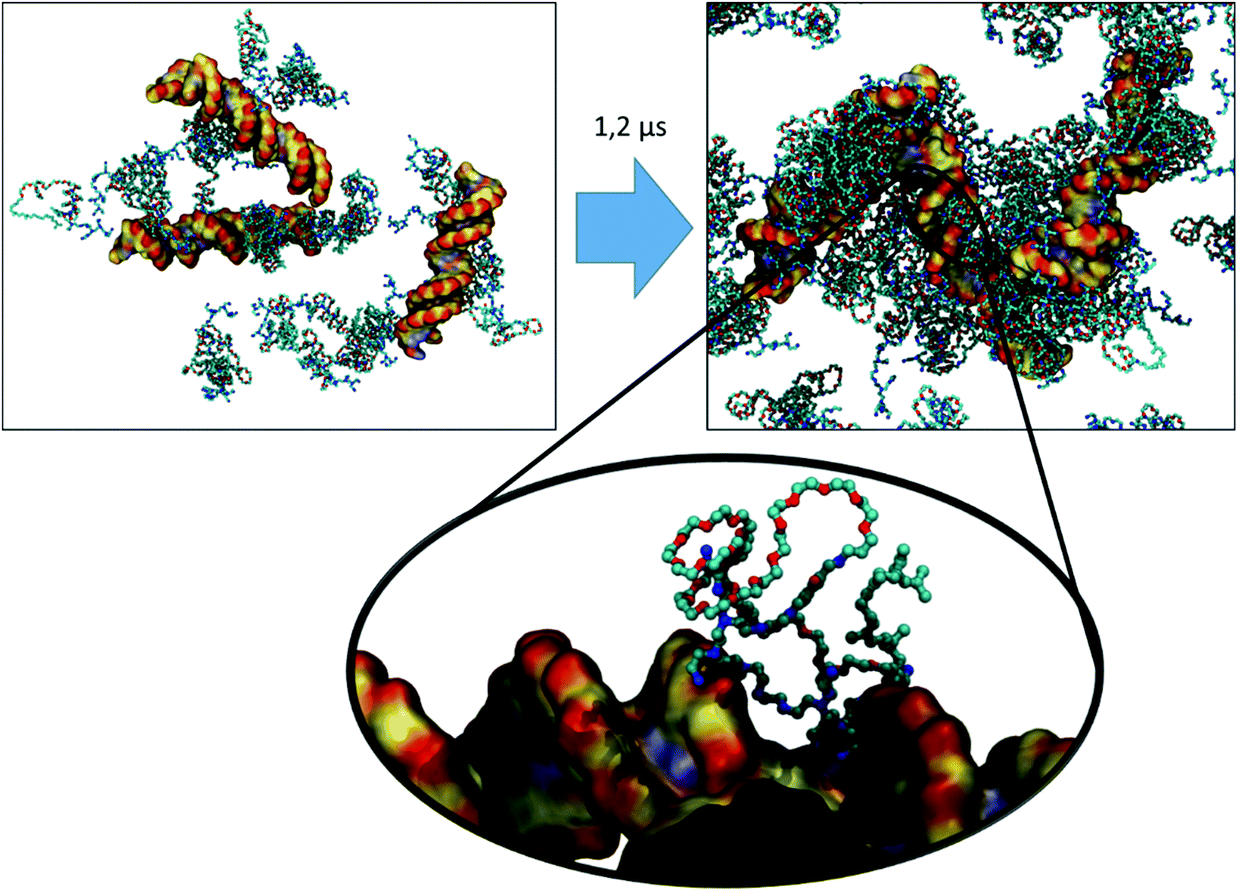
The final configurations from the simulations of each vector were used to generate the starting structures for the simulation of their complexation with the dsDNA. We did first remove the water from the simulation boxes, added three dsDNA 25mers in random positions, and then rehydrated the system by adding water, as well as the necessary ions and counter-ions. Fig. 7, 8, and 9 depict snapshots of the initial and final configurations of each of the vector and DNA systems, together with insets that allow visualizing some details of the interactions between PEI and DNA.Based on the visual analysis of the VECTOR 500 + DNA trajectory (based on the inspection of snapshots as those reported in Fig. 7), it is obvious that b-PEI strongly interacts with the DNA. The micelles stick to DNA, and b-PEI can be seen to interact with both the major and the minor grooves of DNA. In the case of VECTOR 1500 we observe nearly the same interactions as we see for the VECTOR 500 (see Fig. 8). For the VECTOR 3000 system, the visual inspection (Fig. 9) shows that the interactions between b-PEI and dsDNA are hindered by PEG, and a smaller fraction of the polycation is free to interact with DNA, as compared to the other two vector systems. For all the simulated systems, the micelles (supramolecular aggregated vectors) interact with all three added DNA molecules, and the complexation process is mediated by the free-N atoms.
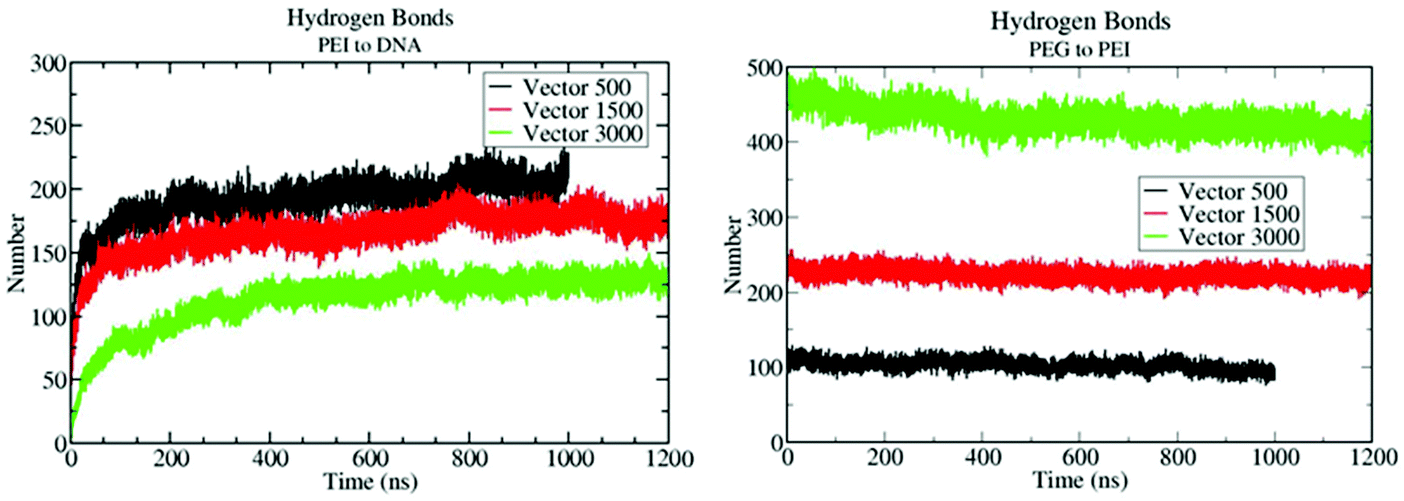
In order to quantitatively determine the binding efficiency, an analysis of the number of hydrogen bonds between b-PEI and DNA was performed. Fig. 10 shows the evolution of the number of H-bonds during the simulation of the complexation processes of the three distinctive vector systems.
According to the graphs in Fig. 10, there are much fewer PEI/DNA H-bonds in the VECTOR 3000 system than in 500 and 1500 ones. The largest number of H-bonds is formed in the case of the VECTOR 500 system. This correlates well with the experimental results (vide infra) and with the number of free-N atoms that were observed in the aggregation simulations discussed above, which decreased on going from VECTOR 500 to VECTOR 3000. The smaller the number of PEI free-N atoms, the more limited the vector's capability to form H-bonds with dsDNA. To find out if PEG chains remain in close contact with the protonated N atoms or if, in contrast, DNA “pushes” them away, we did monitor the number of H-bonds between PEG and b-PEI following the vector/DNA interactions. Fig. 10B shows the evolution of the number of H-bonds and demonstrates the stability of the association between the vectors and dsDNA throughout the entire simulation time intervals in the case of VECTOR 500 or VECTOR 1500, and during the last 500 ns in the case of the VECTOR 3000 system. This indicates that the wrapping of PEG around the N atoms of PEI, as observed in the equilibration of the solution of the vectors, limits the capability of the poly-cationic chains to bind to dsDNA. Also, to better understand the mechanism of interaction between PEI and dsDNA, we compared the number of hydrogen bonds that formed between PEI and the oxygen atoms (OP1 and OP2) from the phosphate groups of the DNA backbone to the number of hydrogen bonds between PEI and the rest of the DNA. Fig. S17, S18 and S19† depict the evolution of the hydrogen bonds between dsDNA and VECTOR 500, VECTOR 1500 and VECTOR 3000, respectively. It can be seen that in all three cases, the number of hydrogen bonds with OP1 and OP2 far exceeds the number of hydrogen bonds with the rest of the dsDNA molecules. This means that PEI prefers to form hydrogen bonds with the backbone of DNA rather than with the bases.
To illustrate the compactness of the polyplex we compared the number of contacts between the water and the vector prior to DNA addition, between the water and DNA before any interaction with the vector, and between the water and the polyplex at the end of the polyplex formation simulation. The contacts are presented in Table 1.
| System | Nr. of contacts water–vectora | Nr. of contacts between water–DNA at the starta | Nr. Of contacts between water–DNA at the endb | Nr. Of contacts between water and polyplexb |
|---|---|---|---|---|
| a Values are averaged for the first 2 ns o the polyplex formation simulation. b Values are averaged for the last 2 ns of the polyplex formation simulation. | ||||
| VECTOR 500 | 35![[thin space (1/6-em)]](https://www.rsc.org/images/entities/char_2009.gif) 692 ± 756 692 ± 756 |
22![[thin space (1/6-em)]](https://www.rsc.org/images/entities/char_2009.gif) 690 ± 269 690 ± 269 |
18![[thin space (1/6-em)]](https://www.rsc.org/images/entities/char_2009.gif) 005 ± 175 005 ± 175 |
54![[thin space (1/6-em)]](https://www.rsc.org/images/entities/char_2009.gif) 772 ± 375 772 ± 375 |
| VECTOR 1500 | 50![[thin space (1/6-em)]](https://www.rsc.org/images/entities/char_2009.gif) 531 ± 683 531 ± 683 |
22![[thin space (1/6-em)]](https://www.rsc.org/images/entities/char_2009.gif) 239 ± 320 239 ± 320 |
18![[thin space (1/6-em)]](https://www.rsc.org/images/entities/char_2009.gif) 371 ± 230 371 ± 230 |
63![[thin space (1/6-em)]](https://www.rsc.org/images/entities/char_2009.gif) 237 ± 720 237 ± 720 |
| VECTOR 3000 | 63![[thin space (1/6-em)]](https://www.rsc.org/images/entities/char_2009.gif) 310 ± 735 310 ± 735 |
22![[thin space (1/6-em)]](https://www.rsc.org/images/entities/char_2009.gif) 570 ± 400 570 ± 400 |
18![[thin space (1/6-em)]](https://www.rsc.org/images/entities/char_2009.gif) 531 ± 527 531 ± 527 |
76![[thin space (1/6-em)]](https://www.rsc.org/images/entities/char_2009.gif) 065 ± 552 065 ± 552 |
We can observe that, as expected, increasing the size of PEG leads to an increase in the number of contacts between the vector and the water molecules. Also, we can see that for all three cases the number of contacts between water and polyplex decreases when compared to the sum of the individual contacts at the beginning of the simulation, which proves the condensation of the DNA by the vector.
Experimental results
Zeta potential measurements
The measured values of the zeta potential of the vectors in solution presented in Table 2 indicate that the surface charge decreases as the PEG length increases. This is in good correlation with the observations made based on the complexation simulations which show that PEG 3000 and PEG 1500 envelope the PEI chains, shielding the charge, while the PEG 500 exposes most of the PEI on its surface.| Vector system | Zeta potential (mV) | Average value (mV) | Standard deviation |
|---|---|---|---|
| Vector 500 | 14.49 | 14.07 | ±0.3007 |
| 13.82 | |||
| 13.89 | |||
| Vector 1500 | 6.10 | 6.67 | ±0.5436 |
| 6.50 | |||
| 7.40 | |||
| Vector 3000 | 4.32 | 5.17 | ±0.6110 |
| 5.73 | |||
| 5.46 |
Agarose gel electrophoresis assay
The ability of the three distinctive vectors to bind dsDNA was evaluated by means of agarose gel electrophoresis assay (Fig. 11a–c). The technique was applied to the polyplexes formed between VECTOR 500, VECTOR 1500, VECTOR 3000 and dsDNA at different N/P ratios (0.5, 1, 1.5, 2, 2.5, 3, 3.5, 4, 4.5, 5 and 10), in comparison with the naked dsDNA as the control sample. It can be seen that the VECTOR 500 system fully binds the dsDNA starting with a N/P ratio of 1.5 by the disappearance of the DNA band (Fig. 11a), while the polyplexes of VECTOR 1500 are formed starting from a N/P ratio of 2.5 (Fig. 11b), and those of the VECTOR 3000 system fully bind dsDNA at a higher N/P value of 3 (Fig. 11c).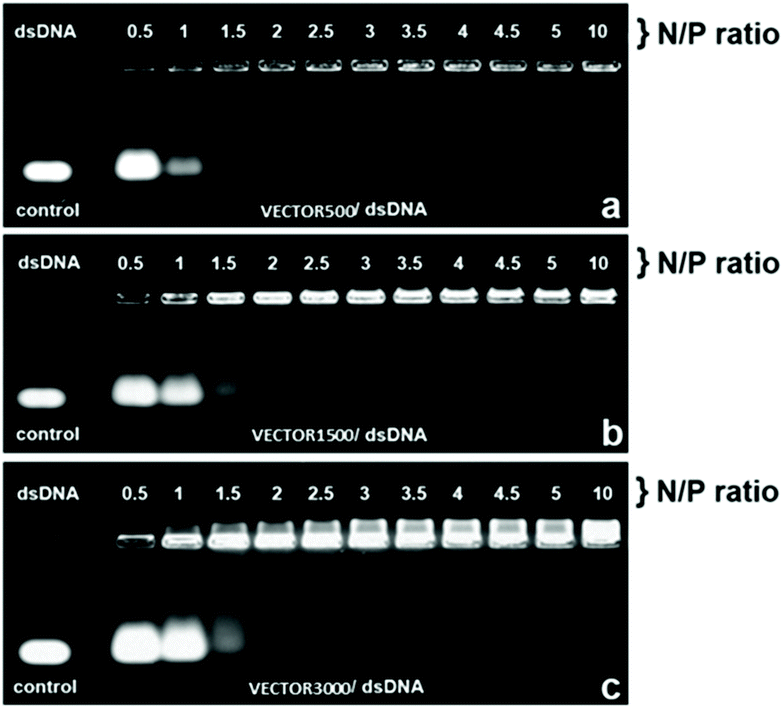 | ||
| Fig. 11 Electrophoretic mobility of the polyplexes formed by the complexation of dsDNA and VECTORs 500, 1500, and 3000, at different N/P ratios. | ||
The observed electrophoretic trend, indicating that increasing the PEG amount in the vectors leads to the requirement of higher amounts of vectors in order to form polyplexes, is fully in line with the zeta potential measurement, which shows higher positive surface charge for VECTOR 500.
Discussion
In this study we have combined closely modelling and simulation with experimental studies. Instead of using a simplified model for the vector and the nucleic acids, as is typically done in in silico studies, we have from the beginning decided to simulate the entire molecules used in the experiments, both for the vector and for the nucleic acids, using exactly the same length and sequence. Although presented as in silico work, there is an extensive amount of work done in the laboratory to synthesize and characterize the vectors and polyplexes of the same sizes as those in the simulation cells. Computationally, we have mimicked the experimental protocol of formation of the vectors by using a two step simulation. In the first step, we generated an equilibrated vector solution. This is of paramount importance for the next step, which involves the interaction of the vector with dsDNA, to form a polyplex. Clearly this study is very computing time demanding but it also gives more direct comparison with experiments and better insight into the complicated process of formation of polyplexes by following the self-assembly of the b-PEI vectors covered by PEG polymers of different sizes to protect them as a stealth shield during the delivery and finally how they package a short dsDNA (here 25 bp). The main task here was to understand the interactions and impact of PEG on the b-PEI while binding to DNA, with the aim to give a criterion to choose the optimal relative amount of PEG based on its local structural and interaction characteristics within the polyplex.Important insight into the interactions of nucleic acids with polycationic polymers can already be obtained by using simple model systems of rather limited sizes compared to corresponding experimental systems.27,28,53,54 However, considering that the focus on this study is on the effect of the relative amount of the “stealth” agent vs. the polycation on the binding to DNA, and that charge polymer “end effects” are known to affect the electrostatic interactions, we did limit the gap between the computational and experimental systems, by using vector and DNA molecules of the same size in the “in vitro” and “in silico” experiments. This implied simulating quite large systems (75 base pairs of DNA + 30 vector molecules + solvent molecules totalling to ∼325k atoms), which required also large equilibration time, and thus, simulations in the microsecond time scale. The followed protocol allowed us to both explain and unify previous computational and experimental findings on similar and related vectors for gene delivery. Indeed, the simulations allowed reproducing the polyplex formation starting from both multicomponent (several segments with distinct reactivity included in the same molecule) and multiple (several identical and cooperative molecular entities able to associate at the supramolecular scale) vectors. As an approach to realistically model these complex systems, we did first produce a balanced vector aqueous solution before inserting the dsDNA molecules into the system. We consider the first phase necessary, because in the corresponding experiments (i) the synthesized vectors are prone to first spontaneously generate compact micelles in aqueous solution whereafter forming complexes with the added DNA, and (ii) the amplitude and strength of the interactions between vectors and DNA are dependent on the initial spatial arrangement of the vector molecules. During preliminary studies we observed that if the MD simulations were started from non-equilibrated extended vectors, which cannot actually stably exist in solutions, strong and excessively stable interactions between b-PEI and DNA did develop quickly leading to non-realistic and non-balanced structures. In real experiments this situation cannot occur, because the vectors are natively equilibrated in aqueous solution before coming into contact and interact with DNA. The strategy of performing the simulation in two stages allowed us to obtain computational results in very good agreement with the experimental observations. Indeed, the zeta-potential measurements indicate that the surface charge of the vectors decreases by increasing the relative amount of PEG (the length of PEG segment) in the vector molecule, in full accordance with the structure of the aggregate obtained by simulations. This feature is illustrated in Fig. 12, depicting the local folding of the tested molecules as gene vectors.
It was previously observed that the PEG length or grafting density influences the physico-chemical properties, such as the zeta potential, particle size, and aggregation propensity of the gene vectors in contact with them, both in vitro and in vivo, and thereby also their DNA-binding efficiency.43,45,46,55 However, the mechanism of action remained elusive. Our simulations at the atomistic level that are confirmed by complementary QM calculations reveal that the formation of hydrogen bonds between the protonated nitrogen atoms of b-PEI and the oxygen atoms of PEG represents the key binding mechanism between these two components of the vector.
The length of the PEG segment has shown to have an important effect on the pattern of its interactions with b-PEI. In the case of VECTOR 500, PEG mostly winds around the b-PEI side chains, forming occasional single loops which encompass nitrogen atoms. These interactions appear especially on the side of the b-PEI bound to FDA2, leaving free the most part of the molecule surface. The simulation of VECTOR 1500 showed that extending the PEG length while keeping the b-PEI length constant leads to a rudimentary helical local architecture, with PEG forming multiple loops around an entire side chain of b-PEI, or even around multiple sidechains. Obviously, the PEG/PEI interactions involve an extended portion of the b-PEI segment of VECTOR 1500, as compared to the particular folding of VECTOR 500. In the case of VECTOR 3000, we observed the formation of a dual architecture, consisting both of winding and coiling of the PEG segment, which almost cover the entire b-PEI segment. This fact correlates with the number of available free-N atoms (see Fig. 4), which clearly indicates that for VECTOR 3000 the number of free-N atoms is very small. It is important to highlight how relevant is the length of the b-PEI chains on the polyplex conformation, and that simulation with smaller polyamines may lead to a less conclusive picture. Indeed, Meneksedag-Erol et al.29 observed that the binding between PEG and relatively small polyamines (of up to 7 monomer units) leads to transient collapsed conformations, while according to our calculations PEG remained collapsed on b-PEI for the entire simulations. This is due to the larger molecular mass of b-PEI, both for the synthesized and the simulated vectors, permitting the formation of a considerable number of hydrogen bonds with the PEG segment, thus stabilizing the collapsed structure.
The results of our simulations are confirmed and validated by an excellent agreement with the results of laboratory experiments. The atomistic details and interactions that we observed in the MD simulations explain very well the differences in the vector's zeta-potential. Indeed, the higher surface charge of the VECTOR 500 when compared to VECTORS 1500 and 3000, as revealed by the data in Table 2, can be explained by the localization of the PEG chain in the aggregates, observed in the MD simulations. In the case of VECTOR 500, PEG forms an intermediate layer between the squalene core and b-PEI, placed at the exterior of the assembly (details shown in Fig. 1). For the other two vectors, the bigger size of the PEG chain allows winding and coiling around a larger portion of b-PEI, thus generating a mixed outer layer of both PEG and b-PEI, an effect being predominant in the case of VECTOR 3000.
The simulation data of the studied polyplexes allow us to explain the results of gel electrophoresis assays, which indicate that the length of the PEG moiety plays a crucial role in the ability of the systems to bind the dsDNA. In fact, the experiments show that when a shorter PEG segment is involved, the binding of dsDNA occurs at very low N/P ratios. According to our simulations, VECTOR 500 is able to interact more strongly with DNA as compared to the larger vectors, mainly because of the presence of b-PEI in the outer layer. This allows it to establish multiple hydrogen bonds with DNA and therefore to bind to it at a very low N/P ratio. For the larger vectors, a complete binding takes place at a higher N/P ratio, a fact that is well explained by the simulations, indicating how PEG shields the b-PEI charges, also acting as a physical distancing barrier between b-PEI and DNA.
Understanding the shielding phenomenon is important for the rational design of nucleic acids vectors, which require an adequate balancing between the reasonable N/P ratio and the water solubility. Indeed, longer PEG improves water solubility but also increases the N/P ratio, which in turn leads to a higher toxicity. Our study highlights that in the case of sophisticated vectors, including multiple and chemically distinctive building blocks, the process of polyplex formation cannot be studied by separately modelling the interactions between the individual vector components and the nucleic acids, because of the inherent interactions among all building blocks, which ultimately determine the particular binding mechanism.
Conclusions
Recent advances in computer power have made it possible to simulate increasingly bigger systems for longer periods of time. This opens the opportunity to simulate multi-block complex polymer systems, to understand all the interactions that take place between their components. In this investigation we have used large scale simulations to obtain a complete picture of the interactions that take place between a b-PEI based non-viral vector and dsDNA. The efficiency of this system as a non-viral vector and its transfection mechanisms will be the topic of a forthcoming study. The simulations, combined with the measurements of zeta-potential and gel electrophoretic assays, showed that the capability of b-PEIs to bind dsDNA is greatly influenced by the length of the PEG that is used as a stealth and biocompatibility agent with no direct role in DNA binding. Indeed, increasing the length of the PEG chain leads to an increase in the interactions between PEG and b-PEI, which in turn hinders DNA binding to the vector. The interactions between the studied non-viral vector components consist of multiple hydrogen bonds that form between O atoms of PEG and H atoms of the protonated amine groups of b-PEI. The hydrogen bonds hamper the DNA binding by two mechanisms: (i) local neutralization of the charges of the b-PEI by the O atoms, and (ii) steric hindrance, due to the PEG winding and coiling around the PEI branches, effectively “burying” the protonated N atoms.Our simulations demonstrate that equilibrating the vector solution, with several hundreds of ns long MD, in prior to adding the DNA leads to the formation of a large network of interactions between the vector components, which are largely kept also after the addition of DNA and thus have an important role in its binding. The employed two-step simulation approach mimics the experimental procedure and gives a better understanding of all the mechanisms having a role in DNA binding. All the simulations were found in agreement with the experimental measurements, with the final aggregates of the vectors obtained in the simulation explaining the zeta potential results, and the trends observed in DNA binding matched the trends obtained in the gel electrophoresis experiment. These findings have important implications for the rational design of non-viral genetic vectors, revealing, at the molecular level, how the molecular mass of the widely used stealth agent, PEG, affects the nucleic acid binding to the cationic polymers.
Materials and methods
Molecular dynamics simulations
The studied vectors have the general structure shown in Scheme 1 and they are name-coded by the PEG chains molecular weight, in Daltons, and referred here to as VECTOR 500, VECTOR 1500 and VECTOR 3000. The corresponding number of repeating PEG units (n) is 11, 31 and 67, respectively. The starting structures and configurations of the vectors were built using the Avogadro software.56 Based on their pKa values,57 the amine groups of the b-PEI fragment are considered being 50% protonated, giving a net charge of +10. The simulated DNA fragment comprises 25 base pairs with the sequence 5′-CAAGCCCTTAACGAACTTCAACGTA-3′, and was built using the Ambertools18 software.58 The total charge of the DNA molecule is −48. The parametrization of the vector was performed using the GAFF2 force field methodology.59 The partial atomic charges of the vector were calculated using the RESP scheme.60 The Amber FF14SB DNA.bsc1 force field61 was used for DNA, and the ionsjc_tip3p62 parameters were used for the ions. This parametrization protocol was used in our group for other compounds with good results63,64To better emulate “real-life” conditions of the complexation of the vectors with dsDNA, a two-stage simulation protocol was implemented, with “aggregation” followed by “complexation”. Aggregation refers to the production of the vectors by micellization and complexation to the formation of the polyplexes by the vectors wrapping around the dsDNA.
In the first stage, we have simulated the aggregation process (micellization) of the vector itself in an aqueous solution by randomly distributing 30 vector molecules in a cubic box of 15 nm side length. We then added the water molecules and enough Cl− ions to electro-neutralize the system. For the shortest vector (having 11 PEG units), an extended initial conformation was chosen (see Fig. 13A as an example). In the case of the other two vectors with much longer PEGs (n = 31, and n = 67, respectively), starting from extended polymer conformations is currently unfeasible after largely increasing the size of the water box and the number of solvent water molecules. Using the same 15 nm box initially for even the longer vectors and having their conformations extended would most likely lead to artefacts caused by the periodic cubic boundaries (formation of trans PBC networks, see Fig. S1 in the ESI†). To avoid these types of problems we did first immerse one single long polymer (n = 31, and n = 67, respectively) in a large enough water box and did simulate it until it spontaneously collapsed (see Fig. 13B and C) within a 10 ns simulation. These pre-collapsed conformations were then used in production simulations of the aggregation process, following the same protocol as for the VECTOR 500.
The second stage consisted of the complexation of the previously modelled vectors and dsDNA to form the polyplexes. In this respect, we started using the final structures from the aggregation simulations, removed the water molecules, inserted randomly three 25 bp dsDNA molecules, and added water molecules and the ions to neutralize the net charge of the entire system and to simulate the system in physiological salt concentration, i.e. 0.15 M. The three DNA molecules that we added lead to an N/P ratio of about 5, which is a typical N/P ratio at which PEI-based vectors start to bind DNA completely. Details of different simulation compositions are given in Table 3.
| System | Number of waters | Number of Na+/Cl− | Simulations box size (Å) | Total simulation time |
|---|---|---|---|---|
| a The decrease in the box size is due to solvent equilibration. | ||||
| 30 VECTOR 500 | 104![[thin space (1/6-em)]](https://www.rsc.org/images/entities/char_2009.gif) 855 855 |
0/300 | 148 × 148 × 148 | 550 ns |
| 30 VECTOR 1500 | 103![[thin space (1/6-em)]](https://www.rsc.org/images/entities/char_2009.gif) 727 727 |
0/300 | 148 × 148 × 148 | 775 ns |
| 30 VECTOR 3000 | 101![[thin space (1/6-em)]](https://www.rsc.org/images/entities/char_2009.gif) 873 873 |
0/300 | 148 × 148 × 148 | 900 ns |
| 30 VECTOR 500 + 3 DNA | 100![[thin space (1/6-em)]](https://www.rsc.org/images/entities/char_2009.gif) 727 727 |
314/470 | 146 × 146 × 146a | 1 μs |
| 30 VECTOR 1500 + 3 DNA | 99![[thin space (1/6-em)]](https://www.rsc.org/images/entities/char_2009.gif) 731 731 |
312/468 | 146 × 146 × 146a | 1.2 μs |
| 30 VECTOR 3000 + 3 DNA | 97![[thin space (1/6-em)]](https://www.rsc.org/images/entities/char_2009.gif) 345 345 |
304/460 | 146 × 146 × 146a | 1.2 μs |
All MD simulations were performed with the GROMACS65 software, with a time step of 2.5 fs, using the particle mesh Ewald (PME)66 to treat the electrostatic interactions. Periodic boundary conditions (PBC) were used with a cut-off of 10 Å for the van der Waals interactions, and applying the LINCS algorithm67 to constrain all bonds. Production simulations were carried out at constant volume and temperature (NVT). For the temperature control we employed the Nose-Hoover thermostat, and for pressure in the NPT simulations we used the Parrinello–Rahman barostat. The simulated temperature was 293 K and the pressure was 1 bar, with the isotropic coupling. All simulations were visualized with VMD, and the analysis of the trajectories was performed using the tools in GROMACS and in-house scripts. The length of the MD trajectories and other details of the simulations are presented in Table 3.
QM calculations
To bring more insight into the complexing mechanisms we extracted a snapshot of a small typical sequence (composed of 208 atoms) of a PEG fragment wrapped around a PEI fragment from the MD trajectories and performed ab initio calculations using the GAUSSIAN software68 to compute the surface charges and electrostatic potential (ESP) of the complex. The sequence shows a stable intermolecular complex PEI and PEG. The complex was further optimized at the B3LYP 6-31+G(d,p) level of theory. The optimized equilibrium geometry was also checked by frequency calculation and no negative values were obtained.Experimental
There are several reasons for the extended Experimental section below. First, because of the specific simulation approach to closely mimic the experimental protocols in producing the polyplexes from micellized vectors in water solution we wish to describe the experimental part in details. It helps to understand the corresponding simulation protocol which is quite different from other similar in silico studies. The synthesis of the multicomponent system itself (Fig. 13) and the synthesis pathway (Fig. 14) are very much in the focus throughout this paper. Finally, since we use the same systems in the simulation and in the experiments as for the size and physical conditions as close as possible it is important to include all the details as we refer to them frequently.Chemicals
Squalene (from Sigma-Aldrich, Germany, ≥98%), poly-(ethyleneglycol)-bis(amine) (average MW 544 Da – PEG-544) (from Broadpharm, >98%), poly-(ethyleneglycol)-bis(amine) (average MW 1500 Da – PEG-1500) (from Sigma-Aldrich, Germany, >98%), poly-(ethyleneglycol)-bis(amine) (average MW 3000 Da – PEG-3000) (from Sigma-Aldrich, Germany, >98%), p-cresol (from Acros-Organics, >99%), branched polyethylenimine, (average MW 800 Da – b-PEI-800) (from Sigma-Aldrich, Germany, >99%), and the DNA sequences 5′-CAAGCCCTTAACGAACTTCAACGTA-3′ were purchased from Metabion AG (Planegg/Steinkirchen, Germany), diluted to a concentration of 100 μM and used as a stock solution. All the other reagents were purchased from commercial sources (Sigma-Aldrich, Acros-Organics, Merck, Tokyo Chemicals Industries, Fluka, etc.) and used without purification.Nuclear magnetic resonance (NMR) spectra, presented in the ESI,† were recorded on a Bruker Avance III 400 instrument operated at 400 and 101 MHz for 1H and 13C nuclei, respectively, at room temperature (24 °C). Chemical shifts were reported in ppm, and referred to tetramethylsilane (TMS) as the internal standard. Samples were prepared as usual; briefly, approximatively 30 mg of completely dried compound were solubilized into an NMR tube in 0.6 mL deuterated chloroform (CDCl3). Obtained spectra were edited with MestReNova 6.0.2-5475, from Mestrelab Research S.L.
Preparation of dsDNA was accomplished according to an earlier published paper of Vasiliu T. et al.69 Briefly, dsDNA stock solution was prepared by annealing sense and antisense DNA strands as follows: 100 μL DNA sense strand, 100 μL DNA antisense strand, 75 μL 10× TAE at pH = 7.4 (40 mM Tris, 2 mM acetic acid and 1 mM EDTA) and 37.6 μL NaCl 1 M solutions were mixed together, heated at 90 °C and cooled to room temperature (24 °C) for a 30 minutes period, using a Veriti 96 well Thermal Cycler (from Applied Biosystems, Singapore). A final volume of 312.6 μL was obtained as dsDNA stock solution, which was stored at −20 °C, for further experiments.
Preparation of the dsDNA sample to correspond the polyplex simulations
Polyplex formation was conducted according to previously described protocols,49,51 at pre-calculated N/P ratios (content of nitrogen ‘N’ from polyethylene imine in vectoring systems, and the content of phosphate groups ‘P’ of dsDNA). dsDNA stock solution (1 μg/μL) was mixed with an appropriate amount of MD solutions at N/P ratios of 0.5, 1, 1.5, 2, 2.5, 3, 3.5, 4, 4.5, 5, and 10, and incubated under ambient conditions for 30 to 60 minutes to generate vector/dsDNA polyplexes.Agarose gel retardation assay was applied to electrophoretically evaluate the formation of the polyplexes between dsDNA and the investigated vector systems. Both the naked dsDNA and the obtained polyplexes at different N/P ratios were mixed with loading buffer (10× TAE buffer, pH 7.4) and sucrose (25%) and then loaded in a 1% agarose gel. Electrophoresis was carried out at 90 V, for 60 minutes, in 1× TAE running buffer solution (40 mM Tris-HCl, 1% glacial acetic acid, 1 mM EDTA). The migration of free and complexed dsDNA was visualized and photographed under UV light, using a MiniBIS Pro system from (DNR Bio-Imaging), after staining with ethidium bromide (15 μL of 1% ethidium bromide in 300 mL double distilled water) and incubated for 20 minutes in the dark under ambient conditions.
Zeta potential was evaluated using a DelsaNano C Submicron Particle Size Analyzer from a Beckman Coulter, equipped with dual 30 mW laser diodes emitting at 658 nm. The instrument uses electrophoretic light scattering (ELS) to measure the ζ-potential, which determined electrophoretic movement of charged particles under an applied electric field. The analysis was performed at 25 °C, and the final results represent an average of three repetitions. Each sample was dispersed in ultrapure water to obtain a concentration of 0.5 mg mL−1, with a final volume of 2 mL. The analysis mode used the Smoluchowski conversion equation and the measurements were performed using a Flow Cell module with the following software settings: accumulation times – 50 (ten accumulations in five different points), scattering angle – 15°, correlation method – TD, attenuator 1–0.9%, attenuator 2–5.42%, pinhole – 50 μm, average current – 0.07 mV, and average electric field – 16.52 V cm−1. The obtained results were processed with Delsa Nano Software Version 3.73 from Beckman Coulter Inc.
Synthesis of the vectors
The synthesis pathway for the 3 vectors is presented in Fig. 14. A detailed description of each step is available in the ESI.†MALDI-TOF analyses
Mass spectra were acquired on a Bruker Rapiflex MALDI-TOF (Bruker Daltonics, Bremen-GERMANY) equipped with a Smartbeam 3D laser. FlexControl (Bruker Daltonics, Version 4.0) was used to optimize and acquire data using the following parameters: positive ion polarity in reflectron mode, mass scan range (m/z 100–9000), digitizer (5 GHz), detector voltage (2079 V), 1000 shots per pixel, and 10 kHz laser frequency. The laser power was set at 60% to 90% of the maximum and 6000 laser shots were accumulated for each spectrum. All samples were analysed using 2,5-dihydroxybenzoic acid (DHB, Sigma, Switzerland) or α-cyano-4-hydroxycinnamic acid (CCA, Sigma-Aldrich, Switzerland) as the matrix.![[thin space (1/6-em)]](https://www.rsc.org/images/entities/char_2009.gif) :
:![[thin space (1/6-em)]](https://www.rsc.org/images/entities/char_2009.gif) 1, v/v) and vortexed one minute until fully dissolved.
1, v/v) and vortexed one minute until fully dissolved.
α-Cyano-4-hydroxycinnamic acid (CCA, MW 189.17 Da), 30 mg was dissolved in a 1 mL mixture of acetonitrile (AN)/dd H2O (2![[thin space (1/6-em)]](https://www.rsc.org/images/entities/char_2009.gif) :
:![[thin space (1/6-em)]](https://www.rsc.org/images/entities/char_2009.gif) 1, v/v) and vortexed one minute until fully dissolved.
1, v/v) and vortexed one minute until fully dissolved.
PEG 1500 (1 mg) was dissolved in 1 mL dd H2O.
PEG 3000 (1 mg) was dissolved in 1 mL dd H2O.
PEI 800 (1 mg) was dissolved in 1 mL dd H2O.
VECTOR 500 (MD1) 1 μL from stock solution (see ESI 5a†) was dissolved in 100 μL ddH2O.
VECTOR 1500 (MD2) 1 μL from stock solution (see ESI 5b†) was dissolved in 100 μL ddH2O.
VECTOR 3000 (MD3) 1 μL from stock solution (see ESI 5c†) was dissolved in 100 μL ddH2O.
Samples were deposited on the MALDI plate as described in Table S1.†
Conflicts of interest
The authors declare no conflicts of interest.Acknowledgements
A. L. thanks the Swedish Research Council (VR) for continuous support. The simulations were performed on resources provided by the Swedish National Infrastructure for Computing (SNIC) at PDC Center for High Performance Computing. This work was supported by a grant within the frame of the Complex Projects Partnership Program – PCCDI, under authority of Romanian National Authority for Scientific Research – UEFISCDI, project code PN-III-P1-1.2-PCCDI-2017-0083 (37PCCDI/2018). This research was also partially funded by the Ministry of Research and Innovation, CNCS – 546 UEFISCDI, project number PN-III-P4-ID-PCCF-2016-0050, within PNCDI III and from a grant of Ministry of Research and Innovation, CNCS-UEFISCDI, project number PN-III-P1-1.1-TE-2016-1180, within PNCDI III, and by Regione Autonoma della Sardegna (RASSR81788-2017).References
- E. Hanna, C. Remuzat, P. Auquier and M. Toumi, Gene therapies development: slow progress and promising prospect, J. Mark. Access Health Policy, 2017, 5(1), 1265293 CrossRef PubMed.
- D. A. Bleijs, Gene Therapy Net 2019 [cited 2020 2]. Available from: http://www.genetherapynet.com/gene-therapy-products-on-the-market.html.
- S. Daya and K. I. Berns, Gene therapy using adeno-associated virus vectors, Clin. Microbiol. Rev., 2008, 21(4), 583–593 CrossRef CAS PubMed.
- P. Neuberg and A. Kichler, Recent developments in nucleic acid delivery with polyethylenimines, in Advances in genetics, Elsevier, 2014, vol. 88, pp. 263–288 Search PubMed.
- B. R. Olden, Y. Cheng, L. Y. Jonathan and S. H. Pun, Cationic polymers for non-viral gene delivery to human T cells, J. Controlled Release, 2018, 282, 140–147 CrossRef CAS PubMed.
- L. Clima, E. L. Ursu, C. Cojocaru, A. Rotaru, M. Barboiu and M. Pinteala, Experimental design, modeling and optimization of polyplex formation between DNA oligonucleotides and branched polyethylenimine, Org. Biomol. Chem., 2015, 13(36), 9445–9456 RSC.
- D. Fischer, Y. Li, B. Ahlemeyer, J. Krieglstein and T. Kissel, In vitro cytotoxicity testing of polycations: influence of polymer structure on cell viability and hemolysis, Biomaterials, 2003, 24(7), 1121–1131 CrossRef CAS PubMed.
- R. Ardeleanu, A. I. Dascalu, A. Neamtu, D. Peptanariu, C. M. Uritu and S. S. Maier, et al., Multivalent polyrotaxane vectors as adaptive cargo complexes for gene therapy, Polym. Chem., 2018, 9(7), 845–859 RSC.
- F. W. Huang, H. Y. Wang, C. Li, H. F. Wang, Y. X. Sun and J. Feng, et al., PEGylated PEI-based biodegradable polymers as non-viral gene vectors, Acta Biomater., 2010, 6(11), 4285–4295 CrossRef CAS PubMed.
- T. Merdan, K. Kunath, H. Petersen, U. Bakowsky, K. H. Voigt and J. Kopecek, et al., PEGylation of poly(ethylene imine) affects stability of complexes with plasmid DNA under in vivo conditions in a dose-dependent manner after intravenous injection into mice, Bioconjugate Chem., 2005, 16(4), 785–792 CrossRef CAS PubMed.
- M. Ramamoorth and A. Narvekar, Non viral vectors in gene therapy- an overview, J. Clin. Diagn. Res., 2015, 9(1), GE01–GE06 Search PubMed.
- S. R. Pinnapireddy, L. Duse, B. Strehlow, J. Schafer and U. Bakowsky, Composite liposome-PEI/nucleic acid lipopolyplexes for safe and efficient gene delivery and gene knockdown, Colloids Surf., B, 2017, 158, 93–101 CrossRef CAS PubMed.
- S. R. Pinnapireddy, M. Raafat El Assy, P. Schlote and U. Bakowsky, Glycosylated Artificial Virus-Like Hybrid Vectors for Advanced Gene Delivery, Polymer, 2019, 11(2), 243 Search PubMed.
- J. S. Suk, Q. Xu, N. Kim, J. Hanes and L. M. Ensign, PEGylation as a strategy for improving nanoparticle-based drug and gene delivery, Adv. Drug Delivery Rev., 2016, 99(Pt A), 28–51 CrossRef CAS PubMed.
- D. Yadav and H. K. Dewangan, PEGYLATION: an important approach for novel drug delivery system, J. Biomater. Sci., Polym. Ed., 2021, 32(2), 266–280 CrossRef CAS PubMed.
- J. Lipfert, S. Doniach, R. Das and D. Herschlag, Understanding nucleic acid–ion interactions, Annu. Rev. Biochem., 2014, 83, 813–841 CrossRef CAS PubMed.
- D. R. Jacobson and O. A. Saleh, Counting the ions surrounding nucleic acids, Nucleic Acids Res., 2017, 45(4), 1596–1605 CAS.
- S. Perepelytsya, J. Uličný, A. Laaksonen and F. Mocci, Pattern preferences of DNA nucleotide motifs by polyamines putrescine2+, spermidine3+ and spermine4+, Nucleic Acids Res., 2019, 47(12), 6084–6097 CrossRef CAS PubMed.
- A. Atzori, S. Liggi, A. Laaksonen, M. Porcu, A. P. Lyubartsev and G. Saba, et al., Base sequence specificity of counterion binding to DNA: what can MD simulations tell us?, Can. J. Chem., 2016, 94(12), 1181–1188 CrossRef CAS.
- A. Srivastava, R. Timsina, S. Heo, S. W. Dewage, S. Kirmizialtin and X. Qiu, Structure-guided DNA–DNA attraction mediated by divalent cations, Nucleic Acids Res., 2020, 48(13), 7018–7026 CAS.
- F. Mocci and A. Laaksonen, Insight into nucleic acid counterion interactions from inside molecular dynamics simulations is “worth its salt”, Soft Matter, 2012, 8(36), 9268–9284 RSC.
- T. Sun, A. Mirzoev, V. Minhas, N. Korolev, A. P. Lyubartsev and L. Nordenskiöld, A multiscale analysis of DNA phase separation: from atomistic to mesoscale level, Nucleic Acids Res., 2019, 47(11), 5550–5562 CrossRef CAS PubMed.
- D. Meneksedag-Erol, T. Tang and H. Uludağ, Molecular modeling of polynucleotide complexes, Biomaterials, 2014, 35(25), 7068–7076 CrossRef CAS PubMed.
- Z.-L. Shen, Y.-Q. Xia, Q.-S. Yang, K. Chen and Y.-Q. Ma, Polymer–nucleic acid interactions, in Polymeric Gene Delivery Systems, Springer, 2017, pp. 41–64 Search PubMed.
- S. A. Kirsch and R. A. Böckmann, Membrane pore formation in atomistic and coarse-grained simulations, Biochim. Biophys. Acta, Biomembr., 2016, 1858(10), 2266–2277 CrossRef CAS PubMed.
- J. D. Ziebarth, D. R. Kennetz, N. J. Walker and Y. Wang, Structural comparisons of PEI/DNA and PEI/siRNA complexes revealed with molecular dynamics simulations, J. Phys. Chem. B, 2017, 121(8), 1941–1952 CrossRef CAS PubMed.
- D. A. Kondinskaia and A. A. Gurtovenko, Supramolecular complexes of DNA with cationic polymers: The effect of polymer concentration, Polymer, 2018, 142, 277–284 CrossRef CAS.
- M. Seručnik, C. R. Podlipnik and B. Hribar-Lee, DNA–Polyelectrolyte Complexation Study: The Effect of Polyion Charge Density and Chemical Nature of the Counterions, J. Phys. Chem. B, 2018, 122(21), 5381–5388 CrossRef PubMed.
- D. Meneksedag-Erol, J. N. Kizhakkedathu, T. Tang and H. Uludağ, Molecular dynamics simulations on nucleic acid binding polymers designed to arrest thrombosis, ACS Appl. Mater. Interfaces, 2018, 10(34), 28399–28411 CrossRef CAS PubMed.
- A. Farcaş and T. A. Beu, Complexation of DNA with Cationic Polymers, Studia Universitatis Babes-Bolyai, Chemia, 2018, vol. 63(2) Search PubMed.
- J. Monpara, D. Velga, T. Verma, S. Gupta and P. Vavia, Cationic cholesterol derivative efficiently delivers the genes: in silico and in vitro studies, Drug Delivery Transl. Res., 2019, 9(1), 106–122 CrossRef CAS PubMed.
- C. Gallops, J. Ziebarth and Y. Wang, A polymer physics perspective on why PEI is an effective nonviral gene delivery vector, in Polymers in therapeutic delivery, ACS Publications, 2020, pp. 1–12 Search PubMed.
- F. Stojceski, G. Grasso, L. Pallante and A. Danani, Molecular and coarse-grained modeling to characterize and optimize dendrimer-based nanocarriers for short interfering RNA delivery, ACS Omega, 2020, 5(6), 2978–2986 CrossRef CAS PubMed.
- J. D. Ziebarth and Y. Wang, Understanding the protonation behavior of linear polyethylenimine in solutions through Monte Carlo simulations, Biomacromolecules, 2010, 11(1), 29–38 CrossRef CAS PubMed.
- Y. Wang and J. Ziebarth, Multiscale molecular modeling and rational design of polymer based gene delivery vectors, J. Controlled Release, 2011, 152, e174–e176 CrossRef CAS PubMed.
- C. Sun, T. Tang and H. Uludaǧ, Molecular dynamics simulations for complexation of DNA with 2 kDa PEI reveal profound effect of PEI architecture on complexation, J. Phys. Chem. B, 2012, 116(8), 2405–2413 CrossRef CAS PubMed.
- C. Sun, T. Tang and H. Uludağ, Molecular dynamics simulations of PEI mediated DNA aggregation, Biomacromolecules, 2011, 12(10), 3698–3707 CrossRef CAS PubMed.
- R. M. Elder and A. Jayaraman, Coarse-grained simulation studies of effects of polycation architecture on structure of the polycation and polycation–polyanion complexes, Macromolecules, 2012, 45(19), 8083–8096 CrossRef CAS.
- A. F. Jorge, R. S. Dias and A. A. Pais, Enhanced condensation and facilitated release of DNA using mixed cationic agents: a combined experimental and Monte Carlo study, Biomacromolecules, 2012, 13(10), 3151–3161 CrossRef CAS PubMed.
- A. F. Jorge, R. F. Pereira, S. C. Nunes, A. J. Valente, R. S. Dias and A. A. Pais, Interpreting the rich behavior of ternary DNA-PEI-Fe(III) complexes, Biomacromolecules, 2014, 15(2), 478–491 CrossRef CAS PubMed.
- P. Pereira, A. F. Jorge, R. Martins, A. A. Pais, F. Sousa and A. Figueiras, Characterization of polyplexes involving small RNA, J. Colloid Interface Sci., 2012, 387(1), 84–94 CrossRef CAS PubMed.
- T. A. Beu and A. Farcaş, CHARMM force field and molecular dynamics simulations of protonated polyethylenimine, J. Comput. Chem., 2017, 38(27), 2335–2348 CrossRef CAS PubMed.
- K. Kunath, A. von Harpe, H. Petersen, D. Fischer, K. Voigt and T. Kissel, et al., The structure of PEG-modified poly (ethylene imines) influences biodistribution and pharmacokinetics of their complexes with NF-κB decoy in mice, Pharm. Res., 2002, 19(6), 810–817 CrossRef CAS PubMed.
- A. Malek, F. Czubayko and A. Aigner, PEG grafting of polyethylenimine (PEI) exerts different effects on DNA transfection and siRNA-induced gene targeting efficacy, J. Drug Targeting, 2008, 16(2), 124–139 CrossRef CAS PubMed.
- C. Yang, S. Gao, F. Dagnæs-Hansen, M. Jakobsen and J. Kjems, Impact of PEG chain length on the physical properties and bioactivity of PEGylated chitosan/siRNA nanoparticles in vitro and in vivo, ACS Appl. Mater. Interfaces, 2017, 9(14), 12203–12216 CrossRef CAS PubMed.
- J. M. Williford, M. M. Archang, I. Minn, Y. Ren, M. Wo and J. Vandermark, et al., Critical Length of PEG Grafts on lPEI/DNA Nanoparticles for Efficient in Vivo Delivery, ACS Biomater. Sci. Eng., 2016, 2(4), 567–578 CrossRef CAS PubMed.
- A. Dascalu, R. Ardeleanu, A. Neamtu, S. Maier, C. Uritu and A. Nicolescu, et al., Transfection-capable polycationic nanovectors which include PEGylated-cyclodextrin structural units: a new synthesis pathway, J. Mater. Chem. B, 2017, 5(34), 7164–7174 RSC.
- C. M. Uritu, C. D. Varganici, L. Ursu, A. Coroaba, A. Nicolescu and A. I. Dascalu, et al., Hybrid fullerene conjugates as vectors for DNA cell-delivery, J. Mater. Chem. B, 2015, 3(12), 2433–2446 RSC.
- B. F. Craciun, G. Gavril, D. Peptanariu, L. E. Ursu, L. Clima and M. Pinteala, Synergistic Effect of Low Molecular Weight Polyethylenimine and Polyethylene Glycol Components in Dynamic Nonviral Vector Structure, Toxicity, and Transfection Efficiency, Molecules, 2019, 24(8), 1460 CrossRef CAS PubMed.
- B. F. Crăciun, T. Vasiliu, N. Marangoci, M. Pinteală and L. Clima, Pegylated squalene: A biocompatible polymer as precursor for drug delivery, Rev. Roum. Chim., 2018, 63(7–8), 621–628 Search PubMed.
- L. Clima, B. F. Craciun, G. Gavril and M. Pinteala, Tunable Composition of Dynamic Non-Viral Vectors over the DNA Polyplex Formation and Nucleic Acid Transfection, Polymer, 2019, 11(8), 1313 CAS.
- L. Clima, D. Peptanariu, M. Pinteala, A. Salic and M. Barboiu, DyNAvectors: Dynamic constitutional vectors for adaptive DNA transfection, Chem. Commun., 2015, 51(99), 17529–17531 RSC.
- P. I. Semenyuk, M. V. Zhiryakova and V. A. Izumrudov, Supercharged polyplexes: Full-atom molecular dynamics simulations and experimental study, Macromolecules, 2018, 51(14), 5450–5459 CrossRef CAS.
- D. A. Kondinskaia, A. Y. Kostritskii, A. M. Nesterenko, A. Y. Antipina and A. A. Gurtovenko, Atomic-Scale Molecular Dynamics Simulations of DNA-Polycation Complexes: Two Distinct Binding Patterns, J. Phys. Chem. B, 2016, 120(27), 6546–6554 CrossRef CAS PubMed.
- P. Couvreur, B. Stella, L. H. Reddy, H. Hillaireau, C. Dubernet and D. Desmaële, et al., Squalenoyl nanomedicines as potential therapeutics, Nano Lett., 2006, 6(11), 2544–2548 CrossRef CAS PubMed.
- M. D. Hanwell, D. E. Curtis, D. C. Lonie, T. Vandermeersch, E. Zurek and G. R. Hutchison, Avogadro: an advanced semantic chemical editor, visualization, and analysis platform, J. Cheminf., 2012, 4(1), 17 CAS.
- E. Shepherd and J. Kitchener, 474 The ionization of ethyleneimine and polyethyleneimine, J. Chem. Soc., 1956, 2448–2452 RSC.
- D. A. Case, T. E. Cheatham, T. Darden, H. Gohlke, R. Luo and K. M. Merz, et al., The Amber biomolecular simulation programs, J. Comput. Chem., 2005, 26(16), 1668–1688 CrossRef CAS PubMed.
- L. Huang and B. Roux, Automated force field parameterization for nonpolarizable and polarizable atomic models based on ab initio target data, J. Chem. Theory Comput., 2013, 9(8), 3543–3556 CrossRef CAS PubMed.
- F. Y. Dupradeau, A. Pigache, T. Zaffran, C. Savineau, R. Lelong and N. Grivel, et al., The R.E.D. tools: advances in RESP and ESP charge derivation and force field library building, Phys. Chem. Chem. Phys., 2010, 12(28), 7821–7839 RSC.
- I. Ivani, P. D. Dans, A. Noy, A. Pérez, I. Faustino and A. Hospital, et al., Parmbsc1: a refined force field for DNA simulations, Nat. Methods, 2016, 13(1), 55 CrossRef CAS PubMed.
- I. S. Joung and T. E. Cheatham III, Molecular dynamics simulations of the dynamic and energetic properties of alkali and halide ions using water-model-specific ion parameters, J. Phys. Chem. B, 2009, 113(40), 13279–13290 CrossRef CAS PubMed.
- A. Coroaba, D.-L. Isac, C. Al-Matarneh, T. Vasiliu, S.-A. Ibanescu and R. Zonda, et al., Probing the supramolecular features via π–π interaction of a di-iminopyrene-di-benzo-18-crown-6-ether compound: experimental and theoretical study, RSC Adv., 2020, 10(63), 38304–38315 RSC.
- E.-L. Epure, T. Vasiliu, N. Hurduc and A. Neamţu, Molecular modeling study concerning the self-assembly capacity of some photosensitive amphiphilic polysiloxanes, J. Mol. Liq., 2020, 300, 112298 CrossRef CAS.
- H. J. Berendsen, D. van der Spoel and R. van Drunen, GROMACS: a message-passing parallel molecular dynamics implementation, Comput. Phys. Commun., 1995, 91(1–3), 43–56 CrossRef CAS.
- T. Darden, D. York and L. Pedersen, Particle mesh Ewald: An N·log (N) method for Ewald sums in large systems, J. Chem. Phys., 1993, 98(12), 10089–10092 CrossRef CAS.
- B. Hess, H. Bekker, H. J. Berendsen and J. G. Fraaije, LINCS: a linear constraint solver for molecular simulations, J. Comput. Chem., 1997, 18(12), 1463–1472 CrossRef CAS.
- M. J. Frisch, G. W. Trucks, H. B. Schlegel, G. E. Scuseria, M. A. Robb and J. R. Cheeseman, et al., Gaussian 16 Rev. C.01, Wallingford, CT, 2016 Search PubMed.
- T. Vasiliu, C. Cojocaru, A. Rotaru, G. Pricope, M. Pinteala and L. Clima, Optimization of Polyplex Formation between DNA Oligonucleotide and Poly (L-Lysine): Experimental Study and Modeling Approach, Int. J. Mol. Sci., 2017, 18(6), 1291 CrossRef PubMed.
Footnote |
| † Electronic supplementary information (ESI) available. See DOI: 10.1039/d1bm00973g |
| This journal is © The Royal Society of Chemistry 2021 |


