
 Open Access Article
 This Open Access Article is licensed under a Creative Commons Attribution-Non Commercial 3.0 Unported Licence
Enhanced NO-induced angiogenesis via NO/H2S co-delivery from self-assembled nanoparticles†
Jieun
Lee‡
a,
Chungmo
Yang‡
a,
Sangeun
Ahn
a,
Yeonjeong
Choi
a and
Kangwon
Lee
 *b
*b
aProgram in Nanoscience and Technology, Graduate School of Convergence Science and Technology, Seoul National University, Seoul, Republic of Korea
bDepartment of Applied Bioengineering, Graduate School of Convergence Science and Technology, Seoul National University, Seoul, Republic of Korea. E-mail: kangwonlee@snu.ac.kr
First published on 23rd April 2021
Abstract
Nitric oxide (NO) and hydrogen sulfide (H2S) have been the focus of research as therapeutic agents because of their biological functions. The controlled release of NO and H2S can enhance NO-induced angiogenesis by H2S inhibiting PDE5A. Polymeric carriers have been researched to deliver gasotransmitters and used as therapeutic agents because of their important ability to help control the concentration of NO and H2S. Here, NO/H2S-releasing nanoparticles were self-assembled from carboxyl-functionalized mPEG-PLGH-thiobenzamide [(methoxy poly (ethylene glycol-b-lactic-co-glycolic-co-hydroxymethyl propionic acid)-thiobenzamide)], PTA copolymer and encapsulated diethylenetriamine NONOate (DETA NONOate). The PTA copolymers were characterized by FT-IR and 1H NMR, and the PTA-NO nanoparticles (PTA-NO-NPs) were confirmed to have core–shell structures with a size of about 140 nm. The PTA-NO-NPs were demonstrated to be biocompatible with viabilities above 100% in various cell types, with a sustained NO and H2S releasing behavior over 72 h. Co-releasing NO and H2S accelerated tube formation by HUVECs compared to the only NO- or H2S-releasing groups in vitro. Also, PTA-NO-NPs performed enhanced angiogenesis compared to the control groups with statistically significant differences ex vivo. These results indicate the feasibility of medical applications through NO and H2S crosstalk.
1. Introduction
Gaseous signaling molecules (i.e., gasotransmitters) have emerged in therapeutics as physiological modulators because they can freely permeate membranes and regulate physiological pathways and cell functions.1,2 Gasotransmitters can be endogenously synthesized by various types of cells, interacting with each other in just a blip. The first identified gasotransmitter was nitric oxide (NO), which has been researched in cardiovascular systems, neuronal systems, immune modulators, wound healing, and cancer therapy.3 Hydrogen sulfide (H2S) is also involved in various systems of mammalian physiology and is considered one of the most important signaling molecules. NO and H2S are endogenously produced in concentrations of 5 nM–4 μM and 0.7–3 μM, respectively.4–6 Both gas molecules mediate specific physiological functions based on their concentration, such as vascular signaling in low concentration and apoptosis signaling in high concentration. These molecules share signaling pathways by interacting dependently or independently to modulate angiogenesis, vascular vasodilation, immune response, etc.7–9 Therefore, their combinatorial use could represent a promising therapeutic agent.NO is endogenously produced by NO synthase, and NO synthase can be activated by H2S production, which results in increased NO levels. Endogenously produced NO converts guanosine triphosphate (GTP) to cyclic guanosine monophosphate (cGMP), and it stimulates protein kinase G (PKG). Similarly, H2S participates in these cascade reactions by inhibiting cGMP-specific phosphodiesterase type 5 (PDE5A), which can degrade cGMP. These NO and H2S interactions allow increased cGMP levels, which lead to a sufficient stimulation of PKG. PKG provides the signals to regulate several physiological functions, such as angiogenesis and vasodilation through controlling ion channels.10 In addition, both NO and H2S can activate KATP channels involved in angiogenesis. From these simultaneous actions, NO signals inducing angiogenesis can be ultimately amplified by H2S.11,12
Since endogenously synthesized gasotransmitters have a short half-life and the direct administration of gas molecules carries a risk of overdose, the development of donor materials is necessary to deliver exogenously.13,14 Various NO or H2S donor materials, such as releasing moieties (N-diazeniumdiolate, S-nitrosothiol, and peroxynitrate for NO release, and arylthioamide, 1,2-dithiole-3-thiones, and Lawessons’ reagent derivatives for H2S release), have been developed for exogenous delivery in vivo.15–19 In particular, diethylenetriamine NONOate (DETA NONOate), which is one of the derivatives of N-diazeniumdiolate, releases two NO products with proton-triggered NO-releasing mechanisms.20 DETA NONOate was reported to have angiogenic potentials by controlling the release rates via vehicles,21,22 while 4-aminothiobenzamide, one of the arylthioamide derivatives, was reported to be a new promising therapeutic agent for cardiovascular diseases with vascular effects. Arylthioamide derivatives have showed thiol-triggered H2S-releasing properties, such as L-cysteine, but no precise thiol-triggering mechanism has been revealed yet.23 Also, 4-aminothiobenzamide has exhibited the advantages of a slow and sustained H2S release as well as having easy conjugation properties.24
By designing hybrid materials with the dual release of NO and H2S, researchers can take advantage of a signal amplification of the NO signals. The hybrid molecules, such as NOSH-aspirin (NBS 1120) and ZYZ-803, have been reported.25,26 For delivering NO and H2S donor materials, the modification of polymers is one of the most promising strategies. The grafting of releasing moieties in the polymer backbone has been reported, such as poly (vinyl alcohol), poly (ethyleneimine), chitosan, alginate, and peptide-based hydrogels.27–29 Notably, the copolymer poly (ethylene glycol) (PEG) and poly (lactic-co-glycolic acid) (PLGA) is one of the most common biocompatible and biodegradable materials used in commercial therapeutics and clinical applications. With these great characteristics of copolymers, chemical functionalization expands their versatile applications, such as in drug delivery, hydrogels, and engineered scaffolds.30–32 For instance, 2,2-bis(hydroxymethyl) propionic acid (HMPA) allows carboxyl-functionalization during the polymerization of lactic acid and glycolic acid. Poly (lactic-co-glycolic-co-hydroxymethyl propionic acid), PLGH, was used for the incorporation of drugs such as NO-releasing materials, while maintaining the characteristics of PLGA.33–35
Delivery of the gasotransmitters, however, requires overcoming some drawbacks, including their short half-life, stability, the solubility of the donors, and ensuring a controlled release without an initial burst. NO release from the polymer-pendent moieties can facilitate diverse applications,36–39 also showing a suppressed release behavior in polymeric particles.35,40 Similarly, H2S-releasing molecules have been developed to overcome the insoluble issue and initial bursting of H2S-donating molecules.18,41 Both gasotransmitters (NO and H2S) can be delivered by macromolecules (-conjugating donors or -encapsulation), which leads to appropriate biological functions with “controlled” or “slow” release behaviors. Our research group previously reported inducing angiogenesis by the controlled release of NO from the self-assembled nanoparticles by amphiphilic copolymers.22 In this study, we designed self-assembled polymeric nanoparticles for the delivery of nitric oxide and hydrogen sulfide simultaneously (Fig. 1). For ensuring the cooperation of the two gasotransmitters (NO and H2S), we modified methoxy poly (ethylene glycol-b-lactic-co-glycolic acid) (mPEG-PLGA) with 2,2-bis(hydroxymethyl) propionic acid (HMPA) and 4-aminothiobenzamide for cysteine-triggered H2S release. The self-assembled nanoparticles were characterized and displayed enhanced angiogenic potential in vitro and ex vivo.
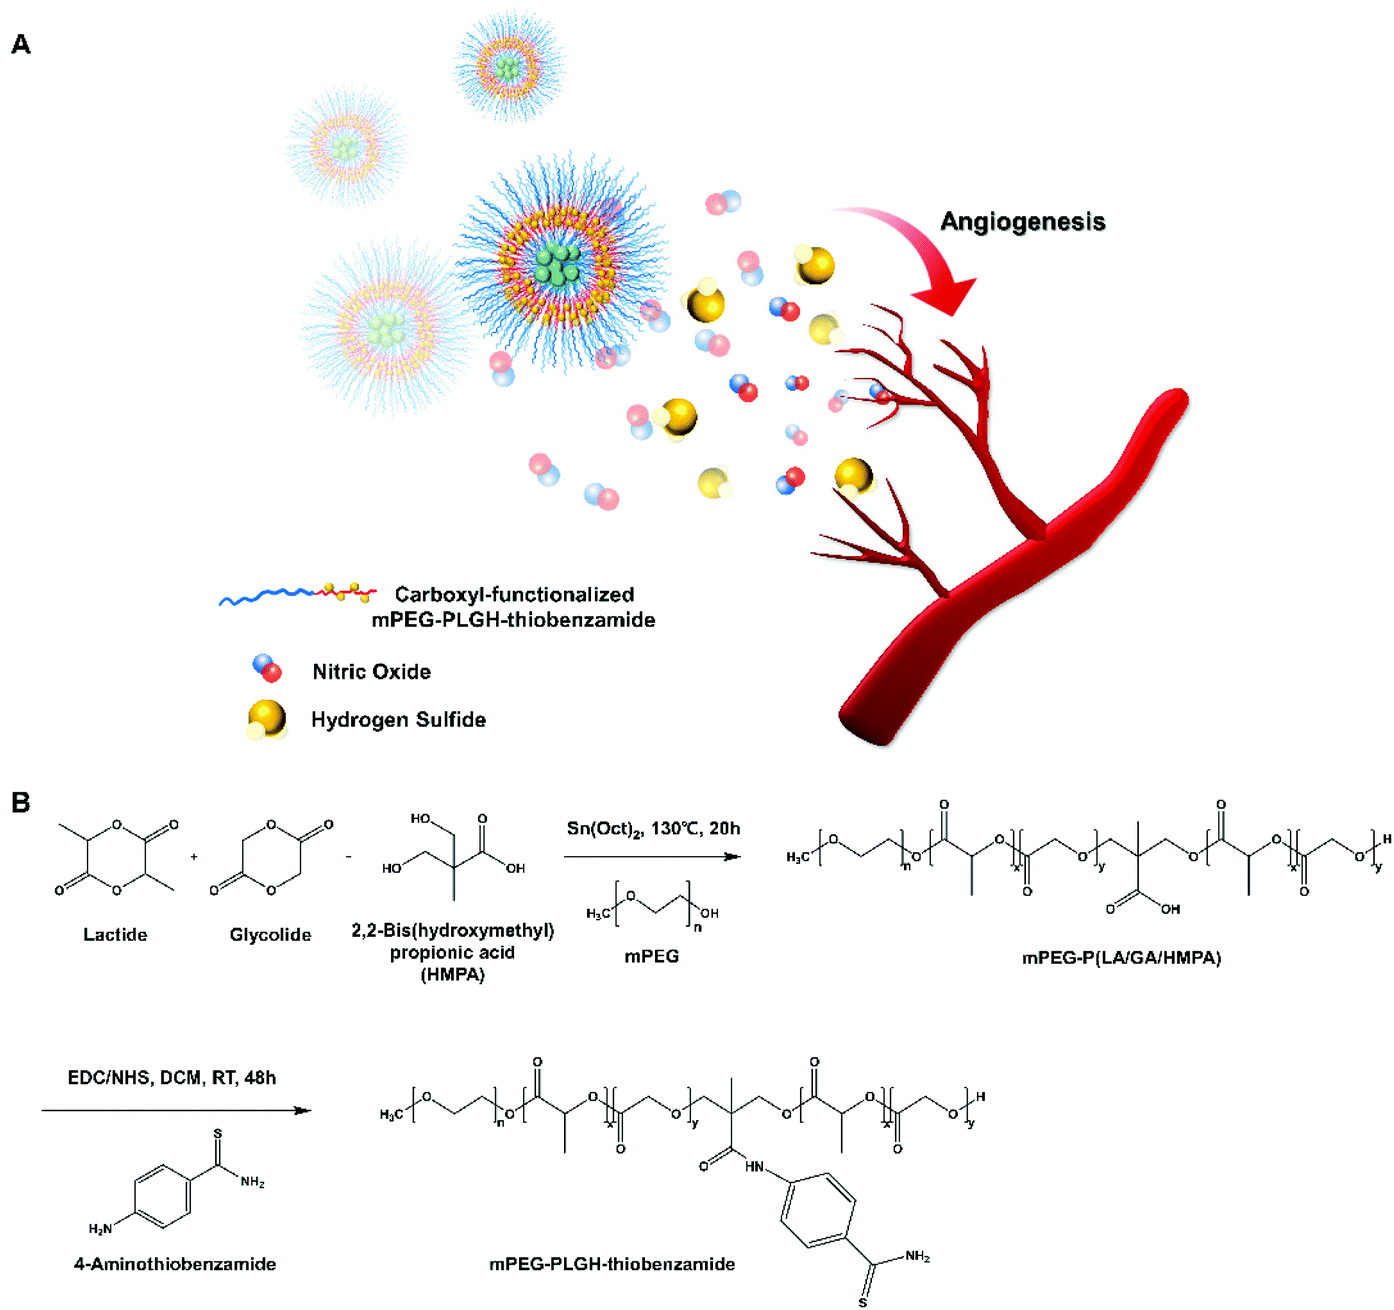 | ||
| Fig. 1 (A) Schematic illustration of NO & H2S co-delivery from self-assembled methoxy poly (ethylene glycol-b-lactic-co-glycolic-co-hydroxymethyl propionic acid)-thiobenzamide (mPEG-PLGH-thiobenzamide, PTA) nanoparticles for enhancing angiogenesis. (B) Synthesis scheme of mPEG-PLGH and PTA copolymers. | ||
2. Results and discussion
2.1. Characterization of mPEG-PLGH and mPEG-PLGH-thiobenzamide (PTA) copolymers
To deliver two different molecules together, biodegradable amphiphilic mPEG-PLGA-based mPEG-PLGH-thiobenzamide (PTA) copolymers were prepared and characterized by 1H NMR and FT-IR. First, mPEG-PLGH copolymers, which have carboxylic functional groups in the backbone chain of mPEG-PLGA as H2S-donor-conjugating moieties, were successfully polymerized by a ring-opening polymerization with L-lactide, glycolide, and HMPA. PTA copolymers were synthesized by conjugating 4-aminothiobenzamide, which acts as a H2S donor, to the carboxylic moieties with an amide bond. All the peaks of the 1H NMR spectrum confirmed the PTA copolymer structures (Fig. 2A). The peaks at 5.2 and 1.6 ppm were attributed to the methine and methyl proton of the lactic acid repeat units. The methylene protons of mPEG and glycolic acid repeat units were presented at 3.6 and 4.8 ppm, respectively. The methyl and methylene protons of HMPA were revealed at 1.25 and 4.3 ppm. The peak at 2.8 ppm presented hydrogen environments directly bonded to an aromatic ring.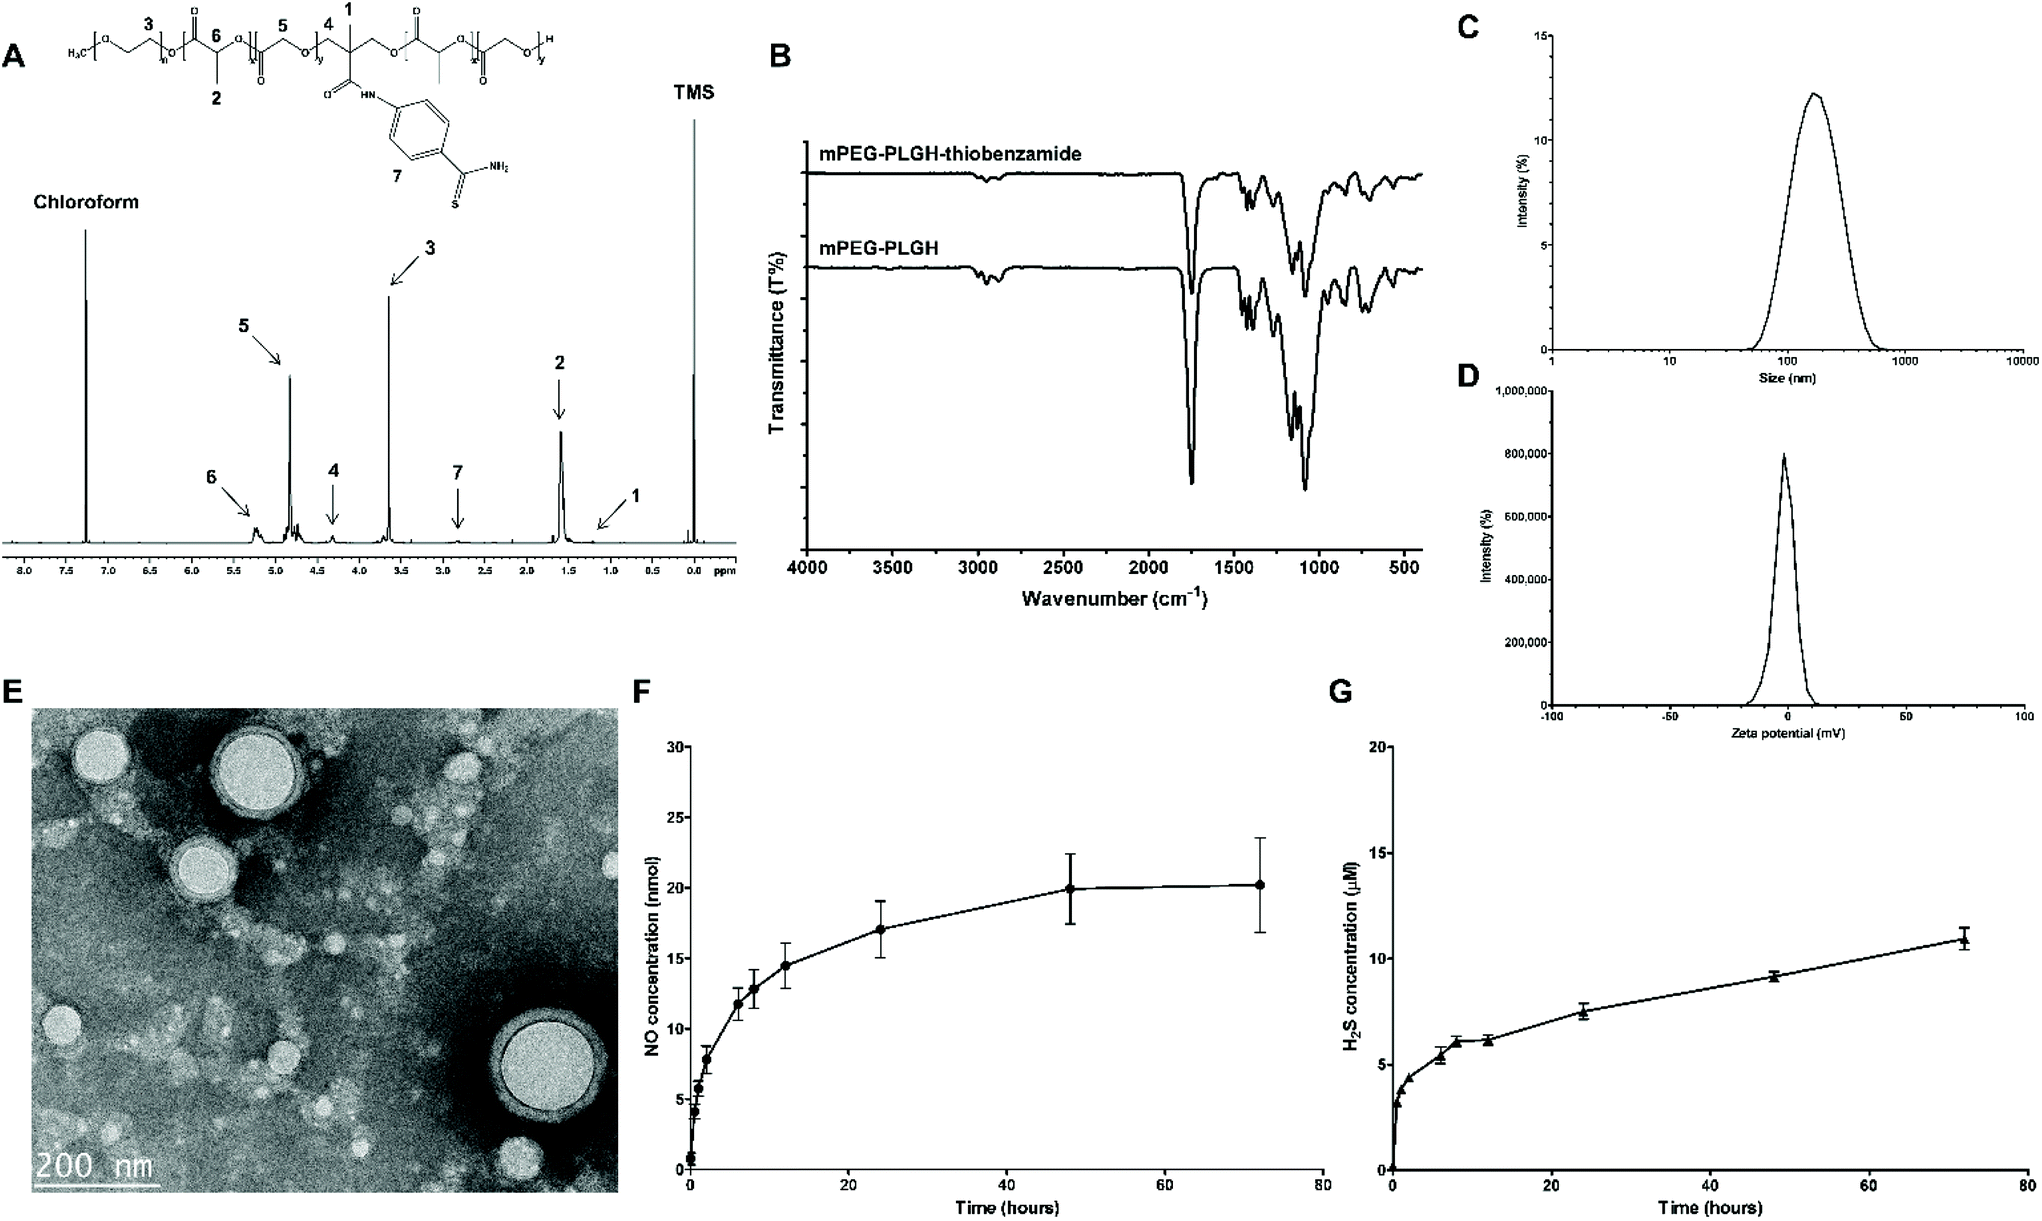 | ||
| Fig. 2 Characterization of the PTA copolymers and PTA-NO-NPs. (A) 1H NMR spectrum of the PTA copolymers with D-chloroform as a solvent. (B) FT-IR spectra of the mPEG-PLGH and PTA copolymers. (C) Size distribution and (D) zeta potential confirmed by DLS. The data are displayed as the mean ± SEM (n = 4). (E) Morphological analysis was determined by TEM. The scale bar is 200 nm. (F) Nitric oxide release measurement by Griess assay and (G) Hydrogen sulfide release measurement by the methylene blue method were carried out in vitro. PTA-NO-NPs at 1 mg ml−1 were tested under physiological conditions. The data are displayed as the mean ± SEM (n = 3). | ||
FT-IR was used for further compositional analysis of the mPEG-PLGH and PTA copolymers (Fig. 2B). The strong sharp band at 1750 cm−1 was attributed to the carbonyl C![[double bond, length as m-dash]](https://www.rsc.org/images/entities/char_e001.gif) O stretch, and the 1080–1170 cm−1 bands corresponded to the C–O stretch. The peaks at 2875–2997 cm−1 were assigned to the C–H stretch, and the bands at 1386–1457 cm−1 were assigned to the C–H bending vibrations. The peaks at 1630 and 1550 cm−1 were attributed to the amide CO bond and aromatic ring C–C stretch of conjugated thiobenzamide, respectively. The molecular weights of the copolymers were measured by GPC (Table S1†). According to the GPC results, the conjugation of thiobenzamide to the mPEG-PLGH backbone could be confirmed by the increased Mw of the PTA copolymers in comparison with the mPEG-PLGH copolymers.
O stretch, and the 1080–1170 cm−1 bands corresponded to the C–O stretch. The peaks at 2875–2997 cm−1 were assigned to the C–H stretch, and the bands at 1386–1457 cm−1 were assigned to the C–H bending vibrations. The peaks at 1630 and 1550 cm−1 were attributed to the amide CO bond and aromatic ring C–C stretch of conjugated thiobenzamide, respectively. The molecular weights of the copolymers were measured by GPC (Table S1†). According to the GPC results, the conjugation of thiobenzamide to the mPEG-PLGH backbone could be confirmed by the increased Mw of the PTA copolymers in comparison with the mPEG-PLGH copolymers.
2.2. Characterization of PTA-NO-NPs
The polymeric PTA-NO-NPs were successfully prepared by a water-in-oil-in-water (W/O/W) double emulsion with core–shell structures. The PTA-NO-NPs were able to self-assemble into a vesicular form with separated hydrophilic and hydrophobic regions, because of the amphiphilicity with appropriate volume fractions of the blocks.42–44 H2S-releasing 4-aminothiobenzamide was chemically conjugated into the hydrophobic region, while NO-releasing DETA NONOates were physically encapsulated into the hydrophilic core. Several properties that would be considered for useful nanoparticles were characterized, such as the appropriate particle size, entrapment efficiency, and release profile.45The prepared PTA-NO-NPs were well distributed with an average size of 140.8 ± 4.0 nm (Fig. 2C), indicating that the PTA-NO-NPs had a suitable size as a nano-based delivery system to sustain a longer circulation.22,46 The zeta potential, one of the critical characteristics of nanoparticles, was also estimated by DLS. The PTA-NO-NPs had an average zeta potential of −1.87 ± 0.36 mV, which is a slightly more negative charge than that exhibited generally in PLGA-based nanoparticles (Fig. 2D).
TEM images confirmed the morphology of the PTA-NO-NPs (Fig. 2E). The image of PTA-NO-NPs presented clear spherical core–shell structures resulting from the double-emulsion method of fabrication of amphiphilic PTA copolymers. The results indicated that the PTA-NO-NPs were uniformly made in a size of about 140 nm according to the DLS results. The entrapment efficiency is an important property to evaluate the drug-loading ability of nanoparticles. The entrapment efficiency of DETA NONOates measured from hydrolyzed PTA-NO-NPs was 53.7 ± 4.1% (data not shown), which was much higher than for previously reported PLGA-based particles prepared in the same W/O/W method.47
2.3. Release measurement of NO and H2S
The release behaviors of NO and H2S from the nanoparticles were confirmed respectively in physiological conditions. Using the Griess assay, which is generally used for measuring NO concentration by detecting nitrite or nitrate oxidized from NO, NO release from the PTA-NO-NPs was confirmed (Fig. 2F). At a concentration of 1 mg mL−1, PTA-NO-NPs encapsulating DETA NONOates exhibited a sustained NO-release profile for 72 h of up to approximately 20 nmol. As already revealed, free DETA NONOates have issues with an initial NO burst release generating two NO products. However, the PTA-NO-NPs released NO in a controlled manner similar to in our previous study.22H2S release from the PTA-NO-NPs was assessed by the methylene blue method, which is commonly used to monitor the H2S concentration by colorimetric measurement. The H2S release test proceeded with 4 mM of L-cysteine as a thiobenzamide-trigger agent, because arylthioamides releases H2S in the presence of organic thiols, such as reduced glutathione, L-cysteine.48,49 The H2S release also showed a long-lasting sustained-release profile (Fig. 2G). The H2S release from PTA-NO-NPs at 1 mg mL−1 was controlled with a low concentration under the range of 15 μM. After 12 h, a constantly increasing behavior in H2S concentration was observed over 72 h. Even though H2S accumulated continuously over time, PTA-NO-NPs were expected not to affect biocompatibility because of their very low concentration. Many previous studies have reported that arylthioamides can cause several issues, such as (1) toxicity caused by high concentration, (2) uncontrolled release mechanisms, (3) stability of prodrugs.50 Whereas, our PTA-NO-NPs showed the potential to overcome these problems by delivering in nanoparticles.
A controlled release profile in a drug-delivery system can increase the drug bioavailability with a prolonged circulation time and can decrease the side effects from burst drug release. For inducing angiogenesis effectively, NO and H2S should be released at low concentration and for a long time. Compared to compounds such as NOSH-aspirin and ZYZ-803, which bear NO- and H2S-releasing materials together and have a release time of about 2 h, the PTA-NO-NPs showed a prolonged release and increased circulation time of about 3 days.25 This release behavior is assumed to be caused via diffusion or degradation of the core–shell structured nanoparticles. Because of the slow and prolonged release profile, its application could be variable by adjusting the concentration of the PTA-NO-NPs.
2.4. In vitro cytotoxicity of PTA-NO-NPs
To evaluate the cytotoxicity of the PTA-NO-NPs for physiological use, in vitro CCK-8 and LIVE/DEAD assays were carried out with HUVECs, 3T3-L1, A549, C6, MCF-7, and ADSC cell lines. The cytotoxicity tests were performed with three different concentrations (50, 100 μg mL−1, and 1 mg mL−1), which were determined based on the results from the NO- and H2S-release tests. Quantitative analysis was carried out by CCK-8 assay (Fig. 3A and S1†). For all the cell types, the PTA-NO-NPs at 50 and 100 μg mL−1 concentration showed high cell viabilities compared to the control group at every time point, with the cell viabilities mostly above 100%. On the other hand, PTA-NO-NPs at 1 mg mL−1, which represents a relatively high concentration, showed toxicity to all cell types. Especially in the 3T3-L1 and C6 cell lines, the toxicity of PTA-NO-NPs was conspicuously high, with under about 60% cell viabilities after 24 h.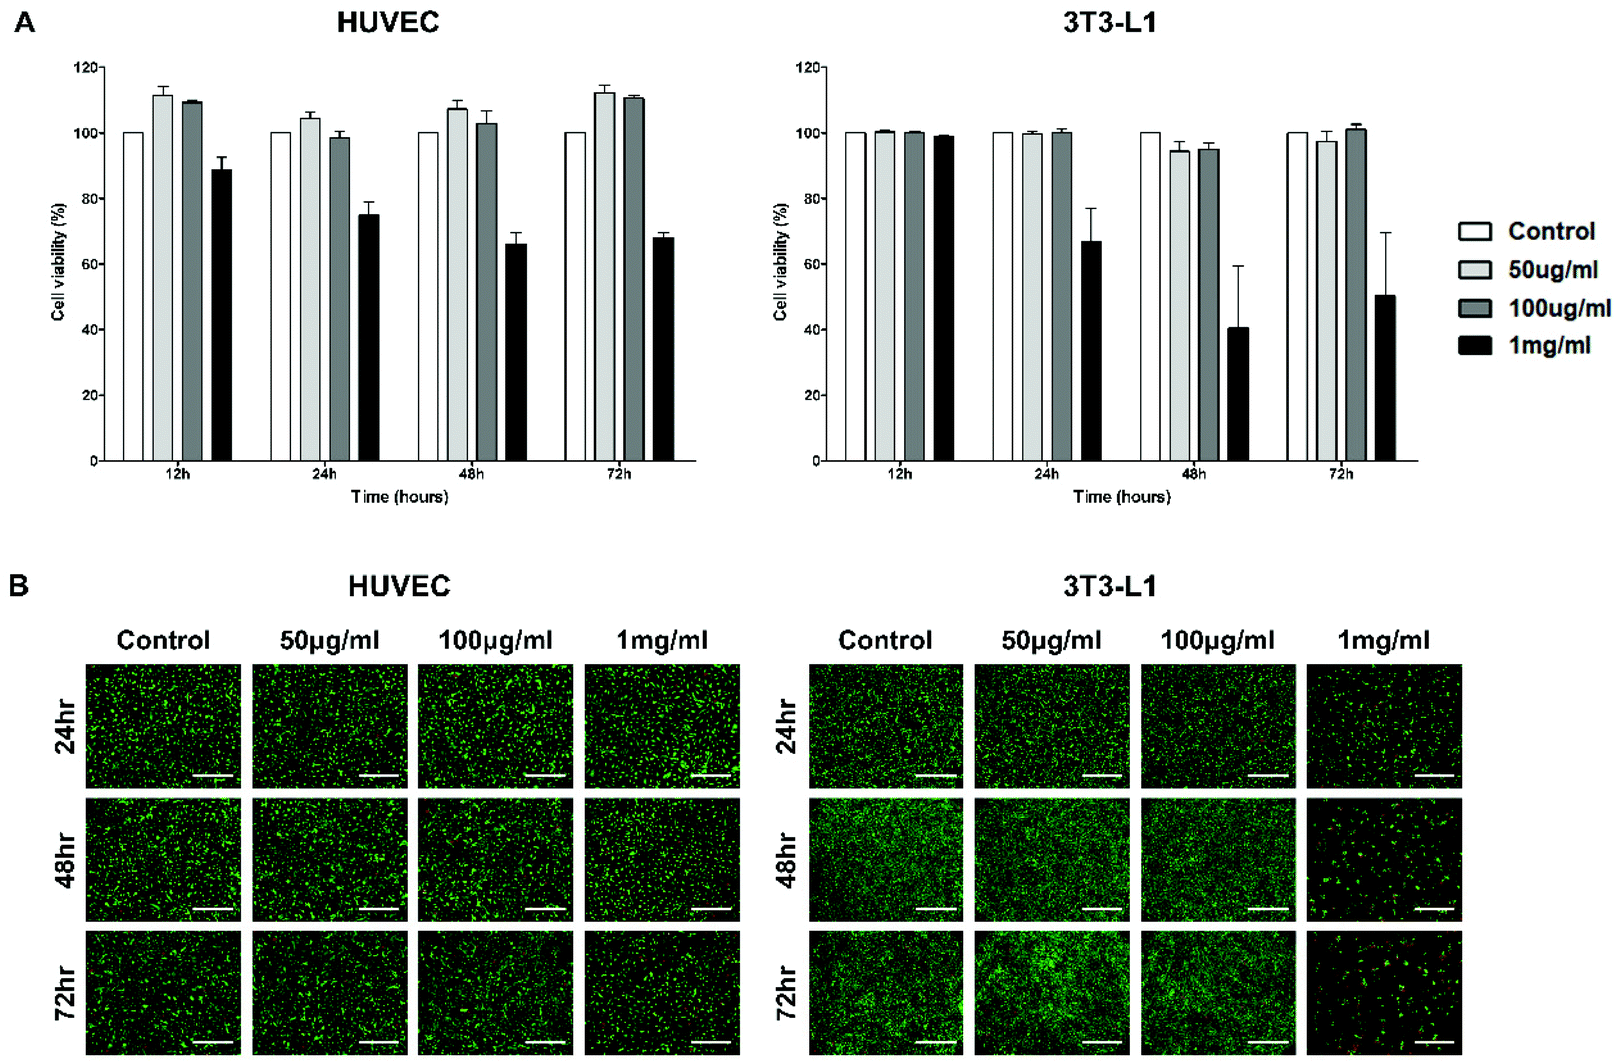 | ||
| Fig. 3 In vitro cytotoxicity measurement of HUVECs and 3T3-L1. (A) Quantitative cytotoxicity analysis was proceeded by the CCK-8 assay. The data are displayed as the mean ± SEM (n = 4). (B) Fluorescence images of cells obtained by Live/Dead assay. Green channel represents live cells and red channel represents dead cells (scale bar = 500 μm). | ||
Fluorescence images were obtained by the Live/Dead assay to further assess the cytotoxicity of the PTA-NO-NPs. The results were matched to those of the CCK-8 assay (Fig. 3B and S2†). PTA-NO-NPs at 50 and 100 μg mL−1 showed a high living-cell density and few dead cells, similar to the control group in all cell types at all time points; whereas a relatively high concentration of PTA-NO-NPs (1 mg mL−1) showed a low living-cell density and increased red fluorescence in comparison to the control at 50 and 100 μg mL−1, which means that a large number of cells were dead and detached by the cytotoxicity of high NO and H2S concentrations.
Various concentrations of PTA-NO-NPs and cell types were examined to observe the influence of PTA-NO-NPs on the reported physiological functions induced by NO and H2S in addition to confirm the biocompatibility. As reported previously, a low concentration of NO or H2S mediates cell proliferation and vascular effects, while a high concentration induces cell apoptosis. From that point of view, 50 and 100 μg mL−1 were selected for the low NO and H2S concentration groups with biocompatibility and 1 mg mL−1 was selected for the high concentration group with cytotoxicity. 3T3-L1 was assessed because the fibroblast is the most common type of cell discovered in connective tissue, and HUVECs were observed because the endothelial cells are substantially involved in angiogenesis. Also, because NO and H2S are known to play an important role in cancer progress and therapy,1,51 various cancer cell lines, including C6 (mouse brain glial cell), A549 (lung carcinoma), and MCF-7 (breast adenocarcinoma), were assessed. ADSCs, which are stem cells that can differentiate into many different cell types, were tested to observe the proliferation ability of the PTA-NO-NPs.
From the results, the PTA-NO-NPs at low concentration were demonstrated to be biocompatible and showed potent cell proliferation and angiogenesis. On the other hand, the PTA-NO-NPs at high concentration were highly effective at inducing apoptosis in a dose-dependent manner, and therefore could be promising anticancer therapeutic materials. Thus, our nanoparticles were verified to have various physiological functions that mean they could serve as a multifunctional therapeutic material in a wide range of clinical applications in the future.
2.5. Angiogenic potential of the PTA-NO-NPs
The angiogenic property of the PTA-NO-NPs was assessed by an in vitro tube assay and ex vivo aortic ring assay. To demonstrate the synergistic angiogenic ability by co-delivery of NO and H2S from PTA-NO-NPs, DETA NONOates as a NO donor only group and PTA-NPs as a H2S donor only group were also tested. First, a tube formation assay was performed in vitro, and the tubular branching ability by HUVECs was assessed (Fig. 4). PTA-NO-NPs at various concentration were tested, and the results showed that all the groups treated with PTA-NO-NPs had much higher angiogenic potentials than the negative control group. Moreover, HUVECs treated with PTA-NO-NPs formed more tubes in comparison to the group treated with VEGF. Besides, PTA-NO-NPs at 10, 25, and 50 μg mL−1 induced more tubes than DETA NONOates and PTA-NPs with statistically significant differences (p < 0.001 for 10 and 25 μg mL−1, p < 0.01 for 50 μg mL−1; data not shown). Below 25 μg mL−1, the number of tube branches was increased in proportion to the PTA-NO-NP concentration. At 25 μg mL−1, tubes were formed the most, and above that tube branches were decreased gradually.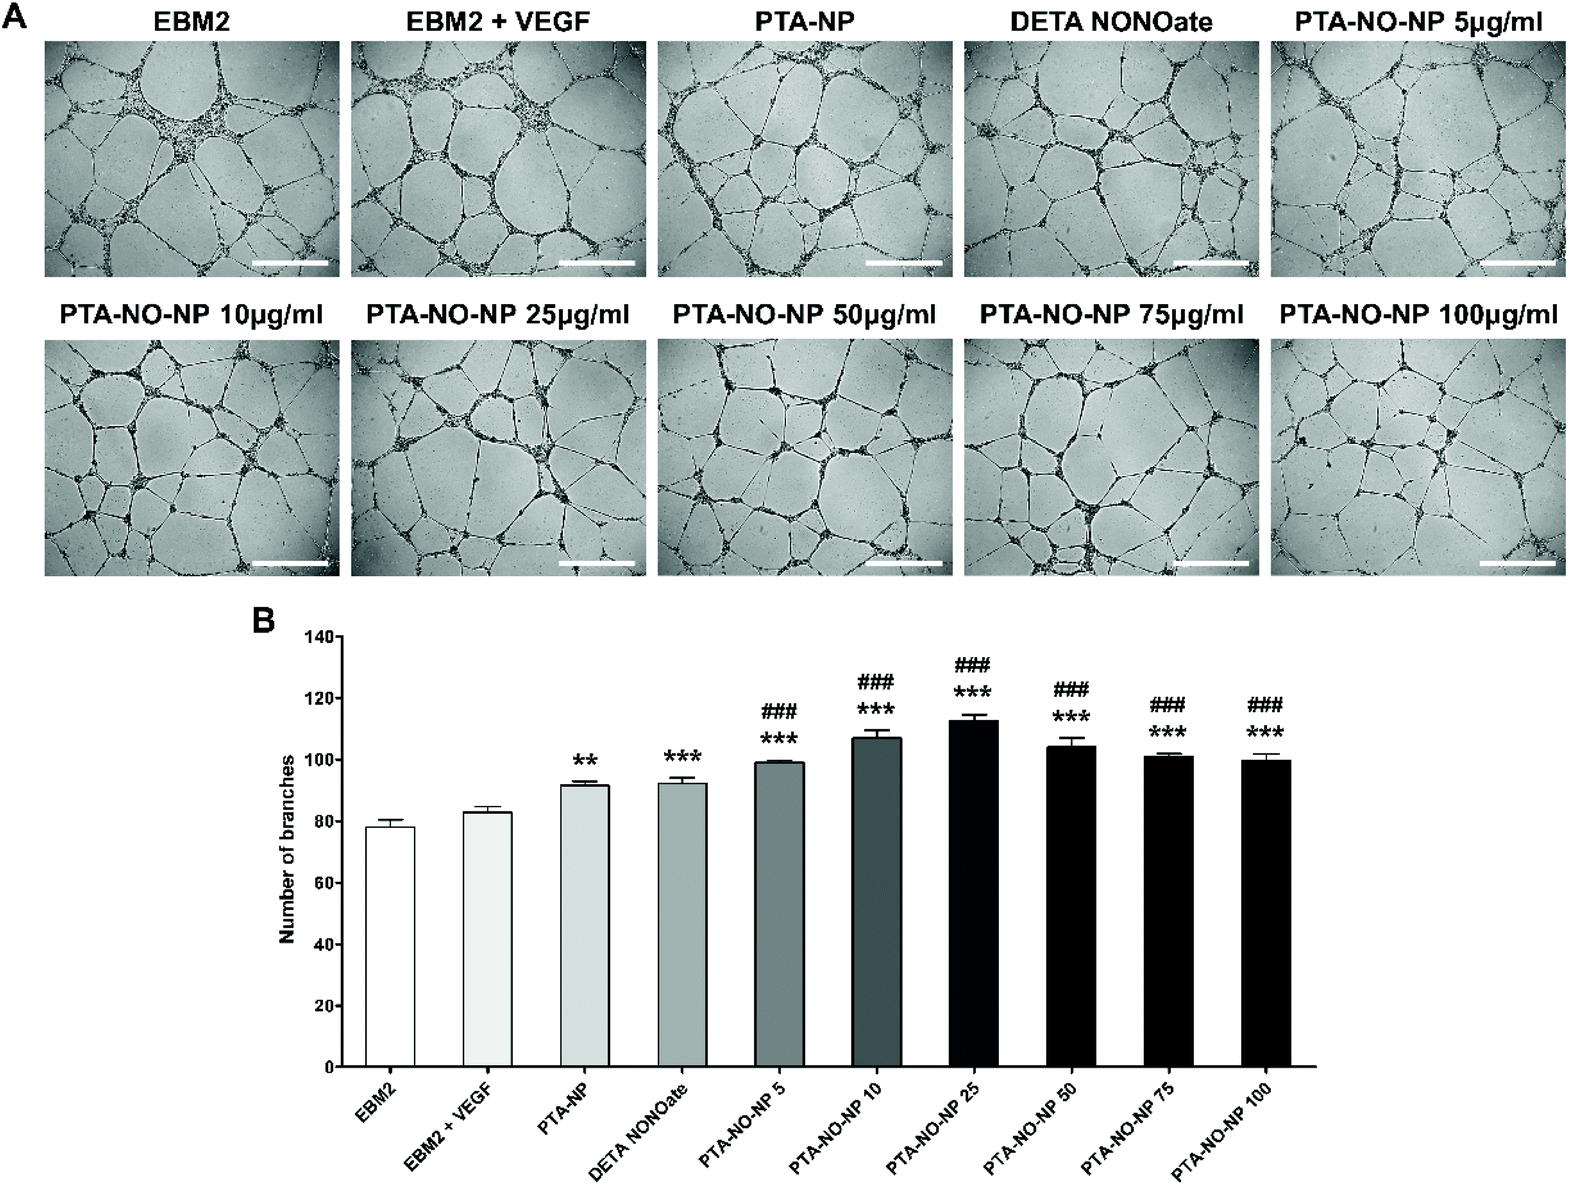 | ||
| Fig. 4 Endothelial cell tube formation assay to assess the angiogenic potential of PTA-NO-NPs in vitro. Data are shown for HUVECs on a matrigel matrix at 16 h. (A) Representative microscopic images (scale bar = 500 μm). (B) The average number of tube branches formed in the assay was measured. The data are displayed as the mean ± SEM (n = 4). Statistical differences between the experimental groups were determined using one-way ANOVA test followed by Tukey's test (***p < 0.001 vs. EBM2, ###p < 0.001 vs. EBM2 + VEGF). | ||
Furthermore, the aortic ring assay was performed using rat aorta for an ex vivo study. This assay is an organ culture-based model that can be used to observe the ability to sprout new microvessels from aorta. We observed enhanced angiogenic potentials in PTA-NO-NPs (10 and 25 μg mL−1) at day 7. The area of sprouted neovessels was evaluated. Since a higher angiogenic potential can induce more microvessel sprouting, the outgrowth area of neovessels would be a marker of angiogenic estimation. The results were comparable to the results of our in vitro study (Fig. 5). In all groups treated with PTA-NO-NPs, new microvessels sprouted more than the groups of EBM2 and EBM2 with VEGF. Also, the angiogenic potentials were slightly increased in the PTA-NO-NP groups compared to the DETA NONOates and PTA-NPs groups. Between 10 and 25 μg mL−1, there were no significant differences in the microvessel sprouting abilities of the PTA-NO-NPs.
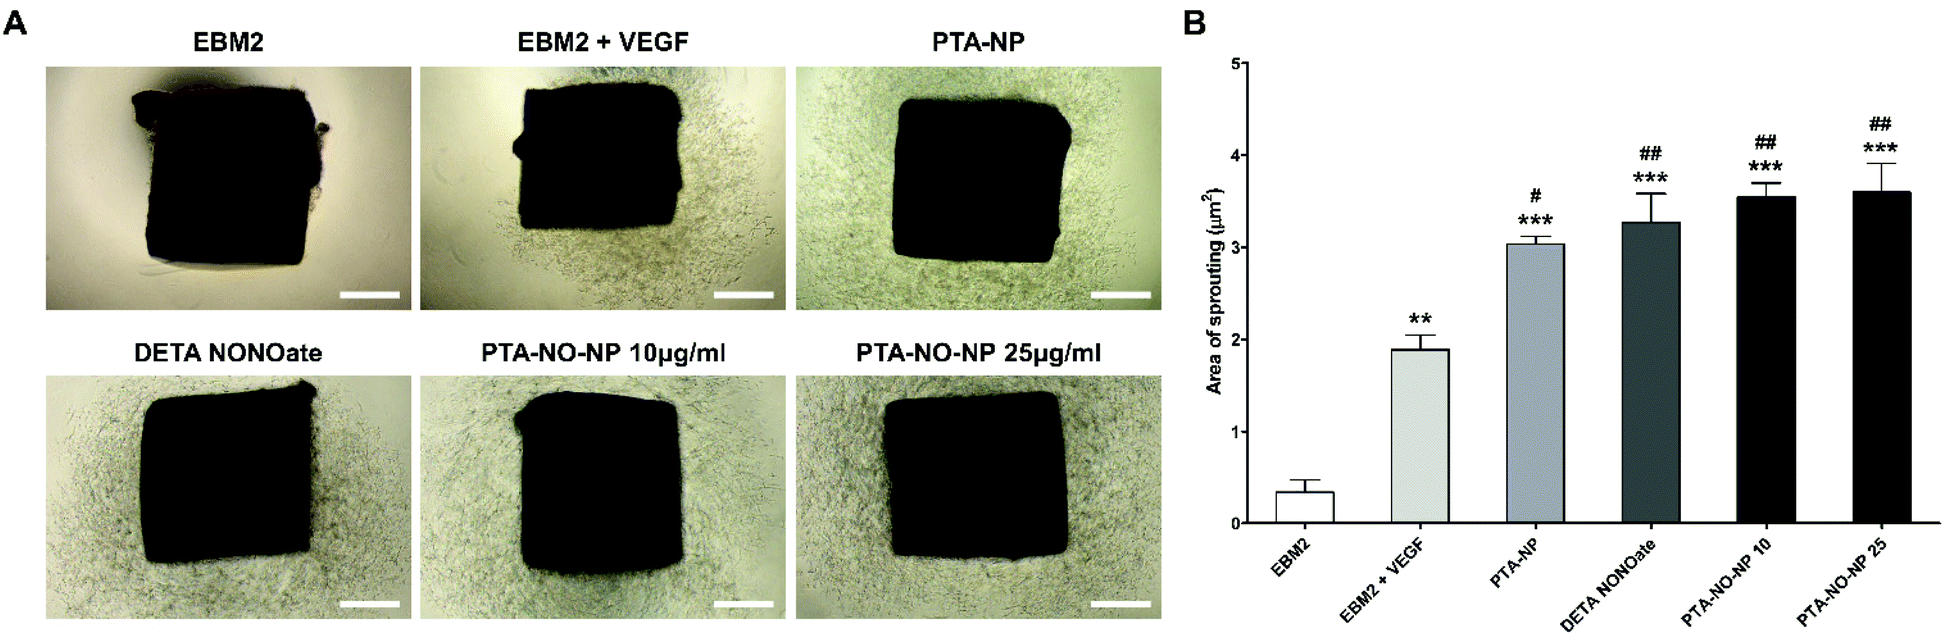 | ||
| Fig. 5 Ex vivo aortic ring assay using rat aorta. (A) Representative microscopic images of sprouted microvessels from the aorta after 7 days of incubation (scale bar = 500 μm). (B) The area of new microvessels outgrowth was quantified by ImageJ software. The data are displayed as the mean ± SEM (n = 3). Statistical differences between experimental groups were determined using one-way ANOVA test followed by Tukey's test (***p < 0.001 vs. EBM2, ###p < 0.001 vs. EBM2 + VEGF). | ||
The results showed that only NO or H2S groups could promote angiogenesis rather than the control group and VEGF treated group, whereas PTA-NO-NPs induced angiogenesis more strongly. This means that NO and H2S can induce angiogenesis independently, but the angiogenic potential was much higher when delivering NO and H2S together in nanoparticles than in delivering each separately. Despite the low release concentration of H2S from PTA-NO-NPs, the results exhibited that the released H2S can fully help NO signal amplification. Because of the much longer release time than delivery by the compounds, the delivery of NO and H2S by PTA-NO-NPs is expected to be more effective in angiogenesis.
3. Experimental
3.1. Materials
Lactic acid, glycolic acid, HMPA (2,2-bis(hydroxymethyl) propionic acid), and stannous octoate were supplied by Sigma Aldrich (St Louis, MO, USA). Methoxy poly (ethylene glycol) (mPEG) (average Mw 2000) was supplied by Tokyo Chemical Industry (Tokyo, Japan). 4-Aminothiobenzamide was purchased from Carbosynth (Berkshire, UK) and diethylenetriamine NONOate (DETA NONOate) was supplied by Acros Organics. The nitric oxide assay kit was purchased from Abcam (Cambridge, UK). The dialysis membrane (Spectra/por 6 MWCO 1 kDa) was purchased from Spectrum Industries, Inc. (Los Angeles, CA, USA). 3T3-L1 (mouse fibroblast), C6 (mouse brain glial cell), A549 (lung carcinoma), and MCF-7 (breast adenocarcinoma) cell lines were obtained from Korea Cell Line Bank (Seoul, Korea). HUVECs (human umbilical vein endothelial cell) and ADSC (adipose-derived stem cell) cell lines were supplied by PromoCell (Heidelberg, Germany) and Cefo Co., Ltd (Seoul, Korea), respectively. The Cell Counting Kit-8 (CCK-8) was supplied by Dojindo Molecular Technologies (Rockville, MD, USA) and the LIVE/DEAD Viability/Cytotoxicity kit was supplied by Thermo Fisher Scientific (Waltham, MA, USA).3.2. Preparation of mPEG-PLGH copolymers (carboxyl-functionalized mPEG-PLGA)
mPEG-PLGH copolymers were polymerized through a typical ring-opening polymerization using stannous octoate catalyst, as reported previously.22,52 Briefly, lactide (4 mmol), glycolide (4 mmol), HMPA (0.09 mmol), and mPEG (20 wt% of the total monomer) were added into a flask, and the flask was sealed. After the flask was immersed in an oil bath, stannous octoate (0.1 wt% of the total monomer) was added as a catalyst. For 20 h, the mixture was gently stirred at 130 °C in an N2 environment. After quenching the polymerization by cooling down, the crude product was dissolved in DCM and precipitated out by adding excess methyl alcohol. The product was washed with methyl alcohol and then recovered by drying under vacuum for 24 h at room temperature.3.3. Preparation of mPEG-PLGH-thiobenzamide (PTA) copolymers
mPEG-PLGH-thiobenzamide (PTA) copolymers were prepared by conjugating 4-aminothiobenzamide to the carboxyl residue of mPEG-PLGH copolymers with an amide bond, as described previously.33,35 The carboxyl-functionalized mPEG-PLGH and NHS (2.5 molar eq. to carboxyl group) were mixed in DMF (4 vol.) in an N2 environment. After EDC·HCl (2.5 molar eq.) was dissolved in DMF (6 vol.), the solution was added into the mixture. The synthesis was proceeded at room temperature for 24 h to activate all the available carboxyl groups of mPEG-PLGH. 4-Aminothiobenzamide (5 molar eq.) solution mixed with triethylamine (8 molar eq.) in DMF (2 vol.) was added into the activated mPEG-PLGH copolymer mixture in an N2 environment and maintained with stirring gently for 24 h at room temperature. The resulting solution was concentrated to remove DMF, and then the crude residue was precipitated using excess diethyl ether. The precipitate was redissolved in DCM and extracted two times with saturated NaCl solution to remove any remaining salts and excess 4-aminothiobenzamide. The clear DCM phase was separated, and then the solvent was removed by distillation. After recrystallization using excess cold diethyl ether, the product was obtained using a vacuum oven at room temperature for 24 h.3.4. Preparation of PTA nanoparticles with DETA NONOate (PTA-NO-NPs)
PTA-NO-NPs encapsulating DETA NONOate were prepared through the previously reported water-in-oil-in-water (W/O/W) double emulsion method.22,53 Briefly, 20 mg of PTA was dissolved in 1 mL of DCM, and then 0.2 mL of DW (for PTA-NPs) or 5 wt% DETA NONOate solution (in 10 mM NaOH) was mixed. Using a probe sonicator, the mixture was emulsified for 3 min in an ice bath. Next, 2 mL of 2% polyvinyl alcohol in DW was added into the emulsion, followed by emulsification by sonication for 5 min. The final emulsion was mixed with 15 mL of 0.2% polyvinyl alcohol solution and filtered with a 0.45 μm PES syringe filter. After the solution was diluted with DW, the final PTA-NO-NPs or PTA-NPs were freeze-dried for at least 3 days and then collected.3.5. Characterization of the mPEG-PLGH and PTA copolymers
To verify the PTA copolymer structure, 1H nuclear magnetic resonance spectrometry (1H NMR, ADVANCE II 500, Bruker, Billerica, MA, USA) was used with D-chloroform as a solvent. To confirm the structures of mPEG-PLGH and PTA copolymers, Fourier transform infrared spectrometry (FT-IR, Bruker Corporation, Billerica, MA, USA) was used. To assess the molecular weight of the copolymers, gel permeation chromatography (GPC, Ultimate 3000, Thermo Fisher Scientific, Waltham, MA, USA) was used with DMF as a solvent.3.6. Characterization of the size distribution and morphology of the PTA-NO-NPs
A zetasizer instrument (Malvern Instruments, Malvern, UK) was used to assess the size distribution and zeta potential of the PTA-NO-NPs. The measurement was carried out with a 173° scattering angle at room temperature with the PTA-NO-NPs well-dispersed in DW. For morphological characterization, field emission transmission electron microscopy (FE-TEM, JEM-F200, JEOL Ltd, Tokyo, Japan) was used. To pretreat the PTA-NO-NPs, negative staining was conducted using sodium phosphotungstate solution (1%).3.7. Entrapment efficiency measurement of the PTA-NO-NPs
The DETA NONOate entrapment efficiency of the PTA-NO-NPs was measured as previously described using a Nanodrop 2000 spectrophotometer (Thermo Fisher Scientific, Waltham, MA, USA).54 The PTA-NO-NPs dispersed in NaOH (1 M) were kept under ultrasonication for at least 10 min, and then continuously stirred for complete hydrolysis of the PTA-NO-NPs. The absorbance of the completely decomposed PTA-NO-NP mixture was measured at 252 nm wavelength. The standard solution of PTA-NPs and an equivalent amount of DETA NONOate were prepared in 1 M NaOH for carrying out the calibration. The DETA NONOate entrapment efficiency was determined using the equation as follows: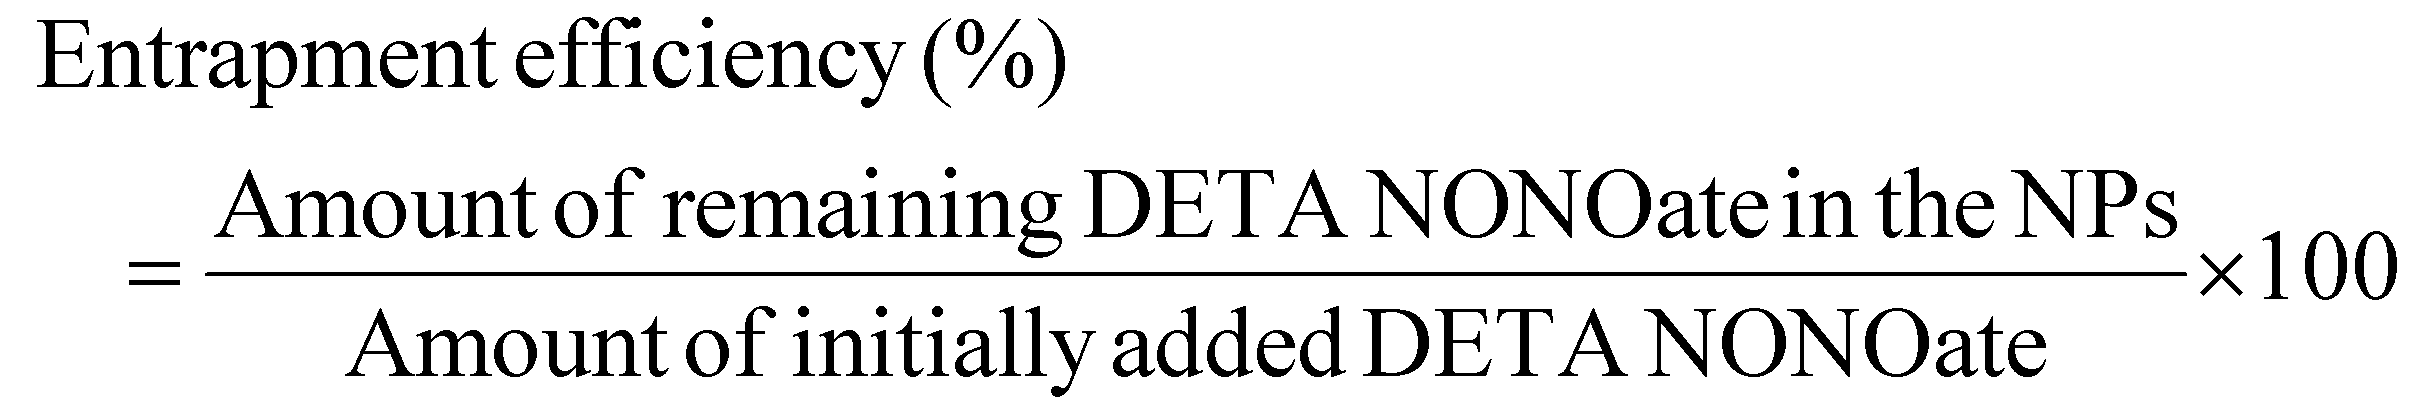
3.8. NO-release measurements
To confirm the NO release from the PTA-NO-NPs, the Griess assay was performed with a nitric oxide assay kit following the manufacturer's protocol. The Griess assay is a common analytical test that measures the presence of nitrite and nitrate. DETA NONOate can spontaneously dissociate and release two NO products under normal physiological conditions. Briefly, PTA-NO-NPs (2 mg) encapsulating DETA NONOate were fully dispersed in PBS (2 mL). The dispersed solution was placed into a dialysis membrane, so that NO can be diffused freely across the membrane. Then, the dialysis membrane was immersed in 6 mL of PBS and incubated at 37 °C in darkness. Next, 85 μL of sample was taken at each time point, and after that nitrate reductase (5 μL) and enzyme cofactor (5 μL) were added. Each sample was incubated at room temperature for 1 h to convert nitrate to nitrite by nitrate reductase. Enhancer (5 μL) was added into each sample, and then incubated for 10 min at room temperature. After the Griess reagents were mixed, the optical density was measured by a microplate reader (Synergy H1, Bio Tek, Winooski, VT, USA) at 540 nm. The total amount of NO, which is the sum of nitrate and nitrite, was calculated against a standard curve.3.9. H2S-release measurements
H2S release from the PTA-NO-NPs was confirmed by using the methylene blue method as previously reported.48 The methylene blue method is a colorimetric assay for measuring the intensity of methylene blue color directly proportional to the H2S concentration. In the presence of L-cysteine, arylthioamides can produce H2S. Briefly, 0.5 mL of L-cysteine in PBS (4 mM) was added into 0.1 mL of zinc acetate in DW (1% w/v). After 0.5 mL of PTA-NO-NPs (1 mg mL−1) in DW was mixed, the mixture was incubated at 37 °C in darkness. At each time point, 150 μL of 20 mM N,N-dimethyl-p-phenylenediamine dihydrochloride dye in 7.2 M HCl and 150 μl of 30 mM iron (III) chloride in 1.2 M HCl were added into the samples, which resulted in the formation of methylene blue. After 10 min, the H2S concentration of each sample was measured by a microplate reader at 670 nm and calculated against a calibration curve. NaHS, a representative H2S-releasing molecule, was used to graph the standard curve of H2S release. PBS (0.5 mL) was mixed with zinc acetate (0.1 mL) followed by adding 0.5 mL of NaHS in DW (0–300 μM). The samples were incubated for 30 min under the same conditions described above for the trapping of H2S by zinc acetate and for transforming into stable zinc sulfide. Then the samples were mixed with N,N-dimethyl-p-phenylenediamine dihydrochloride dye and iron (III) chloride and measured at 670 nm as described above.3.10. In vitro cytotoxicity measurements
In vitro cytotoxicity was confirmed with 3T3-L1, HUVECs, A549, C6, MCF-7, and ADSC. 3T3-L1 and ADSC were cultured in DMEM containing 10% fetal bovine serum (FBS) and 1% penicillin–streptomycin (PS). A549, C6, and MCF-7 were cultured in RPMI with FBS (10%) and PS (1%). The culture medium for HUVECs was endothelial growth medium-2 (PromoCell, Heidelberg, Germany) with FBS (10 mL), ascorbic acid (0.5 mg), heparin (11.25 mg), human recombinant epidermal growth factor (2.5 μg), human recombinant basic fibroblast growth factor (5 μg), hydrocortisone (0.1 mg), insulin-like growth factor (R3 IGF-1) (0.01 mg), and human recombinant vascular endothelial growth factor 165 (0.25 μg). For the CCK-8 assay, 1 × 10⁴ cells of each cell line were incubated in 96 well plates at 37 °C treated with PTA-NO-NPs in the concentration of 50, 100 μg mL−1, or 1 mg mL−1. At 12, 24, 48, and 72 h, the cytotoxicity was determined at 450 nm using the microplate reader. For the Live/Dead assay, the cells were placed in 48 well plates in the same conditions as described above. At 24, 48, and 72 h, the fluorescence images were randomly obtained by fluorescence microscopy (Axio Observer Z1, Carl Zeiss, Oberkochen, Germany).3.11. Tube formation assay
To verify the angiogenic potential of the PTA-NO-NPs in vitro, a tube formation assay was performed. The tube formation assay is a commonly used method to measure the ability of formation of new blood vessels by endothelial cells in a quantifiable manner.55 Growth factor reduced matrigel (Corning Incorporated, New York, NY, USA) was evenly distributed to each well as the basement membrane matrix. The coated well plate was incubated at room temperature for 30 min and under humidified conditions (5% CO2, 37 °C) for 1 h. The prepared conditioned media was added to each well in a two-fold concentration. As the control medium, the endothelial cell growth basal medium-2 (EBM2, Lonza, Basel, Switzerland) with FBS (10 mL) and gentamicin-amphotericin (0.5 mL) and without any other growth factors was prepared. EBM2 with 0.1% (v/v) VEGF was prepared to compare the angiogenic potential of the PTA-NO-NPs against VEGF. Also, the media containing PTA-NPs (25 μg mL−1), DETA NONOate (1.7 μg mL−1, the same concentration of DETA NONOate in 25 μg mL−1 PTA-NO-NPs), and PTA-NO-NPs (5, 10, 25, 50, 75, and 100 μg mL−1) were prepared for the test media. The media-treated well plate was incubated under humidified 37 °C, 5% CO2 conditions for 1 h. Among the endothelial cell lines, HUVECs were prepared and transferred into each well. After incubation for 16 h, the tubular network was imaged by a microscope and the number of tubular branches was counted using ImageJ.3.12. Aortic ring assay
To further assess the angiogenic properties in an ex vivo model, a rat aorta ring assay was performed.56 Animal experiments were performed with the approval (Approval No. BA-1903-268-017-01) of the Institute of Animal Care and Use Committee of Seoul National University Bundang Hospital. First, matrigel matrix was used to precoat each well and incubated under 5% CO2 and 37 °C conditions for 30 min. Rat aortas (4-week-old female Sprague Dawley rats; Orient, Seongnam, Korea) were excised and sliced into rings in 1.5 mm widths. Every single ring was located in the top center of each well, followed by incubation for 10 min. On top of each ring, supplemental Matrigel matrix was added. After incubation for 30 min, EBM2, EBM2 with VEGF, PTA-NPs (25 μg mL−1), DETA NONOate (1.7 μg mL−1), and PTA-NO-NPs (10 and 25 μg mL−1) were added to each well. The well plate was incubated under 37 °C, 5% CO2 conditions and all the conditioned media were changed at day 3. After 7 days, sprouting microvessels were imaged using a microscope and the area of sprouting was calculated using ImageJ.3.13. Statistical analysis
All the results are represented as the mean ± SEM of independent experiments. The significance of statistical differences was analyzed using one-way ANOVA test (Prism; GraphPad Software, San Diego, CA, USA). P < 0.05 was regarded to have statistical significance.4. Conclusions
In this study, PTA-NO-NPs releasing NO and H2S together were prepared by a double emulsion from amphiphilic PTA copolymers. We demonstrated the synergistic effect of the co-delivery of two gas molecules, NO and H2S, via nanoparticles for enhancing angiogenesis. In contrast with compounds bearing NO- and H2S-releasing moieties, the PTA-NO-NPs exhibited controlled NO- and H2S-release profiles with a prolonged circulation time. With this sustained-release manner, PTA-NO-NPs at low concentration showed biocompatibility. Furthermore, through the in vitro and ex vivo assays, we confirmed the enhanced angiogenic effect caused by the co-delivery of NO and H2S from PTA-NO-NPs compared to the groups delivering each gas molecule separately. To the best of our knowledge, this study is the first application of NO and H2S into nano-sized delivery vehicles for the purpose of inducing angiogenesis. We believe that our PTA-NO-NPs have potential as an effective delivery system for inducing angiogenesis and other various physiological functions that are affected by both NO and H2S.Conflicts of interest
There are no conflicts to declare.Acknowledgements
This work was supported by the Nano & Materials Technology Development Program [grant number NRF-2017M3A7B4049850] of the National Research Foundation of Korea (NRF) funded by the Ministry of Science and ICT.References
- C. Yang, S. Jeong, S. Ku, K. Lee and M. H. Park, J. Controlled Release, 2018, 279, 157–170 Search PubMed.
- R. Wang, Trends Biochem. Sci., 2014, 39, 227–232 Search PubMed.
- A. K. Mustafa, M. M. Gadalla and S. H. Snyder, Sci. Signal., 2009, 2, re2 Search PubMed.
- H. Kimura and H. Esumi, Acta Biochim. Pol., 2003, 50, 49–59 Search PubMed.
- X. Cao, L. Ding, Z. Xie, Y. Yang, M. Whiteman, P. K. Moore and J. Bian, Antioxid. Redox Signaling, 2019, 31, 1–38 Search PubMed.
- E. A. Wintner, T. L. Deckwerth, W. Langston, A. Bengtsson, D. Leviten, P. Hill, M. A. Insko, R. Dumpit, E. V. Ekart, C. F. Toombs and C. Szabo, Br. J. Pharmacol., 2010, 160, 941–957 Search PubMed.
- M. Magierowski, K. Magierowska, S. Kwiecien and T. Brzozowski, Molecules, 2015, 20, 9099–9123 Search PubMed.
- S. Yuan, X. Shen and C. G. Kevil, Antioxid. Redox Signaling, 2017, 27, 634–653 Search PubMed.
- S. C. Bir, C. B. Pattillo, S. Pardue, G. K. Kolluru, X. Shen, T. Giordano and C. G. Kevil, J. Am. Heart Assoc., 2014, 1, e004093 Search PubMed.
- S. H. Francis, J. L. Busch, J. D. Corbin and D. Sibley, Pharmacol. Rev., 2010, 62, 525–563 Search PubMed.
- C. Coletta, A. Papapetropoulos, K. Erdelyi, G. Olah, K. Módis, P. Panopoulos, A. Asimakopoulou, D. Gerö, I. Sharina, E. Martin and C. Szabo, Proc. Natl. Acad. Sci. U. S. A., 2012, 109, 9161 Search PubMed.
- D. J. Polhemus and D. J. Lefer, Circ. Res., 2014, 114, 730–737 Search PubMed.
- Y. Qian and J. B. Matson, Adv. Drug Delivery Rev., 2017, 110–111, 137–156 Search PubMed.
- K. M. Dillon, R. J. Carrazzone, J. B. Matson and K. Kashfi, Biochem. Pharmacol., 2020, 176, 113931 Search PubMed.
- A. B. Seabra and N. Durán, J. Mater. Chem., 2010, 20, 1624–1637 Search PubMed.
- F. Rong, Y. Tang, T. Wang, T. Feng, J. Song, P. Li and W. Huang, Antioxidants, 2019, 8, 556 Search PubMed.
- C.-t. Yang, L. Chen, S. Xu, J. J. Day, X. Li and M. Xian, Front. Pharmacol., 2017, 8, 664 Search PubMed.
- K. Kaur, R. J. Carrazzone and J. B. Matson, Antioxid. Redox Signaling, 2019, 32, 79–95 Search PubMed.
- C. R. Powell, K. M. Dillon and J. B. Matson, Biochem. Pharmacol., 2018, 149, 110–123 Search PubMed.
- L. K. Keefer, ACS Chem. Biol., 2011, 6, 1147–1155 Search PubMed.
- K. Troidl, S. Tribulova, W.-J. Cai, I. Rüding, H. Apfelbeck, W. Schierling, C. Troidl, T. Schmitz-Rixen and W. Schaper, J. Cardiovasc. Pharmacol., 2010, 55, 153–160 Search PubMed.
- C. Yang, H. H. Hwang, S. Jeong, D. Seo, Y. Jeong, D. Y. Lee and K. Lee, Int. J. Nanomed., 2018, 13, 6517–6530 Search PubMed.
- Y. Zhao, T. D. Biggs and M. Xian, Chem. Commun., 2014, 50, 11788–11805 Search PubMed.
- A. Martelli, L. Testai, V. Citi, A. Marino, I. Pugliesi, E. Barresi, G. Nesi, S. Rapposelli, S. Taliani, F. Da Settimo, M. C. Breschi and V. Calderone, ACS Med. Chem. Lett., 2013, 4, 904–908 Search PubMed.
- R. Kodela, M. Chattopadhyay and K. Kashfi, ACS Med. Chem. Lett., 2012, 3, 257–262 Search PubMed.
- Q. Hu, D. Wu, F. Ma, S. Yang, B. Tan, H. Xin, X. Gu, X. Chen, S. Chen, Y. Mao and Y. Z. Zhu, Antioxid. Redox Signal., 2016, 25, 498–514 Search PubMed.
- Y. Lu, D. L. Slomberg and M. H. Schoenfisch, Biomaterials, 2014, 35, 1716–1724 Search PubMed.
- F. S. Schanuel, K. S. R. Santos, A. Monte-Alto-Costa and M. G. de Oliveira, Colloids Surf., B, 2015, 130, 182–191 Search PubMed.
- A. Longchamp, K. Kaur, D. Macabrey, C. Dubuis, J.-M. Corpataux, S. Déglise, J. B. Matson and F. Allagnat, Acta Biomater., 2019, 97, 374–384 Search PubMed.
- C. Martins, F. Sousa, F. Araújo and B. Sarmento, Adv. Healthcare Mater., 2018, 7, 1701035 Search PubMed.
- J. Cheng, B. A. Teply, I. Sherifi, J. Sung, G. Luther, F. X. Gu, E. Levy-Nissenbaum, A. F. Radovic-Moreno, R. Langer and O. C. Farokhzad, Biomaterials, 2007, 28, 869–876 Search PubMed.
- J. Yu, A. R. Lee, W. H. Lin, C. W. Lin, Y. K. Wu and W. B. Tsai, Tissue Eng., Part A, 2014, 20, 1896–1907 Search PubMed.
- V. B. Damodaran, J. M. Joslin, K. A. Wold, S. M. Lantvita and M. M. Reynolds, J. Mater. Chem., 2012, 22, 5990 Search PubMed.
- K. A. Wold, V. B. Damodaran, L. A. Suazo, R. A. Bowen and M. M. Reynolds, ACS Appl. Mater. Interfaces, 2012, 4, 3022–3030 Search PubMed.
- V. B. Damodaran and M. M. Reynolds, J. Mater. Chem., 2011, 21, 5870–5872 Search PubMed.
- J. F. Quinn, M. R. Whittaker and T. P. Davis, J. Controlled Release, 2015, 205, 190–205 Search PubMed.
- E. S. M. Bahnson, H. A. Kassam, T. J. Moyer, W. Jiang, C. E. Morgan, J. M. Vercammen, Q. Jiang, M. E. Flynn, S. I. Stupp and M. R. Kibbe, Antioxid. Redox Signaling, 2015, 24, 401–418 Search PubMed.
- M. Douglass, S. Hopkins, R. Pandey, P. Singha, M. Norman and H. Handa, Macromol. Biosci., 2021, 21, 2000248 Search PubMed.
- X. Yao, Y. Liu, J. Gao, L. Yang, D. Mao, C. Stefanitsch, Y. Li, J. Zhang, L. Ou, D. Kong, Q. Zhao and Z. Li, Biomaterials, 2015, 60, 130–140 Search PubMed.
- T. Yang, A. N. Zelikin and R. Chandrawati, Adv. Sci., 2018, 5, 1701043 Search PubMed.
- L. Li, M. Whiteman, Y. Y. Guan, K. L. Neo, Y. Cheng, S. W. Lee, Y. Zhao, R. Baskar, C. H. Tan and P. K. Moore, Circulation, 2008, 117, 2351–2360 Search PubMed.
- D. E. Discher and A. Eisenberg, Adv. Hierarchical Nanostruct. Mater., 2002, 297, 967–973 Search PubMed.
- D. Daubian, J. Gaitzsch and W. Meier, Polym. Chem., 2020, 11, 1237–1248 Search PubMed.
- Y. Mai and A. Eisenberg, Chem. Soc. Rev., 2012, 41, 5969–5985 Search PubMed.
- I. Khan, K. Saeed and I. Khan, Arabian J. Chem., 2019, 12, 908–931 Search PubMed.
- D. Chenthamara, S. Subramaniam, S. G. Ramakrishnan, S. Krishnaswamy, M. M. Essa, F. H. Lin and M. W. Qoronfleh, Biomater. Res., 2019, 23, 20 Search PubMed.
- J. W. Yoo, J. S. Lee and C. H. Lee, J. Biomed. Mater. Res., Part A, 2010, 92, 1233–1243 Search PubMed.
- Y. Zhao, H. Wang and M. Xian, J. Am. Chem. Soc., 2011, 133, 15–17 Search PubMed.
- M. C. Urquhart, F. Ercole, M. R. Whittaker, B. J. Boyd, T. P. Davis and J. F. Quinn, Polym. Chem., 2018, 9, 4431–4439 Search PubMed.
- Y. Zheng, B. Yu, L. K. De La Cruz, M. R. Choudhury, A. Anifowose and B. Wang, Med. Res. Rev., 2018, 38, 57–100 Search PubMed.
- Z. J. Song, M. Y. Ng, Z.-W. Lee, W. Dai, T. Hagen, P. K. Moore, D. Huang, L.-W. Deng and C.-H. Tan, Med. Chem. Commun., 2014, 5, 557–570 Search PubMed.
- N. Kayaman-Apohan and Z. S. Akdemir, Polym. Adv. Technol., 2005, 16, 807–812 Search PubMed.
- H. Wang, Y. Zhao, Y. Wu, Y. L. Hu, K. Nan, G. Nie and H. Chen, Biomaterials, 2011, 32, 8281–8290 Search PubMed.
- U. Bilati, E. Allemann and E. Doelker, J. Microencapsul., 2005, 22, 205–214 Search PubMed.
- K. L. DeCicco-Skinner, G. H. Henry, C. Cataisson, T. Tabib, J. C. Gwilliam, N. J. Watson, E. M. Bullwinkle, L. Falkenburg, R. C. O'Neill, A. Morin and J. S. Wiest, J. Vis. Exp., 2014, 91, e51312 Search PubMed.
- K. Bellacen and E. C. Lewis, J. Vis. Exp., 2009, 33, e1564 Search PubMed.
Footnotes |
| † Electronic supplementary information (ESI) available. See DOI: 10.1039/d1bm00448d |
| ‡ These authors contributed equally to this work. |
| This journal is © The Royal Society of Chemistry 2021 |