
 Open Access Article
 This Open Access Article is licensed under a
 Creative Commons Attribution 3.0 Unported Licence
Enhanced β2-microglobulin binding of a “navigator” molecule bearing a single-chain variable fragment antibody for artificial switching of metabolic processing pathways†
Yusuke
Kambe
 a,
Ken
Kuwahara
ab,
Mitsuru
Sato
c,
Takahiko
Nakaoki
b and
Tetsuji
Yamaoka
*a
a,
Ken
Kuwahara
ab,
Mitsuru
Sato
c,
Takahiko
Nakaoki
b and
Tetsuji
Yamaoka
*a
aDepartment of Biomedical Engineering, National Cerebral and Cardiovascular Center (NCVC) Research Institute, 6-1 Kishibe-Shimmachi, Suita, Osaka 564-8565, Japan. E-mail: yamtet@ncvc.go.jp; Fax: +81-6-6170-1702; Tel: +81-6-6170-1070 (ext. 31009)
bDepartment of Materials Chemistry, Ryukoku University, Seta, Otsu 520-2194, Japan
cAnimal Bioregulation Unit, Division of Animal Sciences, Institute of Agrobiological Sciences, National Agriculture and Food Research Organization (NARO), 1-2 Owashi, Tsukuba, Ibaraki 305-8634, Japan
First published on 1st July 2021
Abstract
Kidney dysfunction increases the blood levels of β2-microglobulin (β2-m), triggering dialysis-related amyloidosis. Previously, we developed a navigator molecule, consisting of a fusion protein of the N-terminal domain of apolipoprotein E (ApoE NTD) and the α3 domain of the major histocompatibility complex class I (MHC α3), for switching the metabolic processing pathway of β2-m from the kidneys to the liver. However, the β2-m binding of ApoE NTD–MHC α3 was impaired in the blood. In the current study, we replaced the β2-m binding part of the navigator protein (MHC α3) with an anti-β2-m single-chain variable fragment (scFv) antibody. The resultant ApoE NTD–scFv exhibited better β2-m binding than ApoE NTD–MHC α3 in buffer, and even in serum. Similar to ApoE NTD–MHC α3, in the mice model ApoE NTD–scFv bound to the liver cells’ surfaces in vitro and accumulated mainly in the liver, when complexed with 1,2-dimyristoyl-sn-glycero-3-phosphocholine (DMPC). Both ApoE NTD–MHC α3 + DMPC and ApoE NTD–scFv + DMPC significantly switched the β2-m accumulation in mice from the kidneys to the liver, but only the ApoE NTD–scFv + DMPC group showed a significantly higher ratio of β2-m accumulation in the liver versus the kidneys, compared with the control group. These results suggest that the enhanced β2-m binding activity of the navigator molecule increased the efficiency of switching the metabolic processing pathway of the etiologic factor.
1. Introduction
The drug-navigated clearance system (DNCS) is a novel therapeutic concept, in which the levels of an etiologic factor of a metabolic disease are decreased by artificially switching its metabolic processing pathways.1,2 A “navigator” drug is critical for this switching: these navigator molecules capture the etiologic factor of interest in the blood and steer it toward another metabolic processing pathway. To achieve this, a typical navigator molecule consists of a capturing part and a steering part; for a highly efficient switching, the former needs to bind strongly to the etiologic factor, while the latter should exhibit a high affinity to surface receptors on a designated metabolic organ.In a previous DNCS study, we aimed at removing β2-microglobulin (β2-m) (molecular weight (MW), 11.8 kDa) from the blood; this molecule is a major component of amyloid fibrils in dialysis-related amyloidosis (DRA).3,4 All nucleated cells express β2-m on their surfaces as the light chain of the major histocompatibility complex (MHC) class I, and secrete the protein into the bloodstream.5 The kidney is the main organ for the β2-m metabolism, for maintaining the plasma levels of β2-m at 1–3 mg L−1 (0.1–0.25 μM).4,6,7 However, kidney dysfunction increases the β2-m levels to 50–100 mg L−1 (4.2–8.5 μM), as reported for long-term dialysis patients.4,6,7 These increased β2-m blood levels are believed to underlie DRA. Previously, we used a fusion protein of MHC class I α3 domain (MHC α3) and the N-terminal domain of apolipoprotein E (ApoE NTD) as the main components of the navigator molecule.2 In this ApoE NTD–MHC α3 protein (MW, 38.0 kDa), MHC α3 captured β2-m and ApoE NTD steered the etiologic factor toward the liver, via low-density lipoprotein receptors (LDLRs). When injected intravenously into mice, 80% of the navigator accumulated in the liver, suggesting that the steering part (i.e., ApoE NTD) functioned well.2 However, the accumulation of β2-m in the liver increased by only ∼10% (from ∼30% to ∼40%) following the navigator injection.2 The low efficiency of the artificial switching of the β2-m metabolic processing pathway was likely owing to the weak binding of MHC α3 to β2-m, because the equilibrium dissociation constant (KD) between MHC α3 and β2-m is on the order of 10−6 M.8 In addition, we found that the MHC α3 binding to β2-m was weaker in serum compared with that in a buffer (Fig. S1†). Therefore, for more efficient switching of the β2-m metabolic processing pathway, the capturing part of ApoE NTD–MHC α3 (i.e., MHC α3) needs to be replaced by another molecule, with stronger binding to β2-m, without losing its β2-m binding activity even in the bloodstream.
Monoclonal antibodies (MAbs) bind to antigens with KDs of 10−10–10−11 M,9 suggesting that anti-β2-m MAb is a good candidate for the capturing part of the navigator molecule, for removing β2-m from the bloodstream. However, intact antibodies are large (MW, 150–900 kDa (ref. 10)), corresponding to a multiplex protein composed of immunoglobulin (Ig) heavy and light chains (H and L chains) interlinked by disulfide bonds. In the DNCS, a navigator with a large MW would cause a metabolic burden on the designated metabolic organ. In addition, because of the complexity of the intact antibody, its proper quaternary structure, which is synonymous with the etiologic factor-binding activity, would be lost during the preparation of the navigator composed of the antibody. Because of its advantages over intact antibodies, we focused on a smaller antibody, a single-chain variable fragment (scFv). This antibody generally consists of one H-chain variable region (VH) and one L-chain variable region (VL) linked with a flexible peptide (GGGGS)3. The MW of scFv is less than one-fifth of that of an intact antibody (25–30 kDa11–13); accordingly, a significant fraction of scFvs maintain their antigen-binding activity even after fusion with other proteins and processing into material formats, such as films and powders.12–14
For efficient switching of the β2-m accumulation from the kidneys to the liver, in this study, we aimed at increasing the β2-m binding activity of the navigator, using scFv as the β2-m capturing part. We produced fusion proteins consisting of ApoE NTD and anti-β2-m scFv (ApoE NTD–scFv; MW, 53.2 kDa), and assessed their β2-m binding activity in serum. To exert the LDLR-binding activity of ApoE NTD,2,15,16 we then formed a complex of ApoE NTD–scFv and 1,2-dimyristoyl-sn-glycero-3-phosphocholine (DMPC) and injected it into mice intravenously, to evaluate the switching of the β2-m accumulation from the kidneys to the liver.
2. Experimental
2.1. Construction of cDNA encoding anti-β2-m scFv
Hybridoma clones producing MAbs against β2-m were established by Nippon Bio-Test Laboratories (Japan). They were prepared from BALB/c mice (6 weeks old, female) immunized with human β2-m using a conventional procedure.Cloning of anti-β2-m scFv was performed as described previously,13 with minor modifications. Briefly, the isotype of anti-β2-m MAb was identified as IgG1 and κ, using an IsoStrip™ mouse MAb isotyping kit (Roche Diagnostics, Germany). Total RNA from hybridoma cells was reverse-transcribed using a SMART™ RACE cDNA amplification kit (Clontech, CA). The cDNA fragments for the VH and VL regions were amplified using the polymerase chain reaction (PCR) with isotype-specific primers, and then mixed and assembled into scFv in a four-step PCR-based amplification using appropriate primers containing the linker sequence (Fig. S2 and Table S1†). The resultant fragment was treated with NotI and XbaI and inserted into the NotI- and XbaI-digested pCAGGS-MCS vector, which was designated pCAG[VH–linker–VL].
2.2. Construction of the expression vector for ApoE NTD-scFv
The expression plasmid for ApoE NTD–scFv was constructed as follows: primer sequences (Sigma-Aldrich, MO) are shown in Table S2.† Restriction sites and DNA sequences encoding the linker were added to the cDNA sequence encoding the anti-β2-m scFv (5′: BamHI and (GGGGS)3-coding DNA; 3′: HindIII) by the PCR, using specific primer sets (sense primer GGGGSx1-26VH-5 and reverse primer 26VL-3), with pCAG[VH–linker–VL] as a template. The resultant PCR product was treated with BamHI and HindIII and inserted into the BamHI- and HindIII-digested pET[ApoE NTD–(GGGGS)3–MHC α3(D227K)] vector.2 This expression plasmid was designated pET[ApoE NTD–(GGGGS)3–scFv]. The correctness of the construct was verified by DNA sequencing and restriction digestion before use.2.3. Production and purification of ApoE NTD-scFv
Recombinant ApoE NTD–scFv protein was produced and purified as previously described.2 Briefly, Escherichia coli strain BL21(DE3) competent cells (Novagen, WI), transformed with the pET[ApoE NTD–(GGGGS)3–scFv] vector, were cultured to express the ApoE NTD–scFv protein. The protein was extracted from pelleted cells by urea denaturation and purified on Ni-chelate (HisTrap FF crude; GE Healthcare, UK) and gel filtration columns (HiLoad 16/600 Superdex 75 pg; GE Healthcare). Then, the ApoE NTD–scFv protein was refolded. During the refolding, a part of the fusion protein precipitated; thus, the protein in the supernatant was concentrated in phosphate-buffered saline (PBS; pH 7.4) by ultrafiltration. The concentration of ApoE NTD–scFv was determined using a bicinchoninic acid assay with bovine serum albumin as a standard. The purity of the fused protein was approximately 90%, as determined by sodium dodecyl sulfate-polyacrylamide gel electrophoresis (SDS-PAGE) band intensity analysis (Fig. S3†). The amino acid sequence of ApoE NTD–scFv is shown in Table S3.† ApoE NTD–Umikinoko Green (ApoE NTD–UKG) and ApoE NTD–MHC α3 were prepared as described previously.22.4. Immunoprecipitation (IP) and western blotting (WB)
IP and WB were performed to characterize the β2-m binding of ApoE NTD–UKG, ApoE NTD–MHC α3, and ApoE NTD–scFv, as described previously,2 with minor modifications. Briefly, ApoE NTD–UKG/MHC α3/scFv (5 μM) and human β2-m (M4890; Sigma-Aldrich) (5 μM) were mixed in PBS and incubated at room temperature (RT) overnight (o/n). Magnetic beads (TAS8848 N1173; Tamagawa Seiki, Japan) conjugated with mouse anti-His tag MAb (D291; Medical and Biological Laboratories, Japan) were added to a solution of ApoE NTD–UKG/MHC α3/scFv and β2-m. An IP assay was performed according to the manufacturer's protocol (Tamagawa Seiki). The resultant immunocomplexes were separated by SDS-PAGE under reducing conditions and transferred to a polyvinylidene fluoride membrane. The membrane was blocked with EzBlock Chem (Atto, Japan) and probed with a rabbit anti-β2-m polyclonal antibody (PAb) (sc-15366; Santa Cruz Biotechnology, TX), followed by incubation with an HRP-conjugated goat anti-rabbit IgG PAb (sc-2004; Santa Cruz Biotechnology). Immunoactive proteins were detected using Chemi-Lumi one super kit (Nacalai Tesque) and a chemiluminescence imaging system (ChemiDoc™ XRS+; Bio-Rad Laboratories, CA).2.5. Enzyme-linked immunosorbent assay (ELISA)
ELISA was used for evaluating the β2-m-binding activity of ApoE NTD–MHC α3 and ApoE NTD–scFv, as described previously,2 with minor modifications. Briefly, ApoE NTD–MHC α3/scFv samples in PBS at different concentrations (0, 50, 100, 150, 200, 300, 400, and 500 nM) were coated onto a 96-well assay polystyrene plate (AGC Techno Glass, Japan), which was then washed five times with PBS containing 0.05% (v/v) Tween 20 (PBS-T). After blocking with a blocking buffer (ELISA assay diluent; BioLegend, CA), β2-m (0 or 1 μg mL−1) in the blocking buffer or in fetal bovine serum (FBS) (Equitech-Bio, TX) was added to the protein-coated plate. After incubation and washing, rabbit anti-human β2-m PAb (13511-1-AP; Proteintech, IL), followed by HRP-conjugated swine anti-rabbit Ig PAb (P0399; Dako, Denmark), was added to the plate. The plate was then washed with PBS-T, and β2-m bound to the protein-coated plate was detected using ELISA POD substrate TMB solution (Nacalai Tesque, Japan). Absorbance at 450 nm was measured using a plate reader (Varioskan™; Thermo Fisher Scientific, MA). Background (0 μg mL−1 β2-m) absorbance was subtracted from the sample (1 μg mL−1 β2-m) absorbance. Three different wells were used for each condition (n = 3).2.6. Binding of ApoE NTD–scFv to plasma proteins
PBS, ApoE NTD–scFv in PBS (100 nM), or the blocking buffer were added to a 96-well assay plate, which was incubated at 4 °C o/n. After washing three times with PBS, Alexa Fluor™ 488-conjugated bovine serum albumin (A13100; Thermo Fisher Scientific) (0.45 mg mL−1) or Alexa Fluor™ 488-conjugated human plasma fibrinogen (F13191; Thermo Fisher Scientific) (0.3 mg mL−1) dissolved in PBS were added to the plate and incubated in dark at 37 °C for 1 h. Then, the plate was washed three times with PBS, and an SDS aqueous solution (10 mg mL−1) was added to the plate to detach the adsorbed proteins. After shaking in the dark at 25 °C for 1 h, the solution was moved to another plate and the sample fluorescence at 525 nm (excitation at 490 nm) was measured using a plate reader. Eight wells were used in this study (n = 8).2.7. Binding of ApoE NTD–scFv + DMPC to liver cells
The binding of ApoE NTD–scFv to liver cells was evaluated as described previously.2 Briefly, ApoE NTD–scFv was labeled with Alexa Fluor™ 555 NHS ester (Invitrogen, CA) and complexed with DMPC (Avanti Polar Lipids, AL) to elicit the liver-navigating function. The formation of the complex of ApoE NTD–scFv and DMPC was confirmed by gel filtration chromatography (Fig. S4†). Normal murine liver (NMuLi) cells (American Type Culture Collection, VA) on a dish were serum-starved o/n, and the medium was replaced with serum-free medium containing DMPC (0.08 mg mL−1), Alexa555-ApoE NTD–scFv (2 μM), or Alexa555-ApoE NTD–scFv + DMPC (Alexa555-ApoE NTD–scFv: 2 μM; DMPC: 0.08 mg mL−1). The cells were incubated at 4 °C for 90 min, washed three times with ice-cold PBS, and observed using a confocal laser scanning microscope (IX-81 and FV1000-D; Olympus, Japan), equipped with a ×20 objective (NA: 0.75; Plan Apochromatic; Olympus). The brightness and contrast of the images were adjusted under the same conditions, using ImageJ software (http://rsb.info.nih.gov/ij/).2.8. Intravenous injection of ApoE NTD–scFv + DMPC into mouse and fluorescence detection
ApoE NTD–scFv was labeled with Alexa Fluor™ 750 NHS ester (Invitrogen) and used for preparing the complex with DMPC, which was sterilized by filtering through 0.22 μm-diameter pores. The body distribution of Alexa750-ApoE NTD–scFv + DMPC was measured as described previously.2 Briefly, Alexa750-ApoE NTD–scFv + DMPC (Alexa750-ApoE NTD–scFv: 12.5 μM; DMPC: 0.8 mg mL−1) was injected into anesthetized mice (C57Bl/6N; male; 9–10 weeks old; 22.7–24.8 g; Japan SLC, Japan) intravenously (for the Alexa750-ApoE NTD–scFv concentration of approximately 1 μM in the blood). After 4 h-long incubation, the mice underwent thoracotomy and laparotomy. Urine and blood were collected, and PBS containing 10 U mL−1 heparin was perfused through the entire body. The organs (the heart, lungs, liver, spleen, kidneys, and intestines) were excised, and plasma was prepared from heparinized blood by centrifugation. Each excised organ was homogenized, and the fluorescence at 776 nm of the resultant suspension (excitation at 749 nm) was measured using a plate reader. Three animals were used in this study (n = 3).2.9. Intravenous injection of β2-m into mouse and fluorescence detection
The ability of ApoE NTD–scFv + DMPC to switch the body distribution of β2-m from the kidneys to the liver was evaluated as described previously.2 Briefly, β2-m was labeled with Alexa Fluor™ 750 NHS ester and mixed with ApoE NTD–MHC α3 + DMPC or ApoE NTD–scFv + DMPC (Alexa750-β2-m: 12.5 μM; ApoE NTD–MHC α3/scFv: 37.5 μM; DMPC: 0.8 mg mL−1), which was incubated at RT o/n and sterilized by filtering through 0.22 μm-diameter pores. The mixture or Alexa750-β2-m alone was injected intravenously into anesthetized mice (C57Bl/6N; male; 7 weeks old; 20.2–24.5 g; Japan SLC) at the Alexa750-β2-m concentration of approximately 1 μM in the blood. After 4 h, the organs, urine, and plasma were harvested and homogenized, and their fluorescence was measured using a plate reader. Eight different animals were used for each condition (n = 8), except for the ApoE NTD–MHC α3 group (n = 7).2.10. Statistical analysis
Two-way analysis of variance (ANOVA), followed by Tukey's post hoc comparisons, was used for analyzing the results of ELISA (Fig. 2A and B), serum protein adsorption (Fig. 3), and body distribution of Alexa750-β2-m in mice (Fig. 6A). One-way ANOVA, followed by Tukey's post hoc comparisons, was used for analyzing the ratio of the β2-m accumulation in the liver to that in the kidneys (Fig. 6B). Statistical significance was set to p < 0.05. KyPlot 2.0 software (KyensLab, Japan) was used for statistical analysis and graphical representations.2.11. Ethics statement
All animal experiments in the current study were conducted in accordance with the animal experiment guidelines of the NCVC Research Institute and approved by the Committee of Laboratory Animals of the NCVC Research Institute (permit numbers, 17048, 18032, 19008, and 20029). All efforts were made to minimize the pain and suffering of the animals. The mice were kept in a temperature-controlled room at 22 °C with a 12 h light–dark cycle. Water and a pellet diet (iVid#2; Oriental Yeast, Japan) were provided ad libitum.3. Results
3.1. Binding of ApoE NTD–scFv to β2 m in PBS
We first tested the binding of ApoE NTD–scFv to β2-m in PBS by IP, using magnetic beads conjugated with anti-His tag MAb, which specifically bound to His-tagged fusion proteins. As shown in Fig. 1, ApoE NTD–UKG did not bind to β2-m because its capturing part consisted only of a fluorescent protein. This suggests that ApoE NTD, the steering part of the navigator molecule, played a less significant role in the binding to β2-m. By contrast, ApoE NTD–MHC α3 and ApoE NTD–scFv bound to β2-m. As the band derived from β2-m captured by ApoE NTD–scFv was wider and darker than that for ApoE NTD–MHC α3, the former fusion protein exhibited higher β2-m binding than the latter.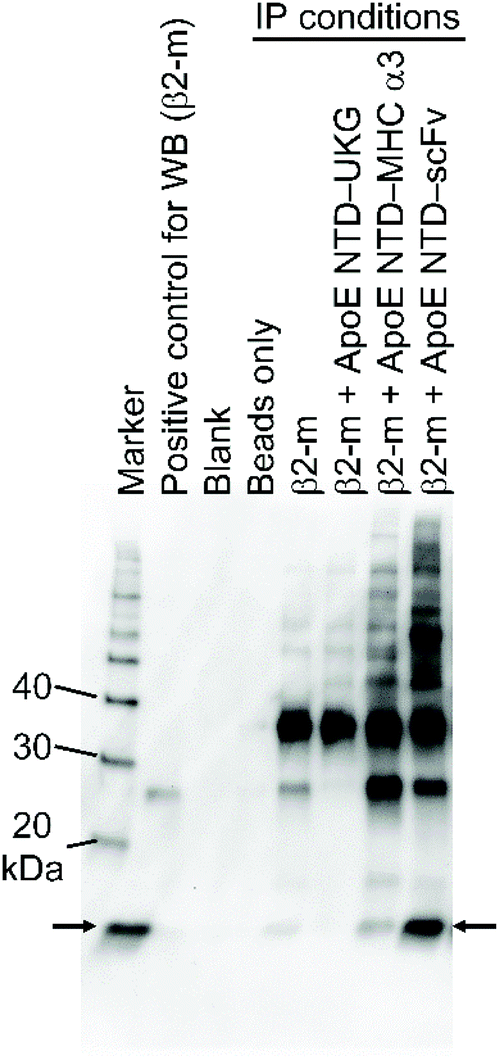 | ||
| Fig. 1 IP assay of ApoE NTD–scFv binding to β2-m in PBS. Magnetic beads without anti-His tag PAb were added to a β2-m solution (beads only). The beads conjugated with PAb were added to solutions containing β2-m, β2-m and ApoE NTD–UKG, β2-m and ApoE NTD–MHC α3, and β2-m and ApoE NTD–scFv. Immunocomplexes were analyzed by WB with anti-β2-m PAb. Arrows indicate the positions of bands derived from β2-m. | ||
3.2. Binding of ApoE NTD–scFv to β2-m in serum
We then performed an ELISA, to quantitatively compare the β2-m-binding activity of ApoE NTD–scFv with that of ApoE NTD–MHC α3, as well as to determine whether ApoE NTD–scFv could maintain its β2-m binding activity even in serum. A 96-well assay plate was coated with various concentrations of ApoE NTD–MHC α3 or ApoE NTD–scFv proteins. A β2-m solution in the blocking buffer or in FBS was added to the protein-coated plate, and β2-m bound to the plate was detected. For both the blocking buffer (Fig. 2A) and FBS (Fig. 2B), the absorbance increased with increasing the ApoE NTD–scFv concentration, and ApoE NTD–scFv exhibited significantly higher absorbance than ApoE NTD–MHC α3, at all considered concentrations. In addition, the ratio of the absorbance of the ApoE NTD–scFv group assessed in FBS to that assessed in the blocking buffer was almost 100%, at all considered concentrations (Fig. 2C). These results suggest that ApoE NTD–scFv exhibits much better β2-m binding than ApoE NTD–MHC α3, even in the blood.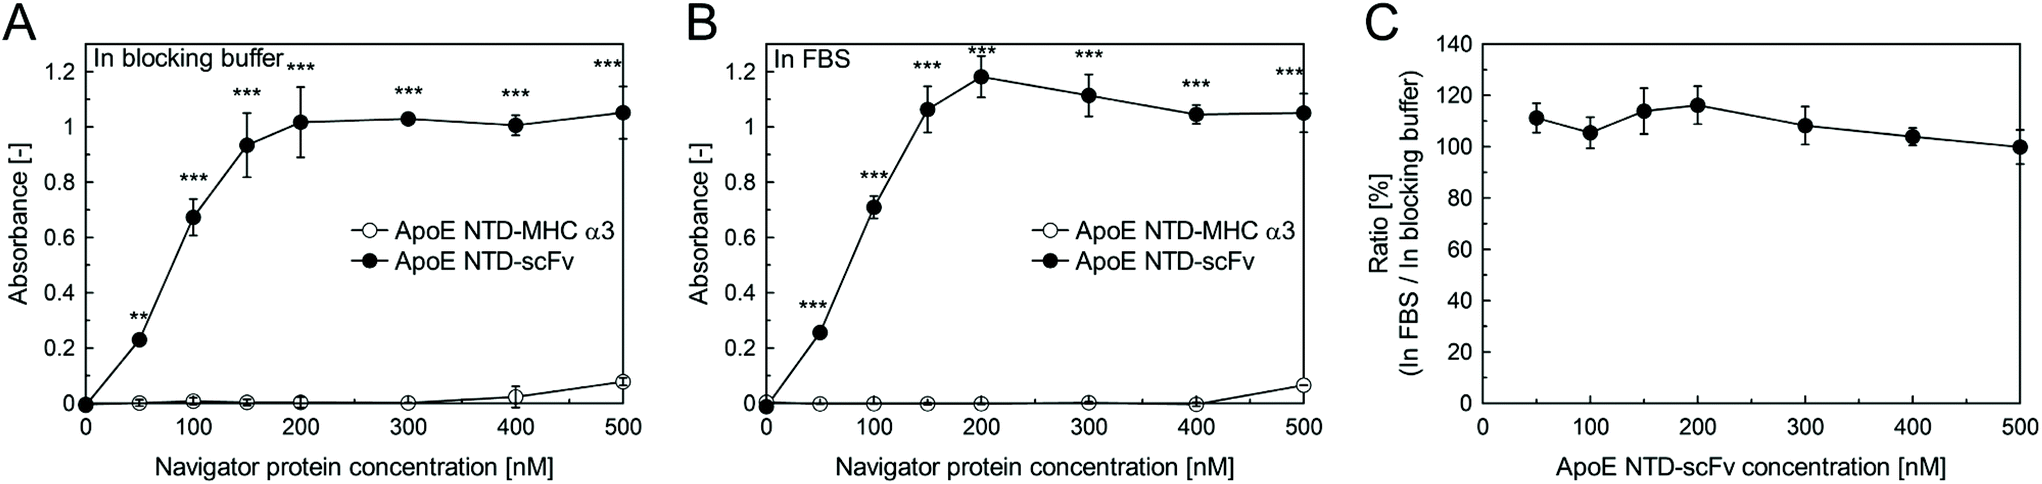 | ||
| Fig. 2 ELISA of β2-m-binding activity of ApoE NTD–MHC α3/scFv in the blocking buffer (A) and in FBS (B). For the ApoE NTD–scFv group, the ratio of the absorbance in FBS to that in the blocking buffer was calculated (C). Data are shown as mean ± SD (n = 3) and were analyzed using two-way ANOVA followed by Tukey's post hoc comparison (**: p < 0.01, ***: p < 0.001). | ||
3.3. Nonspecific binding of ApoE NTD–scFv to plasma proteins
We next evaluated the nonspecific binding of ApoE NTD–scFv to albumin and fibrinogen, which are the main components of plasma proteins. Two-way ANOVA revealed that the plate type significantly affected the plasma protein adsorption. Compared with noncoated polystyrene plates (blank group), those coated with ApoE NTD–scFv or the blocking buffer had significantly less adsorbed serum proteins (Fig. 3). Although the ApoE NTD–scFv group showed higher serum protein adsorption than the blocking buffer group, there were no significant differences between the two groups. Therefore, ApoE NTD–scFv was inferred to have a low affinity for plasma proteins and thus specifically bound to β2-m in the blood.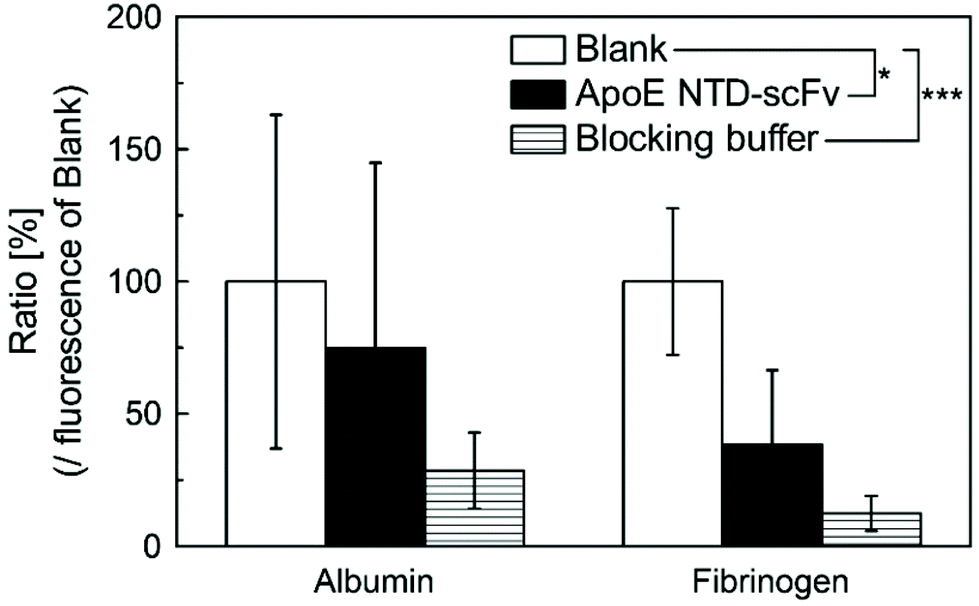 | ||
| Fig. 3 Alexa488-labeled albumin and fibrinogen adsorption to the blank, ApoE NTD–scFv-coated, and blocked polystyrene plates. Fluorescence of the blank group was set to 100%. Data are shown as mean ± SD (n = 8) and were analyzed using two-way ANOVA followed by Tukey's post hoc comparison (*: p < 0.05, ***: p < 0.001). | ||
3.4. Binding of ApoE NTD–scFv to liver cells
We determined whether ApoE NTD–scFv complexed with DMPC could bind to LDLR on the liver cells’ surfaces. A complex of Alexa555-ApoE NTD–scFv and DMPC (Alexa555-ApoE NTD–scFv + DMPC) was added to the serum-free culture medium for NMuLi cells. After incubation at 4 °C to inhibit endocytosis, the cells incubated with Alexa555-ApoE NTD–scFv + DMPC showed stronger fluorescence than the cells incubated with Alexa555-ApoE NTD–MHC α3 or DMPC (Fig. 4). Because our previous study showed that the ApoE NTD in ApoE NTD–MHC α3 bound to LDLR on the liver cells when complexed with DMPC,2 it is very plausible to conclude that ApoE NTD–scFv + DMPC bound to LDLR.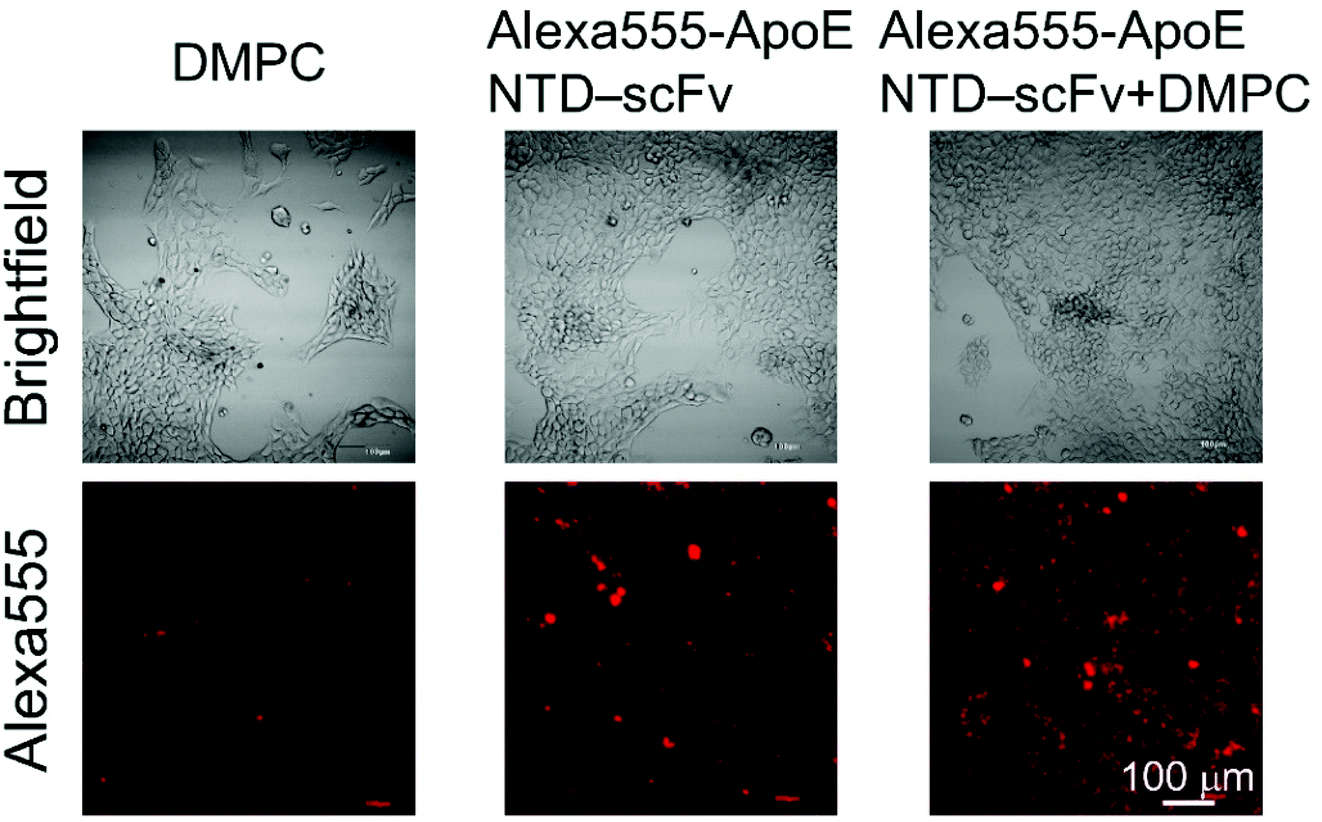 | ||
| Fig. 4 Brightfield and Alexa555-derived fluorescence images of NMuLi cells treated with DMPC, Alexa555-ApoE NTD–scFv, or Alexa555-ApoE NTD–scFv + DMPC. Scale bar = 100 μm. | ||
3.5. Body distribution of ApoE NTD–scFv + DMPC in mice
Alexa750-ApoE NTD–scFv complexed with DMPC (Alexa750-ApoE NTD–scFv) was intravenously injected into C57Bl/6N mice. The navigator predominantly accumulated in the liver, with approximately 75% of the navigator in the liver at 4 h post-injection (Fig. 5). This result agreed well with the liver accumulation of ApoE NTD–MHC α3 + DMPC, in which the specific interaction between the ApoE NTD and LDLR on hepatocytes was inferred to play an essential role.2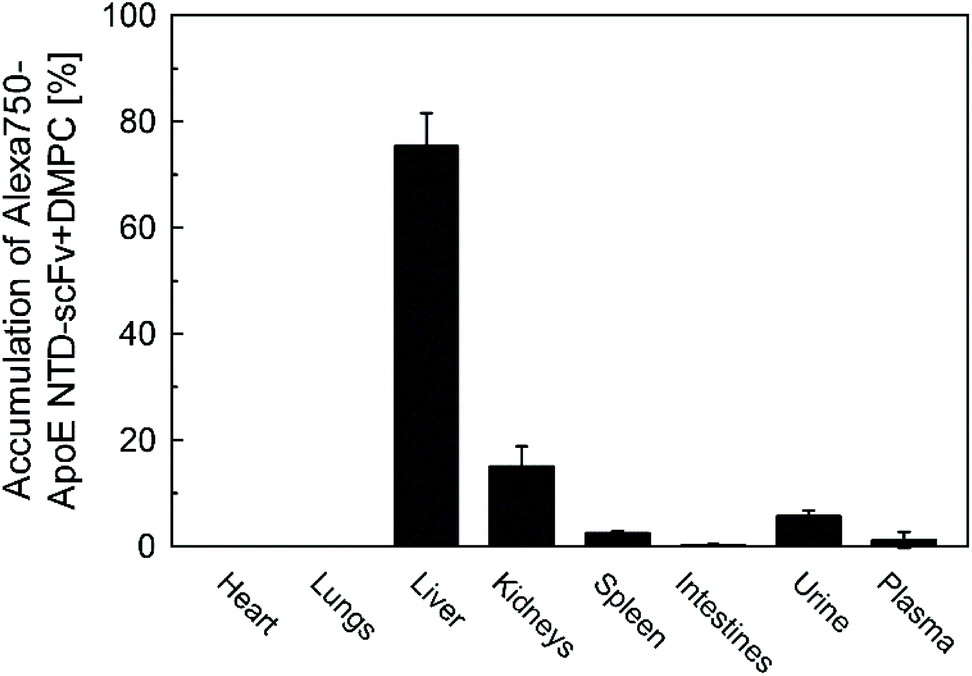 | ||
| Fig. 5 Body distribution of ApoE NTD–scFv + DMPC in C57Bl/6N mice. Alexa750-ApoE NTD–scFv + DMPC was injected into the mice intravenously. Four hours post-injection, the organs were homogenized and Alexa750-derived fluorescence intensity was measured. Data are shown as mean ± SD (n = 3). | ||
3.6. ApoE NTD–scFv + DMPC-induced switching of the body distribution of β2-m in mice
Finally, we tested whether ApoE NTD–scFv + DMPC switched the accumulation of β2-m from the kidneys to the liver in mice more efficiently than ApoE NTD–MHC α3 + DMPC. Alexa750-β2-m was injected into mice intravenously, with/without the navigator molecules. As shown in Fig. 6A, 25% and 50% of β2-m accumulated in the liver and kidneys, respectively, without the navigator molecules (control group). ApoE NTD–MHC α3 + DMPC significantly increased the accumulation of β2-m in the liver and tended to decrease it in the kidneys, which agreed well with the results of a previous study.2 Although there was no significant difference between the ApoE NTD–MHC α3 + DMPC and ApoE NTD–scFv + DMPC groups, the latter group showed significantly larger and smaller β2-m accumulations in the liver and kidneys than the control group. In addition, only the ApoE NTD–scFv + DMPC group showed a significantly higher ratio of the β2-m accumulation in the liver to that in the kidneys, compared with the control group (Fig. 6B). | ||
| Fig. 6 Navigator-induced artificial switching of β2-m accumulation in mice from the kidneys to the liver. (A) Body distribution of β2-m in the presence or absence of ApoE NTD–MHC α3/scFv + DMPC in C57Bl/6N mice. Alexa750-β2-m was injected intravenously with or without ApoE NTD–MHC α3/scFv + DMPC (control: without the navigators). Four hours post-injection, the organs were homogenized and Alexa750-derived fluorescence intensity was measured. Data are shown as mean ± SD (n = 7 and 8) and were analyzed using two-way ANOVA followed by Tukey's post hoc comparison (*: p < 0.05, **: p < 0.01). (B) Ratio of the β2-m accumulation in the liver to that in the kidneys. Data are shown as mean ± SD (n = 7 and 8) and were analyzed using one-way ANOVA followed by Tukey's post hoc comparison (*: p < 0.05). | ||
4. Discussion
In this study, we replaced the β2-m-capturing part of the previously developed navigator protein, ApoE NTD–MHC α3, with an anti-β2-m scFv, for efficient switching of the β2-m accumulation from the kidneys to the liver.The newly developed navigator protein, ApoE NTD–scFv, showed a significantly higher β2-m-binding activity in buffer than ApoE NTD–MHC α3 (Fig. 1 and 2A), which was maintained even in serum (Fig. 2B and C). In addition, the amount of plasma proteins (albumin and fibrinogen) adsorbed onto the ApoE NTD–scFv-coated polystyrene plate was significantly smaller than that adsorbed onto the bare polystyrene plate (Fig. 3). These results suggested that ApoE NTD–scFv could bind to β2-m in the blood more strongly and specifically than ApoE NTD–MHC α3. When complexed with lipids, ApoE NTD changes its molecular structure to expose the LDLR binding site.15,16 Our previous study showed that, after the formation of the complex with DMPC, ApoE NTD–MHC α3 bound to LDLR on liver cells and was taken up by the cells to reach lysosomes in vitro.2 In addition, 80% of ApoE NTD–MHC α3 + DMPC accumulated in the liver of mice, where the navigator was taken up by parenchymal liver cells.2 This would be the case for ApoE NTD–scFv + DMPC, because ApoE NTD–scFv bound to liver cells when complexed with DMPC (Fig. 4) and 75% of ApoE NTD–scFv + DMPC accumulated in the liver of mice (Fig. 5). As the β2-m-binding of ApoE NTD–MHC α3 was unaffected by the complex formation with DMPC,2 the strong, specific β2-m-binding activity of ApoE NTD–scFv was inferred to be maintained even when complexed with DMPC. These findings suggest that ApoE NTD–scFv + DMPC is expected to switch the β2-m accumulation from the kidneys to the liver more efficiently in vivo than ApoE NTD–MHC α3 + DMPC. ApoE NTD–scFv + DMPC, as well as ApoE NTD–MHC α3 + DMPC, switched the accumulation of β2-m from the kidneys to the liver in mice (Fig. 6A). Although there was no significant difference between the β2-m body distribution in the presence of ApoE NTD–MHC α3 + DMPC and that in the presence of ApoE NTD–scFv + DMPC, only the ApoE NTD–scFv + DMPC group showed a higher ratio of the β2-m accumulation in the liver to that in the kidneys, compared with the control group (Fig. 6B). Therefore, scFv-induced enhancement of the β2-m-binding of the navigator could increase the efficiency of switching the β2-m accumulation from the kidneys to the liver.
However, in fact, we expected that ApoE NTD–scFv + DMPC would increase the switching efficiency more obviously, such that over 70% of β2-m would accumulate in the liver, as shown in Fig. 5. We consider that the gap between our ideal-case expectations and the actual observations was owing to the use of healthy mice in the in vivo experiments. The accumulation of β2-m in the kidneys of healthy mice could be detected within 5 min after intravenous injection of Alexa750-β2-m, but it took over 40 min for the labeled navigator to accumulate in the liver of healthy mice (Fig. S5†). This difference between the blood retention of β2-m and the navigator for healthy mice might have obscured the scFv-induced enhanced navigator ability; that is, the rapid removal of free β2-m from the blood would shift the binding reaction between ApoE NTD–scFv and β2-m toward dissociation. We plan to use chronic kidney failure mouse models, such as the 5/6th nephrectomy model,17 to evaluate the navigator function under conditions closer to the clinical situation. Because of the enhanced β2-m-binding activity in serum (Fig. 2), ApoE NTD–scFv + DMPC is expected to remove the etiologic factor retained in the blood of the model animals more efficiently than ApoE NTD–MHC α3 + DMPC.
In the DRA treatment based on DNCS, the liver would be subjected to the degradation of unusual substances (i.e., the navigator and β2-m). After reaching lysosomes in liver cells, β2-m would be degraded by aspartic proteinases, such as cathepsin D, since the proteinase is contained liver cell lysosomes18,19 and degrades β2-m.20 Our previous study also showed no toxicity of the complex of the navigator and β2-m to liver cells in vitro.2 These findings indicate that the DRA treatment based on DNCS might not cause pathological reactions in the liver, but this point should be clarified experimentally in future works.
The anti-β2-m scFv that was developed in this study can be used not only as a component of the navigator but also as an adsorbent for blood purification. Although blood purification therapies, including hemodiafiltration and hemoadsorption, are performed clinically to remove β2-m from the bloodstream, serum proteins, such as albumin, insulin, and lysozyme, are also removed unexpectedly.21–23 Thus, anti-β2-m antibody-based adsorbents have been studied, for specific removal of β2-m.11,24,25 However, the volume of the adsorbents was only a bench scale (<0.1 mL or 1 mg).11,24,25 Previously, we developed transgenic Bombyx mori silkworm strains that produce scFv-fused silk fibroin proteins, which were fabricated into powders and films without losing the antigen-binding activity of scFv.12–14 One transgenic B. mori silkworm produces approximately 0.5–2.5 mg of fusion silk fibroin proteins,26–28 and silk fibroin fibers are used as filtration/separation materials.29,30 Therefore, anti-β2-m scFv-fused silk fibroin may be applied to a productionized β2-m adsorbent and we are currently investigating the fabrication of a scFv-fused silk fibroin column for removing β2-m from the blood.
5. Conclusions
We used scFv as the β2-m-capturing part of the navigator, for switching the metabolic processing pathway of the etiologic factor from the kidneys to the liver. Compared with the previous navigator protein, ApoE NTD–MHC α3, the current one, ApoE NTD–scFv, showed enhanced and specific β2-m binding even in serum. Similar to ApoE NTD–MHC α3, ApoE NTD–scFv bound to the liver cells’ surfaces and accumulated in the liver of mice when complexed with DMPC. ApoE NTD–scFv + DMPC, as well as the previous navigator, switched the β2-m accumulation from the kidneys to the liver in mice, but only the current navigator significantly increased the ratio of the β2-m accumulation in the liver to that in the kidneys, compared with the case without the navigator. The enhanced β2-m binding activity of the navigator could increase the efficiency of switching the metabolic processing pathway of the etiologic factor.Author contributions
Yusuke Kambe: Conceptualization, methodology, validation, formal analysis, investigation, resources, writing – original draft, writing – review & editing, visualization, project administration, funding acquisition. Ken Kuwahara: Validation, investigation, writing – review & editing. Mitsuru Sato: Methodology, investigation, resources, writing – original draft, writing – review & editing, project administration, funding acquisition. Takahiko Nakaoki: Writing – review & editing, supervision. Tetsuji Yamaoka: Conceptualization, writing – review & editing, supervision, project administration, funding acquisition.Conflicts of interest
There are no conflicts to declare.Acknowledgements
The authors thank Dr Kyoko Shioya and the staff of the Laboratory of Animal Experiments and Medicine Management, NCVC, for assisting with the care of the mice. This work was financially supported by the Japan Society for the Promotion of Science Grant-in-Aid for Challenging Research (Pioneering) (grant number, 20K20646) and Intramural Research Fund of NCVC (grant number, 31-2-2).References
- A. Mahara, M. Harada-Shiba and T. Yamaoka, Chem. Pharm. Bull., 2017, 65, 649 CrossRef CAS PubMed.
- Y. Kambe, K. Koyashiki, Y. Hirano, M. Harada-Shiba and T. Yamaoka, J. Controlled Release, 2020, 327, 8 CrossRef CAS PubMed.
- F. Gejyo, T. Yamada, S. Odani, Y. Nakagawa, M. Arakawa, T. Kunitomo, H. Kataoka, M. Suzuki, Y. Hirasawa, T. Shirahama, A. S. Cohen and K. Schmid, Biochem. Biophys. Res. Commun., 1985, 129, 701 CrossRef CAS PubMed.
- F. Gejyo, N. Homma, Y. Suzuki and M. Arakawa, N. Engl. J. Med., 1986, 314, 585 CrossRef CAS PubMed.
- C. Vincent and J. P. Revillard, Contrib. Nephrol., 1981, 26, 66 CAS.
- R. Scarpioni, M. Ricardi, V. Albertazzi, S. de Amicis and L. Zerbini, Int. J. Nephrol. Renovasc. Dis., 2016, 9, 319 CrossRef CAS PubMed.
- T. B. Drüeke and Z. A. Massy, Beta2-microglobulin, Semin. Dial., 2009, 22, 378 CrossRef PubMed.
- A. M. Hebert, J. Strohmaier, M. C. Whitman, T. Chen, E. Gubina, D. M. Hill, M. S. Lewis and S. Kozlowski, Biochemistry, 2001, 40, 5233 CrossRef CAS PubMed.
- J. P. Landry, Y. Ke, G. L. Yu and X. D. Zhu, J. Immunol. Methods, 2015, 417, 86 CrossRef CAS PubMed.
- A. Feinstein and E. A. Munn, Nature, 1969, 224, 1307 CrossRef CAS PubMed.
- E. A. Grovender, B. Kellogg, J. Singh, D. Blom, H. Ploegh, K. D. Wittrup, R. S. Langer and G. A. Ameer, Kidney Int., 2004, 65, 310 CrossRef CAS PubMed.
- M. Sato, K. Kojima, C. Sakuma, M. Murakami, E. Aratani, T. Takenouchi, Y. Yamada and H. Kitani, PLoS One, 2012, 7, e34632 CrossRef CAS PubMed.
- M. Sato, H. Kitani and K. Kojima, Sci. Rep., 2017, 7, 16077 CrossRef PubMed.
- M. Sato, K. Kojima, C. Sakuma, M. Murakami, Y. Yamada and H. Kitani, Sci. Rep., 2014, 4, 4080 CrossRef PubMed.
- C. A. Fisher and R. O. Ryan, J. Lipid Res., 1999, 40, 93 CrossRef CAS.
- P. S. Hauser, V. Narayanaswami and R. O. Ryan, Prog. Lipid Res., 2011, 50, 62 CrossRef CAS PubMed.
- R. F. Gagnon and M. Ansari, Nephron, 1990, 54, 70 CrossRef CAS PubMed.
- A. J. Barrett, Biochem. J., 1970, 117, 601 CrossRef CAS PubMed.
- W. N. Schwartz and J. W. Bird, Biochem. J., 1977, 167, 811 CrossRef CAS PubMed.
- H. Yamamoto, T. Yamada and Y. Itoh, Clin. Chem. Lab. Med., 2000, 38, 495 CAS.
- S. Furuyoshi, M. Nakatani, J. Taman, H. Kutsuki, S. Takata and N. Tani, Ther. Apheresis, 1998, 2, 13 CrossRef CAS PubMed.
- P. G. Ahrenholz, R. E. Winkler, A. Michelsen, D. A. Lang and S. K. Bowry, Clin. Nephrol., 2004, 62, 21 CrossRef CAS PubMed.
- H. Kutsuki, Biochim. Biophys. Acta, 2005, 1753, 141 CrossRef CAS PubMed.
- L. Zhang, B. Zang, C. Huang, J. Ren and L. Jia, Molecules, 2019, 24, 2119 CrossRef PubMed.
- C. Huang, J. Ren, F. Ji, S. Muyldermans and L. Jia, Acta Biomater., 2020, 107, 232 CrossRef CAS PubMed.
- M. Tomita, H. Munetsuna, T. Sato, T. Adachi, R. Hino, M. Hayashi, K. Shimizu, N. Nakamura, T. Tamura and K. Yoshizato, Nat. Biotechnol., 2003, 21, 52 CrossRef CAS PubMed.
- Y. Kuwana, H. Sezutsu, K. Nakajima, Y. Tamada and K. Kojima, PLoS One, 2014, 9, e105325 CrossRef PubMed.
- Y. Kambe, K. Kojima, Y. Tamada, N. Tomita and T. Kameda, J. Biomed. Mater. Res., Part A, 2016, 104, 80 CrossRef CAS PubMed.
- X. Gao, J. Gou, L. Zhang, S. Duan and C. Li, RSC Adv., 2018, 8, 8181 RSC.
- P. M. Gore, M. Naebe, X. Wang and B. Kandasubramanian, J. Hazard. Mater., 2020, 389, 121823 CrossRef CAS PubMed.
Footnote |
| † Electronic supplementary information (ESI) available. See DOI: 10.1039/d1bm00385b |
| This journal is © The Royal Society of Chemistry 2021 |