X-ray micro-computed tomography for heritage building materials
Analytical Methods Committee AMCTB No. 109
First published on 2nd December 2021
Abstract
X-ray micro-computed tomography can provide information about the composition and internal structure of materials commonly found in heritage buildings such as natural stone, mortar, brick, concrete and wood. As it is a non-destructive technique, samples can be scanned multiple times, which makes it particularly suitable for studying weathering processes and the efficacy of treatment methods.
X-ray micro-computed tomography (μCT, pronounced ‘micro-CT’) can provide high-resolution, three-dimensional images that reveal the internal structure of cultural heritage objects.1–4 The resolution and design of μCT are particularly suited for studying building materials as they can elucidate characteristics of the pore network (void space within the material) and changes within it, which can be related to overall material change and the efficacy of treatment methods. Although this brief focuses on building materials, μCT can also be applied to decorative works of art, sculpture and cultural artefacts comprised of these materials.
Practical considerations
The technical details and principle of μCT are described elsewhere.1 However, there are specific considerations for studying heritage building materials:Sampling
There is no such thing as hand-held μCT. In other words, contrary to X-radiography (which can be performed in the field), μCT cannot be done in situ. This means that μCT requires sufficiently representative samples to be taken (destructively) by coring or hammering unless small, detached fragments are available.Sample size
Since the features of interest within building material samples are small, the sample size is a key consideration to ensure adequate resolution. As explained in ref. 1, magnification is obtained by moving the sample closer to the X-ray source. Smaller samples can be moved closer to the source while still fitting within the beam. Therefore, the smaller the sample, the higher the possible magnification and the larger the probable measurement uncertainty. Most detectors have a pixel resolution in the order of 103 pixels in each direction within their frame of view: thus, as a general rule, the sample size under investigation can be at most 1000 times larger than the targeted voxel size (a voxel is the smallest detectable 3D volume, i.e., a measure of spatial resolution). Provided a suitable X-ray tube is available, the dimensions of building material samples for μCT can range from micrometres to several tens of centimetres across, typically in the range of 1–50 mm. The voxel size of the resulting images is of the order of magnitude 1 to 10 μm3. For highly attenuating metals, smaller samples are required, as the resultant signal intensity would otherwise be too low.Contrast between components
There must be enough contrast between the components of a sample for them to be distinguishable by μCT. Contrast depends on the number of X-rays that each component absorbs, which in turn depends on its chemical composition and density. If the sample is comprised of physically and chemically different components (e.g. wood and metal) these will be easily distinguishable. However, if the sample is homogeneous in composition (e.g. a large crystal of a single mineral such as calcite), μCT will not show its structure. Although buildings are composed of different materials, individual samples are often single materials that are comprised of components with similar mineral and chemical compositions. For example, traditional lime mortar is often produced with aggregate comprised of feldspar and quartz. There is enough contrast between the lime binder and the aggregate, but it will be difficult to distinguish between the quartz and feldspar as they have similar densities and compositions. In a lime mortar with limestone aggregates, it will be difficult to separate the lime binder from the aggregate, since they are both comprised of calcium carbonate. Thus, μCT cannot always provide the same information about materials, depending on their properties.However, even within single materials, there is an important phase with significantly different X-ray attenuation: air, typically present in the open pores of a material in ambient conditions. Therefore, μCT has proven to be particularly suited to studying pore networks within building materials, which are an important part of how materials interact with their environments and degrade.
Sample shape
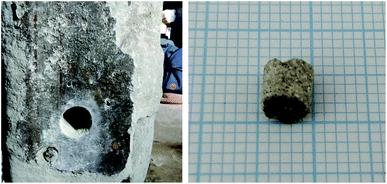
Cylindrical samples are ideal, as they can be placed upright, with their circular cross sections parallel to the plane of rotation. A cylindrical sample also ensures that the thickness of the sample remains constant while being rotated through 360°, resulting in more consistent results. These are most easily collected using drill coring (Fig. 1).Image optimisation
Optimisation balances the operational parameters such as resolution, signal-to-noise ratio, X-ray attenuation to minimise image artefacts. It is system- and sample-dependent and determined by operator expertise, depending on the specific objectives of the investigation.Applications
Characterisation of building materials
Characterising the material properties of building materials, such as porosity and rate of water uptake, is essential to understanding how they will interact with the environment and change over time. While these properties are often understood in ‘bulk’ (on average), μCT can be combined with image analysis to provide higher-resolution information about the pore structure and water movement.This is especially relevant for materials with a significant pore size fraction larger than 1–10 μm, where μCT can be complementary to mercury intrusion porosimetry for pore size analysis (Fig. 2). A similar application is grain size and shape analysis in mortars, for example. These quantitative measurements have one important pitfall for non-expert users: features that are smaller than the image resolution (such as very small pores) cannot be analysed and require advanced approaches. As image analysis requires many subjective decisions to be made, results should be treated with care. Automated analysis algorithms do exist, but they are not necessarily superior to expert human judgement.
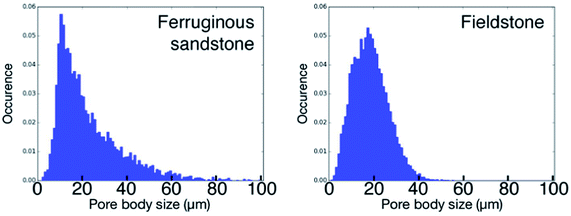 | ||
| Fig. 2 Distribution of pore body sizes for two different types of sandstone (Belgium) based on pore network extraction performed on a μCT dataset. Reprinted from ref. 5 with permission from Elsevier, Copyright 2016. | ||
Image resolution is not the same as the voxel size. In practice, it is preferred that features under investigation, whether pores or grains, should be at least three times larger than the voxel size of the specific scan. This avoids issues of voxels capturing the boundaries of two or more components. Voxels that contain boundaries of two or more components (for example, stone and air) have a mixed signal from all these components, which cannot be easily assigned and cannot be consistently attributed to one or the other.
This has important implications for correctly interpreting results. For example, the porosities of two types of limestone investigated using μCT were reported as 1.45% and 7.19% (Fig. 3). However, it is known that the total open porosity of each is 10.6% and 11.6%, respectively. Hence, the porosity for the first is significantly underestimated since the material (MRC in Fig. 3) has a high number of micropores. In this particular research, water with a contrast agent was used afterwards to improve the estimation of unresolved microporosity, improving the measured total open porosities to 4.4% and 8.7%, respectively. As mentioned above, ‘it is preferred that features under investigation should be at least three times larger than the voxel size’, a condition which is not met for the microporosity in these samples. Hence, results need to be interpreted carefully, considering the limitations of the technique.
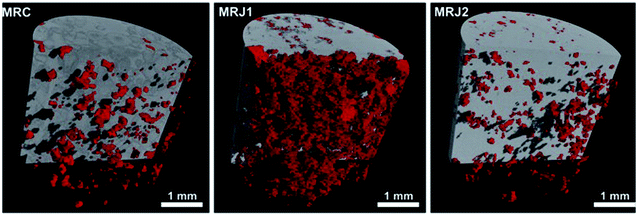 | ||
| Fig. 3 Distribution of the pores in two similar types of limestone with diameters larger than 13.6 μm in red. The voxel size of these images was 4.54 μm3 in a cylindrical sample with a diameter of 4 mm. Reprinted from ref. 6 with permission from Elsevier, Copyright 2014. | ||
Recent advances allow information about features smaller than the image resolution to be retained. These advances have been made by hardware development (e.g. dark field imaging, phase contrast imaging, etc.), methodological improvements (e.g. the use of contrast agents) and new image analysis algorithms, but are rapidly developing and predominantly used only by experts.
Crystallisation processes
The crystallisation of ice and salt are complex processes that can cause visual and structural changes in heritage building materials (Fig. 4). To understand mechanisms of material degradation and the conditions in which they occur, crystallisation can be studied with time-lapse or dynamic (real-time) μCT imaging:• Freeze–thaw weathering (ice crystallisation), revealing cracking as a result of ice wedging and water transport related to ice crystallisation and melting.
• Cycles of dissolution and crystallisation, as well as mobilisation, of soluble salts, based on deliquescence (changes in relative humidity).
• The formation of gypsum crusts and its growth.
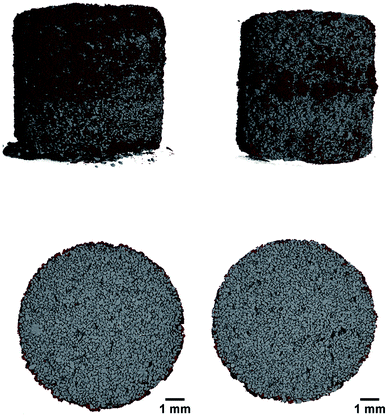 | ||
| Fig. 4 3D rendered X-ray μCT volume and 2D reconstruction of the X-ray μCT scan, with salt crystallisation shown in red. Crystallisation pattern of sodium chloride on a cylindrical stone sample at 20% relative humidity (left) and 50% (right). Reprinted from ref. 7 with permission from Elsevier, Copyright 2017. | ||
μCT can be used to study these processes in materials and environments that are representative of real buildings and scenarios. This can be used to determine suitable replacement materials, assess the relative risk posed by different scenarios and/or various materials, and inform environmental control measures.
Conservation treatments
Testing conservation treatments before applying them to heritage building materials is an important part of determining their suitability for a material and the relevant context(s). This often relies on in situ testing (non- or semi-destructive) resulting in indirect empirical evidence. μCT can be used to study consolidation or water-repellent products, providing information about the product deposition within the pore system. In this example (Fig. 5) using 2D X-radiography, the deposition of nanolime† particles for consolidation of a heritage limestone was studied for several modes of application, and it was concluded that there was a more effective in-depth deposition of the consolidant‡ when water was added to the alcoholic suspension of nanoparticles.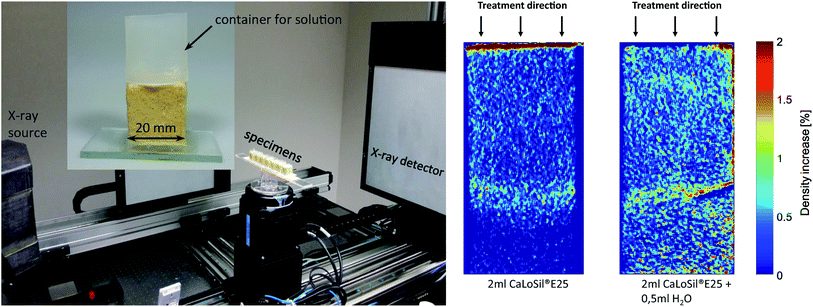 | ||
| Fig. 5 Left: experimental apparatus of the X-ray radiography measurement. Right: X-ray radiographic images of samples treated with nanolime† and alcohol suspension (left), and nanolime† and alcohol suspension with water (right). Reprinted from ref. 8 with permission from Elsevier, Copyright 2017. | ||
Tim De Kock (Antwerp Cultural Heritage Sciences, University of Antwerp) and Scott Allan Orr (UCL Institute for Sustainable Heritage).
This Technical Brief was prepared for the Analytical Methods Committee (AMC), with contributions from members of the AMC Heritage Science Expert Working Group, and approved by the AMC on 14 October 2021.
Further reading
- AMC Technical Brief No. 98, X-ray micro computed tomography in cultural heritage. (AMC Technical Brief), Anal. Methods, 2020, 12, 4496–4500, 10.1039/D0AY90112A
.
- V. Cnudde and M. N. Boone, High-resolution X-ray computed tomography in geosciences: a review of the current technology and applications, Earth-Sci. Rev., 2013, 123, 1–17, DOI:10.1016/j.earscirev.2013.04.003
.
- V. Cnudde, T. De Kock, M. A. Boone, W. De Boever, T. Bultreys, J. Van Stappen, D. Vandevoorde, J. Dewanckele, H. Derluyn, V. Cárdenes Van den Eynde and L. Van Hoorebeke, Conservation studies of cultural heritage: X-ray imaging of dynamic processes in building materials, Eur. J. Mineral., 2015, 27, 269–278, DOI:10.1127/ejm/2015/0027-2444
.
- R. A. Ketcham and W. D. Carlson, Acquisition, optimization and interpretation of X-ray computed tomographic imagery: applications to the geosciences, Comput. Geosci., 2001, 27, 381–400, DOI:10.1016/S0098-3004(00)00116-3
.
- W. De Boever, T. Bultreys, H. Derluyn, L. Van Hoorebeke and V. Cnudde, Comparison between traditional laboratory tests, permeability measurements and CT-based fluid flow modelling for cultural heritage applications, Sci. Total Environ., 2016, 554, 102–112 CrossRef PubMed
.
- M. A. Boone, T. De Kock, T. Bultreys, G. De Schutter, P. Vontobel, L. Van Hoorebeke and V. Cnudde, 3d mapping of water in oolithic limestone at atmospheric and vacuum saturation using X-ray micro-CT differential imaging, Mater. Char., 2014, 97, 150–160 CrossRef CAS
.
- L. Grementieri, L. Molari, H. Derluyn, J. Desarnaud, V. Cnudde, N. Shahidzadeh and S. de Miranda, Numerical simulation of salt transport and crystallization in drying Prague sandstone using an experimentally consistent multiphase model, Build. Environ., 2017, 123, 289–298 CrossRef
.
- K. Niedoba, Z. Slížková, D. Frankeová, C. L. Nunes and I. Jandejsek, Modifying the consolidation depth of nanolime on Maastricht limestone, Constr. Build. Mater., 2017, 133, 51–56 CrossRef CAS
.
Footnotes |
| † Nanolime is a dispersion of synthesised calcium hydroxide in an alcoholic medium. |
| ‡ Substances applied to materials, such as rotten wood, to provide solidity and strength. |
| This journal is © The Royal Society of Chemistry 2021 |


