
 Open Access Article
 This Open Access Article is licensed under a
 Creative Commons Attribution 3.0 Unported Licence
Spectral imaging of pharmaceutical materials with a compact terahertz difference-frequency generation semiconductor source
Atsushi
Nakanishi
 *,
Koichiro
Akiyama
,
Shohei
Hayashi
,
Hiroshi
Satozono
and
Kazuue
Fujita
*,
Koichiro
Akiyama
,
Shohei
Hayashi
,
Hiroshi
Satozono
and
Kazuue
Fujita
Central Research Laboratory, Hamamatsu Photonics K. K., Hamamatsu, Shizuoka, Japan. E-mail: nakanishi@crl.hpk.co.jp
First published on 15th November 2021
Abstract
Spectral imaging of pharmaceutical material using a compact ultra-broadband (1–4 THz) terahertz semiconductor source was demonstrated. False-color RGB images could be obtained using a simple procedure (calibration free). The ability to distinguish the polymorphism of carbamazepine (CBZ), the hydrate forms of D-(+)-glucose and caffeine, and the crystallinity of nifedipine was demonstrated using the THz DFG source. Crystal forms of pharmaceutical materials can be distinguished using this method.
1. Introduction
Identification of different crystal forms (crystallinity, hydrate form and polymorphism) is important in pharmaceutical science. X-ray powder diffractometry1 and laser Raman spectroscopy2 are used to analyze the crystal forms of pharmaceutical solids. Recently, measurements using terahertz (THz) spectroscopy have been reported as a non-destructive testing tool.3–7 The THz spectroscopy is expected to be used as a process analytical technology (PAT) tool for the real-time, quality assessment of pharmaceutical materials. THz waves lie between the infrared and microwave regions of the electromagnetic spectrum and can be defined as having a frequency of between 0.1 and 10 THz, corresponding to a wavenumber of 3.3 to 333 cm−1. Frequencies corresponding to low frequency bond vibrations, crystalline phonon vibrations, hydrogen-bonding stretches, and torsion vibrations exist in the THz region.8,9 Therefore, crystallinity, hydrate form and polymorphism can be monitored in pharmaceutical substances by means of THz spectroscopy. THz spectroscopy could be a suitable alternative technology for validating the quality of pharmaceutical drugs.10 In particular, THz spectroscopic imaging is useful for evaluating the distribution and uniformity of the constituents of pharmaceutical tablets.THz spectroscopic imaging has been widely demonstrated using THz time-domain spectroscopy (THz-TDS).11 THz-TDS measurements require a femtosecond laser source. THz-TDS techniques can provide spectral information over a broad bandwidth (several THz), however, THz-TDS faces some hurdles before being adopted for practical applications, and these include: stability of the measurement environment (temperature stability and low vibrations), and the need for skilled technicians. Because the THz signal decreases easily due to misalignment of the optical pass, for example, by misalignment of the laser irradiation position on a generation element or a detection element. For the pharmaceutical industry, imaging systems using robust and broadband THz light sources are required.
A THz source based on intra-cavity difference-frequency generation (DFG) in a two-wavelength mid-infrared quantum cascade laser (QCL) integrated with two different laser active regions12 uses mid-infrared active regions engineered to exhibit a large second-order nonlinear susceptibility χ(2) for an efficient THz DFG process. In 2015, by introducing the homogeneous active region concept, the performance of THz DFG sources was dramatically improved.13 Currently, these are the only electrically pumped monolithic semiconductor and room-temperature sources that operate at frequencies between 0.6 THz and 6 THz.14–17 For a broadband THz DFG source, frequency tuning and calibration are unnecessary because frequency selectivity can be achieved by changing the frequency bandpass filter (BPF). In this work, distinguishing the polymorphism of carbamazepine (CBZ), hydrate forms of D-(+)-glucose and caffeine, as well as the crystallinity of nifedipine, were demonstrated by spectroscopic imaging based on a THz DFG source. Additionally, it was found that crystal forms of samples could be distinguished by quantitative evaluation.
The THz DFG source used is a compact device, as shown in Fig. 1.
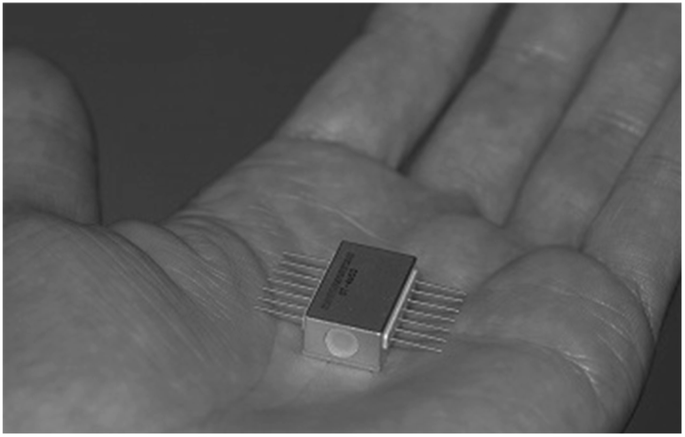 | ||
| Fig. 1 Photograph of a hermetic butterfly-package of a THz DFG source. | ||
The ability to perform spectroscopic imaging of a pharmaceutical material using this compact ultra-broadband THz DFG source was demonstrated in this work.
2. Experimental
2.1 Imaging samples
The CBZ form III, nifedipine (crystalline form), and anhydrous D-(+)-glucose were obtained from Fujifilm Wako (Osaka, Japan) and used without further purification. Anhydrous caffeine and caffeine monohydrate were obtained from Kanto Chemical (Tokyo, Japan) and used without further purification. The D-(+)-glucose was obtained from Sigma-Aldrich (St. Louis, USA) and used without further purification. CBZ form I was obtained by heating CBZ form III to 180 °C for 2 h, as described by Day et al.18 An amorphous form of nifedipine was obtained by heating the crystal form to 180 °C for 1 h and then cooling it to room temperature in air. The sample powder was mixed with poly(ethylene) (PE) powder at different weight ratios and then compressed into pellets with a hydraulic press under 2 tons of pressure. The amounts of the substances contained were: CBZ: 20 wt%, caffeine: 40 wt%, D-(+)-glucose: 20 wt%, and nifedipine: 40 wt%. The pellets were placed on a test object with three through-holes having diameters of 3 mm (Fig. 3(a)).2.2 Imaging system
The THz DFG source was operated at 240 K, which is a temperature that can be achieved with a thermoelectric cooler (TEC). This device exhibited a broadband THz emission spectrum between about 1.5 THz and about 3.3 THz.19 Spectroscopic imaging was performed by using frequency BPFs. The THz DFG source was operated at a current of 1.7 A (duty cycle: 2%, and repetition rate: 100 kHz). The THz spectra obtained at 240 K, are shown in Fig. 2, and exhibit broadband multi-mode THz emission spanning over more than 2.5 octaves, from 1.0 to 3.5 THz. Fig. 3(a) shows a schematic diagram of a test object with samples (PE, sample A and sample B). Fig. 3(b) is the experimental setup of the transmission imaging system. The THz radiation from the device was collimated with an off-axis parabolic reflector (f = 50 mm). The collimated THz beam was focused onto the test object using a PE polymer lens (f = 40 mm, Tsurupica®, Pax, Sendai, Japan). The THz radiation transmitted through the object was recollimated using another polymer lens (Tsurupica®, f = 40 mm). The collimated beam was collected on a Golay cell detector using another off-axis parabolic reflector (f = 100 mm). For image acquisition, the test object was XY scanned with a two-axis mechanical stage that moved it through the focused beam (raster-scanning method). Because the Golay cell detector was a thermal detector, the acquisition time, which was limited to a time constant of the Golay cell detector, was approximately 2 s per point. It took about 90 min to acquire the image (9 mm × 13 mm: 45 × 65 pixels, 200 μm steps). To obtain the spectroscopic images at a specific frequency, the BPF of that frequency was placed in front of the detector. Fig. 4 shows the transmission spectra of BPFs having different central transmission frequencies, namely, 2.0 THz, 2.2 THz, 2.5 THz, and 3.0 THz (FB19M150, FB19M135, FB19M120 and FB19M100, respectively, Thorlabs, NJ, USA, currently discontinued), obtained using a THz time-domain spectroscopy system. The average frequency bandwidth was about 0.4 THz (FWHM). | ||
| Fig. 2 The THz spectrum of the THz DFG source at 240 K. | ||
 | ||
| Fig. 3 (a) Schematic diagram of a test object with samples (PE, sample A and sample B). (b) The THz transmission imaging system. The object is mounted on a computer-controlled XY translation stage (45 pixels × 65 pixels, 0.2 mm steps). | ||
 | ||
| Fig. 4 Transmission of a commercially available frequency bandpass filter (BPF). | ||
2.3 The THz time-domain spectroscopy
To confirm the absorption peaks of the samples, the transmission waveforms were measured and the absorption coefficients were calculated using a THz-TDS system. The THz-TDS system includes a near-infrared (NIR) femtosecond laser source, an emitter, and a receiver. Femtosecond laser pulses from the laser source were split into pump and probe pulses by a beam splitter. The THz pulses were generated when pump pulses were focused onto a photoconductive antenna (emitter). The THz radiation could be detected using an optically gated photoconductive antenna (receiver) similar to the emitter. The probe pulses optically gate the receiver. The time delay between the THz and the optical pulse was varied to acquire the electric field of THz waveform in the time-domain.As an analysis method for THz-TDS measurements, the acquired THz electric field of both the reference and sample waveform in the time-domain were converted to a complex frequency-domain electric field (Eref(ω), and Esam(ω), respectively), via fast Fourier transform (FFT). The complex transmission function T(ω) was expressed by the following equation:20
 | (1) |
 | (2) |
 | (3) |
The measurements were conducted in a humid atmosphere (relative humidity of about 28%). All the samples for TDS measurement were diluted in PE to a 50 wt% concentration. Spectra ranging from 0.5 THz to 3 THz were obtained and accumulated 10 times to obtain a better signal-to-noise ratio. Three independent samples (one of each material) were measured and the average absorption spectra with error bars were obtained.
3. Results
3.1 Polymorphism of carbamazepine
The CBZ is used to prevent and control seizures. Fig. 5(a) shows the THz absorption coefficients of CBZ I and CBZ III. A Hanning window function was used to remove noise and etaloning artifacts. According to reports in the literature,21,22 CBZ I has absorption peaks at 0.9, 1.3, 1.6, and 2.1 THz, and the peaks of CBZ III are at 1.2 and 1.8 THz. The observed peaks of CBZ I and CBZ III in this work are in good agreement with the reported values. Also, according to another study in the literature,22 peaks of CBZ III were also found at 3.2 THz. A spectroscopic image (false-color image) was obtained by combining R, G, and B images (imaging results acquired at three different frequencies). The DFG source exhibited a THz emission spectrum between about 1.5 THz and about 3.5 THz. Therefore, a THz image we acquired at 3.3 THz using a 3.3 THz BPF (FB19M90, Thorlabs, currently discontinued). Then, a false-color THz image was composed by using the detector with different BPFs (center frequencies of 2.0 THz, 2.5 THz, and 3.3 THz for the red channel, green channel, and blue channel, respectively), as shown in Fig. 5(b). Fig. 5(c)–(e) show the histograms of the false-color THz image of each sample (PE, CBZ I, and CBZ III, respectively).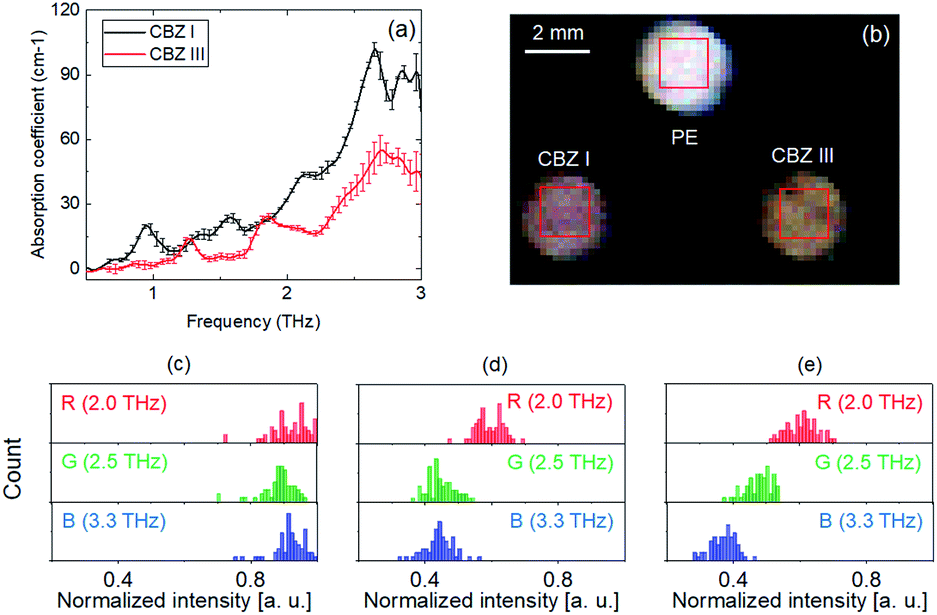 | ||
| Fig. 5 (a) The absorption coefficients of CBZ I and CBZ III. (b) False-color THz image of PE, CBZ I, and CBZ III, ((c) to (e)) histograms of pixel intensity of the samples in (b) (PE, CBZ I, and CBZ III, respectively). | ||
As shown in Fig. 5(b), PE appears as white because it has an almost equal high transparency in all channels (Fig. 5(c)). The CBZ I appears as pink because it has absorption in the green and blue channels (Fig. 5(d)). The CBZ III appears as orange because it has moderate absorption in the green channel and high absorption in the blue channel (Fig. 5(e)). Thus, from the false-color RGB image obtained with the spectroscopic imaging system, the polymorphism of carbamazepine could be distinguished.
3.2 Hydrate forms of caffeine and D-glucose
Fig. 6(a) shows the THz absorption coefficients of anhydrous caffeine and caffeine monohydrate. A Hamming window function was used to remove noise and etaloning artifacts. There was no major absorption peak in the anhydrous caffeine spectrum, whereas the spectrum of the monohydrate caffeine exhibited a peak at 2.2 THz. The THz data were in good agreement with those previously reported.23 A THz image was obtained by using the detector with different BPFs (center frequencies of 2.0 THz, 2.2 THz, and 3.0 THz for the red channel, green channel and blue channel, respectively). Then, a false-color image was composed by combining the R, G, and B images, as shown in Fig. 6(b). Fig. 6(c) and (d) show the histograms of each sample in the THz image in Fig. 6(b) (PE, anhydrous caffeine, and caffeine monohydrate, respectively).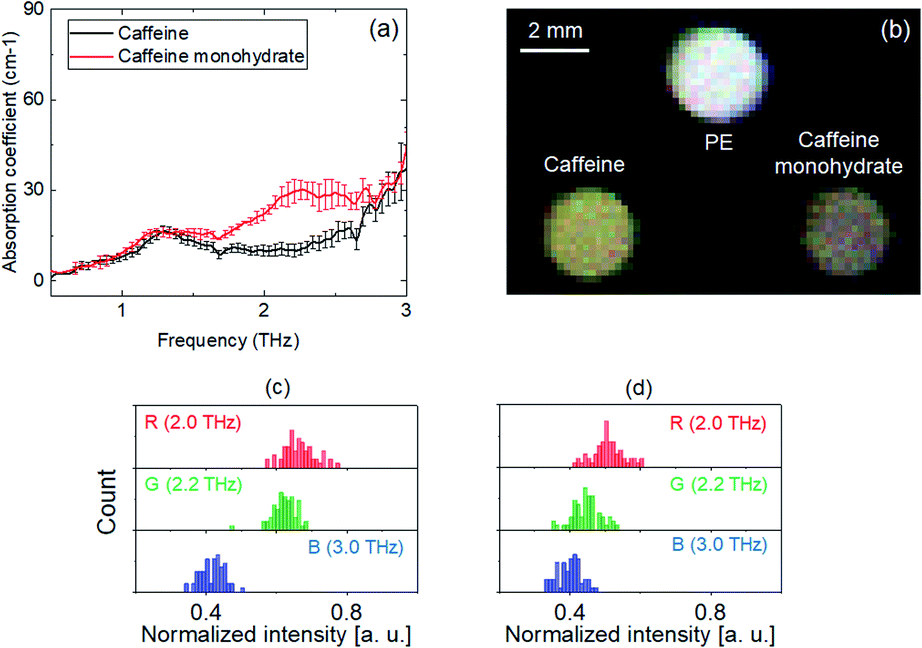 | ||
| Fig. 6 (a) Absorption coefficient of caffeine and caffeine monohydrate. (b) False-color THz image of PE, caffeine, and caffeine monohydrate. ((c) to (d)) Histograms of the pixel intensity of the samples shown in (b) (caffeine, and caffeine monohydrate, respectively). | ||
As shown in Fig. 6(b), anhydrous caffeine appears as yellow because it has high absorption in the blue channel (Fig. 6(c)). Caffeine monohydrate appears as pink because it has absorption in the green and blue channels (Fig. 6(d)). Thus, from the false-color RGB image obtained with the spectroscopic imaging system, the hydrate form of caffeine could be distinguished.
In addition, Fig. 7(a) shows the THz absorption coefficients of anhydrous D-(+)-glucose and D-(+)-glucose monohydrate. A Hamming window function was used to remove noise and etaloning artifacts. According to a previous paper,23 anhydrous D-glucose has a major absorption peak at 1.44 THz, a broad absorption peak at ∼2.6 THz, and weak absorption peaks at 1.29 THz and 2.10 THz. However, D-glucose monohydrate has remarkable absorption peaks at 1.82, 1.98 and 2.46 THz. The THz data obtained in this study were in good agreement with those previously reported.23 A THz image was obtained by using a detector with different BPFs (center frequencies of 2.0 THz, 2.5 THz, and 3.0 THz for the red channel, green channel and blue channel, respectively). Then, a false-color image was obtained by combining the R, G, and B images, as shown in Fig. 7(b). Fig. 7(c) and (d) show the histograms of each sample in the THz image in Fig. 7(b) (anhydrous D-glucose, and D-glucose monohydrate, respectively). As shown in Fig. 7(b), anhydrous D-glucose appears as pink because it has absorption in the green and blue channels (Fig. 7(c)). D-glucose monohydrate appears as purple-white because it has relatively high absorption in the green channel (Fig. 7(d)). Thus, from the false-color RGB images obtained with the spectroscopic imaging system, the hydrate form of D-glucose could also be distinguished. Thus, this demonstrated the identification of the hydrate form of the D-glucose with a THz DFG source.
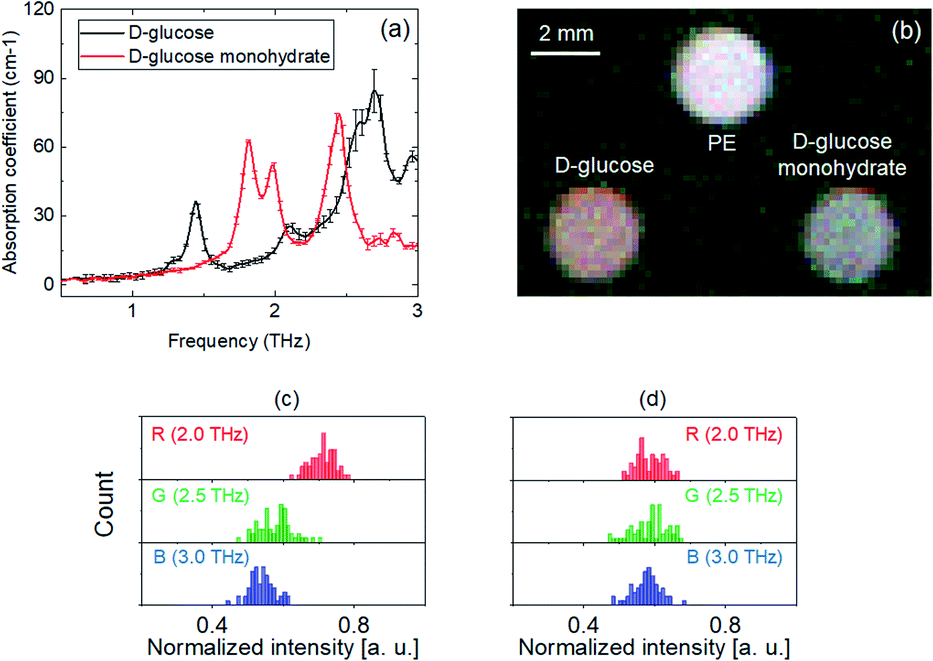 | ||
| Fig. 7 (a) Absorption coefficient of D-glucose and D-glucose monohydrate. (b) False-color THz image of PE, D-glucose, and D-glucose monohydrate. ((c) to (d)) Histograms of the pixel intensity of the samples shown in (b) (D-glucose, and D-glucose monohydrate, respectively). | ||
3.3 Crystallinity of nifedipine
Nifedipine is a selective calcium channel protein inhibitor used to treat hypertension or cardiovascular disorders. The THz absorption peak of nifedipine is 1.2 THz.24Fig. 8(a) shows the THz absorption coefficients of crystalline nifedipine and amorphous nifedipine. A Hamming window function was used to remove the noise and the etaloning artifacts. This confirmed the absorption peak at 1.2 THz and another absorption peak at 2.2 THz. The absorption of amorphous nifedipine monotonically increased with frequency. The pellet sample was fabricated under a not so strong pressure, after considering the results of the previous study on THz measurement for pharmaceutical materials.7,23–25 To confirm subtle changes in the crystal forms, second-derivative waveforms were calculated from the absorption spectra. Fig. 8(b) shows the second derivative of the THz absorption of crystalline nifedipine and amorphous nifedipine. In amorphous nifedipine, absorption peaks at 1.2 THz and 2.2 THz were not found. The influence of the crystal forms on the compression was considered to be low. The spike at 1.7 THz was caused by water vapor. | ||
| Fig. 8 (a) Absorption coefficient of crystalline nifedipine and amorphous nifedipine. (b) Second derivative of the THz absorption of crystalline nifedipine and amorphous nifedipine. (c) False-color THz image of PE, crystalline nifedipine, and amorphous nifedipine. ((d) to (e)) Histograms of the pixel intensity of the samples shown in (b) (amorphous nifedipine, and crystalline nifedipine, respectively). | ||
A THz image was obtained by using the detector with different BPFs (center frequencies of 2.0 THz, 2.2 THz, and 3.0 THz for the red channel, green channel, and blue channel, respectively). Then, a false-color image was obtained by combining the R, G, and B images. The image contrast was low because the difference between the absorption peaks of the crystalline and amorphous forms at 2.2 THz was not large. Therefore, contrast enhancement was applied using a sigmoid transformation:25
 | (4) |
Fig. 8(d) and (e) show the histograms of each sample in the THz image (before contrast enhancement), and in the inset in Fig. 8(c) (amorphous nifedipine, and crystalline nifedipine, respectively). As shown in Fig. 8(c), amorphous nifedipine appears to be pink because it has moderate absorption in the green and blue channels (Fig. 8(d)). Crystalline nifedipine appears to be orange because it has low absorption in the red channel and moderate absorption in the green channel (Fig. 8(e)). Although it was expected to exhibit strong absorption in the green channel, the attenuation was moderate in the green channel because the green channel contained a 2.0 THz frequency component due to the 0.4 THz frequency bandwidth of the BPF. Thus, from the false-color RGB image obtained with spectroscopic imaging system, the crystallinity of nifedipine could be distinguished.
3.4 Quantitative evaluation
For automated validation, it was important to evaluate pharmaceutical materials by using numerical values. Therefore, distinguishing samples was demonstrated using numerical values obtained from the spectroscopic images.From the histogram results shown in (Fig. 5(d) and (e), 6(c) and (d), 7(c) and (d), and 8(d) to (e)), the averages and standard deviation were calculated. Table 1 shows the average and standard deviation of the intensity of the samples in false-color THz images. Fig. 9(a)–(d) show the 3D plots of the numerical values (Table 1) on the R, G, and B axes. As shown in Fig. 9(a)–(d), the crystalline forms of CBZ, caffeine, D-glucose and nifedipine were distinguished using the numerical values, including the error bar. Quantitative assessment of pharmaceutical samples having different crystal forms (crystallinity, hydrate form and polymorphism) by using this method was demonstrated.
| Sample | R | G | B | |||
|---|---|---|---|---|---|---|
| Ave. | SD | Ave. | SD | Ave. | SD | |
| CBZ I | 0.596 | 0.041 | 0.449 | 0.041 | 0.443 | 0.043 |
| CBZ III | 0.607 | 0.044 | 0.479 | 0.038 | 0.371 | 0.037 |
| Caffeine | 0.666 | 0.043 | 0.624 | 0.034 | 0.419 | 0.033 |
| Caffeine monohydrate | 0.509 | 0.043 | 0.448 | 0.039 | 0.400 | 0.033 |
| D-Glucose | 0.711 | 0.034 | 0.579 | 0.046 | 0.541 | 0.036 |
| D-Glucose monohydrate | 0.588 | 0.038 | 0.588 | 0.051 | 0.579 | 0.039 |
| Nifedipine (crystalline) | 0.491 | 0.036 | 0.422 | 0.035 | 0.355 | 0.033 |
| Nifedipine (amorphous) | 0.430 | 0.035 | 0.396 | 0.041 | 0.377 | 0.032 |
 | ||
| Fig. 9 (a) to (d) The 3D plots of the numerical values on the R, G, and B axes (CBZ I and CBZ III, caffeine and caffeine monohydrate, D-glucose and D-glucose monohydrate, and crystalline nifedipine and amorphous nifedipine, respectively). | ||
4. Discussion
False-color imaging by using BPFs and a broad-band THz wave was demonstrated in this work. However, false-color imaging may not be the optimal method for validating pharmaceutical materials. In some case, tunable single frequency radiation would be suitable for the validation of materials. In principle, tunable single frequency emission is possible by using a THz DFG source with an extra cavity setup.26 Although frequency calibration is necessary, single frequency radiation may provide high-accuracy measurements and be suitable for automation validation. Therefore, as a next step, a frequency tunable THz DFG source and its spectroscopic imaging application will be investigated.For the THz DFG source, once the imaging system was fabricated, optical alignment was almost unnecessary. It is considered that applications based on THz DFG source are stable and easy-to-use compared with applications based on THz-TDS. However, currently, the THz DFG source imaging may be disadvantageous in the dynamic range (DR), compared with the THz-TDS imaging. The DR of typical THz-TDS measurement (Fourier transformed THz amplitude) was ∼2000.27 Therefore, in terms of DR, the THz-TDS imaging is superior to the DFG source imaging.
Also, the measurement speed of the imaging system was slow because a thermal detector was used which was limited to a time constant. To realize real time imaging using room-temperature microbolometer arrays, the average power needs to be improved. Because there is some room for improvement (increase of THz generation power and improvement of outcoupling efficiency of DFG sources), it is believed that the THz DFG source has a potential for real time imaging.
5. Conclusion
In conclusion, spectroscopic imaging based on a THz DFG source using frequency bandpass filters has been demonstrated for use in applications for evaluating pharmaceutical drugs. Images were obtained in three frequency bands (low frequency, middle frequency, and high frequency) in a frequency range between 2 THz and 3.3 THz, and then false-color imaging was performed by combining the images. Unlike a frequency tunable source, spectroscopic images could be obtained with a simple procedure (calibration free). The ability to distinguish the polymorphism of carbamazepine (CBZ), hydrate forms of D-(+)-glucose and caffeine, and the crystallinity of nifedipine by using the THz DFG source was demonstrated. It was found that different crystal forms (crystallinity, hydrate form and polymorphism) of pharmaceutical materials could be identified. The applicability of DFG sources to spectroscopic imaging for the pharmaceutical and biomedical applications were demonstrated.Author contributions
AN: data curation, formal analysis, investigation, writing – original draft, writing – review and editing. KA: investigation, writing and editing. SH: data curation. HS: writing – review and editing. KF: project administration, writing – review and editing.Conflicts of interest
There are no conflicts to declare.Acknowledgements
The authors would like to thank A. Ito for device fabrication and K. Kuroyanagi for technical assistance. The authors also wish to acknowledge the helpful discussions with T. Edamura. This research and development work was supported by MIC/SCOPE #JP195006001.References
- H. G. Brittain, Profiles Drug Subst., Excipients, Relat. Methodol., 2003, 30, 271–319 CrossRef.
- I. Iermak, A. P. da Silva, C. Kurachi, V. S. Bagnato and N. M. Inada, Pharmaceuticals, 2019, 12, 44 CrossRef CAS PubMed.
- P. Bawuah and J. A. Zeitler, TrAC, Trends Anal. Chem., 2021, 139, 116272 CrossRef CAS.
- D. Markl, P. Bawuah, C. Ridgway, S. van den Ban, D. J. Goodwin, J. Ketolainen, P. Gane, K. E. Peiponen and J. A. Zeitler, Int. J. Pharm., 2018, 537, 102–110 CrossRef CAS PubMed.
- P. Bawuah, D. Markl, D. Farrell, M. Evans, A. Portieri, A. Anderson, D. Goodwin, R. Lucas and J. A. Zeitler, J. Infrared, Millimeter, Terahertz Waves, 2020, 41, 450–469 CrossRef CAS.
- U. Puc, A. Abina, M. Rutar, A. Zidansek, A. Jeglic and G. Valusis, Appl. Opt., 2015, 54, 4495–4502 CrossRef CAS PubMed.
- I. Takeuchi, K. Shimakura, H. Ohtake, J. Takayanagi, K. Tomoda, T. Nakajima, H. Terada and K. Makino, J. Pharm. Sci., 2014, 103, 256–261 CrossRef CAS PubMed.
- C. J. Strachan, P. F. Taday, D. A. Newnham, K. C. Gordon, J. A. Zeitler, M. Pepper and T. Rades, J. Pharm. Sci., 2005, 94, 837–846 CrossRef CAS PubMed.
- U. Puc, A. Abina, A. Jeglic, A. Zidansek, I. Kasalynas, R. Venckevicius and G. Valusis, Sensors, 2018, 18, 4098 CrossRef PubMed.
- I. Takeuchi, M. Otsuki, H. Kuroda and K. Makino, J. Drug Delivery Sci. Technol., 2018, 45, 70–75 CrossRef CAS.
- L. Olivieri, J. S. T. Gongora, L. Peters, V. Cecconi, A. Cutrona, J. Tunesi, R. Tucker, A. Pasquazi and M. Peccianti, Optica, 2020, 7, 186–191 CrossRef CAS.
- M. A. Belkin, F. Capasso, A. Belyanin, D. L. Sivco, A. Y. Cho, D. C. Oakley, C. J. Vineis and G. W. Turner, Nat. Photonics, 2007, 1, 288–292 CrossRef CAS.
- K. Fujita, M. Hitaka, A. Ito, T. Edamura, M. Yamanishi, S. Jung and M. A. Belkin, Appl. Phys. Lett., 2015, 106, 251104 CrossRef.
- M. A. Belkin and F. Capasso, Phys. Scr., 2015, 90, 118002 CrossRef.
- Q. Lu and M. Razeghi, Photonics, 2016, 3, 42 CrossRef.
- K. Fujita, S. Jung, Y. Jiang, J. H. Kim, A. Nakanishi, A. Ito, M. Hitaka, T. Edamura and M. A. Belkin, Nanophotonics, 2018, 7, 1795–1817 Search PubMed.
- K. Fujita, S. Hayashi, A. Ito, M. Hitaka and T. Dougakiuchi, Nanophotonics, 2019, 8, 2235–2241 Search PubMed.
- G. M. Day, J. A. Zeitler, W. Jones, T. Rades and P. F. Taday, J. Phys. Chem. B, 2006, 110, 447–456 CrossRef CAS PubMed.
- K. Fujita, M. Hitaka, A. Ito, M. Yamanishi, T. Dougakiuchi and T. Edamura, Opt. Express, 2016, 24, 16357–16365 CrossRef CAS PubMed.
- C. Yan, B. Yang and Z. Yu, Anal. Methods, 2014, 6, 248–252 RSC.
- T. R. Clare, J. Strachan, D. A. Newnham, K. C. Gordon, M. Pepper and P. F. Taday, Chem. Phys. Lett., 2004, 390, 20–24 CrossRef.
- Y. Ikeda, Y. Ishihara, T. Moriwaki, E. Kato and K. Terada, Chem. Pharm. Bull., 2010, 58, 76–81 CrossRef CAS PubMed.
- H. B. Liu, Y. Chen and X. C. Zhang, J. Pharm. Sci., 2007, 96, 927–934 CrossRef CAS PubMed.
- I. Takeuchi, K. Shimakura, H. Kuroda, T. Nakajima, S. Goto and K. Makino, J. Pharm. Sci., 2015, 104, 4307–4313 CrossRef CAS PubMed.
- L. A. Sterczewski, J. Westberg, Y. Yang, D. Burghoff, J. Reno, Q. Hu and G. Wysocki, Optica, 2019, 6, 766–771 CrossRef CAS.
- K. Vijayraghavan, Y. Jiang, M. Jang, A. Jiang, K. Choutagunta, A. Vizbaras, F. Demmerle, G. Boehm, M. C. Amann and M. A. Belkin, Nat. Commun., 2013, 4, 2021 CrossRef PubMed.
- M. Naftaly and R. Dudley, Opt. Lett., 2009, 34, 1213–1215 CrossRef PubMed.
| This journal is © The Royal Society of Chemistry 2021 |