 Open Access Article
In situ continuous monitoring of dissolved gases (N2, O2, CO2, H2) prior to H2 injection in an aquifer (Catenoy, France) by on-site Raman and infrared spectroscopies: instrumental assessment and geochemical baseline establishment†
E.
Lacroix
 *ab,
Ph.
de Donato
b,
S.
Lafortune
 a,
M.-C.
Caumon
b,
O.
Barres
b,
X.
Liu
b,
M.
Derrien
c and
M.
Piedevache
c
aIneris, Parc Technologique Alata, BP 2 – Verneuil-en-Halatte, 60550, France. E-mail: elodie.lacroix@ineris.fr
bUniversity of Lorraine, CNRS, GeoRessources, F-54000, Nancy, France. E-mail: elodie.lacroix@univ-lorraine.fr
cSolexperts France, Vandœuvre-lès-Nancy, 54500, France
First published on 9th August 2021
Abstract
The establishment of a baseline of gases from an aquifer appears to be an essential prerequisite for monitoring and securing underground storage operations such as the storage of carbon dioxide (carbon capture and storage: CCS), methane or hydrogen. This study describes an innovative metrological technique dedicated to the in situ and continuous quantification of dissolved gases (CO2, O2, N2, CH4 and H2) in a shallow aquifer, on the site of Catenoy (Paris Basin) with a water table at a depth of 13 m. Monitoring was carried out from May 7, 2019 to November 19, 2019, before the simulation of H2 injection. Gases as vapors were collected from the aquifer through a nine-meter long, half-permeable polymer membrane positioned below a packer in a 25-meter deep well. Collected gases were analyzed simultaneously at the surface by fiber Raman (CO2, O2, N2, CH4 and H2) and infrared sensors (CO2). Gas concentrations were determined from Raman and infrared data, and then converted into dissolved concentrations using Henry's law. The dissolved gas concentrations were about constant over the 6 months period with average values of 31–40 mg L−1 (CO2), 8 mg L−1 (O2), 17 mg L−1 (N2), and 0 mg L−1 (H2, CH4) indicating a very low variability in the aquifer. This is believed to allow for rapid detection of any possible abnormal concentration variation, in particular linked to an accidental arrival of gases such as hydrogen. Such an online gas measurement system can be deployed as is on any site type of underground storage without any need for adaptation.
Introduction
Fossil fuels (oil, gas and coal) have been the primary sources of energy for over a century. However, the combustion of these carbon-bearing materials produces greenhouse gases (GHG, e.g. CO2, CH4, N2O), which cause environmental issues when emitted into the atmosphere. Over the past several decades, surging amounts of these GHGs have been emitted, leading to global concerns about the Earth’s environment.1 For instance, GHG emission is considered the first cause of global warming that has many adverse impacts on our society as warned by the Intergovernmental Panel on Climate Change.2 The replacement of fossil fuels with renewable carbon-free energies is considered the most critical solution to achieve balance between the environment, economy and public health.3–5 Among promising renewable energy sources (including solar, hydro, wind power, biomass, and geothermal energy), molecular hydrogen (H2) is the most frequently mentioned. It can be produced from these sources and used as an energy vector.6 Currently, 60 million tons of H2 are produced from fossil resources (“grey H2”) each year in the United States and Europe.7,8 H2 production from fossil resources can be coupled with carbon capture and storage (“blue H2”). However, H2 production from these sources is not carbon neutral. By further developing this energy as part of the energy transition, global needs may increase rapidly in the coming decades with production of H2 in carbon neutrality as by electrolysis of renewable energies (“green H2”).7–10 Currently, the International Energy Agency (IEA) brings together twenty countries to avoid the increase in CO2 emissions (300 Gt estimated up to 2050)6 and thus to study pure and applied research subjects related to the H2 development until 2050.6,10 The part of renewable energy in energy consumption, involving H2, was in 2019 expected to increase by 51% in India, 20.3% in Europe, and 16% in China by 2023.11 The Hydrogen Council was created in 2017 in Davos (Switzerland) to join forces with the IEA in order to encourage the main actors for the development of this sector.12–14 This Council currently estimates that hydrogen will supply 18% of global energy demand.13 In practical operations at the international, European, and local levels, the massive use of H2 is strongly dependent on the capacity to develop H2 safety and sustainable underground storage15–19 unlike conventional storage methods such as compression, liquefaction, physisorption, metallic hydrides or complex hydrides.10,20–22For all types of gas underground storage (deep aquifers, saline caverns, mined caverns and depleted fields),17,23,24 effective monitoring systems should be set up in the surrounding geological media from deep (−1000 m) to surface for timely detection of potential H2 leakage, thus enabling a quick alert and response to adverse, sometimes disastrous, impacts (e.g. for the studies dealing with saline caverns where the permeability of the rocks is very low.15,16,19,23–27 In any storage operations, project integration inside the territory requires securing the site before (measuring the gas emission level of the site before injection which is equal to baseline definition), during and after operations (survey monitoring). These operations are in direct link with geophysical and geochemical monitoring methods adapted to the studied site.28–39 In the last 30 years, numerous studies have been devoted to metrological developments for gas monitoring mainly in the context of underground disposal of nuclear wastes40 and greenhouse gas underground storage including CCS (Carbon Capture and Storage) applications.33,36,41–45 Most of these developments concern the temporal evolution of gas concentrations (mainly CO2 and CH4) in the hydrosphere, soil and atmosphere.46–51 The successive developments have aimed to optimize all measurement systems, to simplify experimental protocols, and to establish gas calibration curves for accurate prediction and simulation of gas dissolution, diffusion and transfer in the surrounding geological medias.52–61
The most commonly adopted analytical setups for the purpose of in situ, long-term and continuous gas monitoring comprise three modules: specific completion, gas circulation tubing and sensor(s) compartment, installed in a dedicated borehole from the shallow surface down to −600 m deep.32,50,53,56,57,60,62 Raman and infrared spectrometers have proven to be suitable sensors: these techniques have been constantly developed from the laboratory measurement scale to the continuous field measurement scale for soil and underground gas monitoring.32,50,60 The two techniques are complementary (at similar cost) as Raman spectroscopy can detect a lot of gases (e.g. N2, O2, CO2, CH4 and H2) but with a low sensitivity while only CH4 and CO2 can be detected by infrared spectroscopy but with higher sensitivity.63 However, if some studies referred to in situ, discontinuous sampling monitoring of dissolved gases in freshwater aquifers such as in Montana, USA and in Oise, France,64–66 very few referred to in situ continuous gas monitoring in this environment. The most recent study refers to the work of Petit et al. (2021)67 which consists of the injection of dissolved CO2 into a carbonate freshwater aquifer at 21 m deep in a pilot site in Gironde, France. The dissolved CO2 concentrations were monitored five days before the injection by a probe immersed in several wells.
The aim of this article is to present a pilot study to test the applicability and robustness of continuous and in situ dissolved gas monitoring by Raman and infrared spectroscopies. The monitoring device was tested under real conditions in a shallow aquifer in the Paris basin (Catenoy, France) over a period of more than 6 months to establish a real gas reference before any type of anthropogenic disturbance such as the injection of H2 to simulate a leak from an underground storage. For this, a completion module comprising a very long semi-permeable membrane allowing the extraction of dissolved gases from the water table was placed in a dedicated borehole. The gases collected were analyzed simultaneously by a fiber Raman sensor (CO2, O2, N2, CH4, H2O and H2) and a Fourier transform infrared spectrometer (FTIR) (CO2). The quantitative determination of dissolved gases is explained as well as the evaluation of the technical capacity between Raman and infrared spectroscopy. Knowing such a dissolved gas baseline is a preamble to follow-up to a future dissolved H2 injection experiment. Moreover, the transposition of this monitoring protocol for other underground storage facilities is also discussed.
Equipment and methods
The injection pilot site (Ineris, Catenoy, France)
The establishment of a geochemical baseline for major gases and H2 was carried out in a shallow aquifer located in the experimental site in Catenoy within the Paris Basin (Hauts-de-France area, Oise), 20 km north of the Ineris applied research center. This site has been instrumented since 2012, and has been used for several similar injection experiments with helium (He) and carbon dioxide (CO2) in the context of former research projects, CIPRES and CO2QUEST.65,66,68The aquifer is unconfined within a chalky reservoir layer of Senonian (Cretaceous) comprising 95% of calcite, and stretches over a total thickness of around 220 m. It is overlain by 6 to 7 m thick Bracheux sands (Tertiary), which are composed of clay sands, fine flint sands, silty sands, sandy silts and silts. The water table of the aquifer is located at an average depth of 13 m, below which water flows in the WSW-ENE direction at around 3 to 10 meters per day66 (Fig. 1). The knowledge of the geochemical baseline is important before any gas injection,66 so the physico-chemical, chemical and hydrological parameters of the aquifer were acquired between October 27, 2018 and November 6, 2019 using mainly in the field two multiparametric probes (“HI 9828” of Hanna instruments and “Quanta” of Hydrolab Corporation).69 Major hydrological and chemical parameters are summarized below (Fig. 1). The aquifer groundwater is always close to neutrality (pH of 7.3 ± 0.3), oxygenated (dissolved O2 concentration of 5.4 ± 1.7 mg L−1), and oxidizing (positive oxidation–reduction potential (ORP): 103 ± 89 mV). The aquifer is moderately mineralized (electrical conductivity (σ) of 562 ± 66 μS cm−1), with an average temperature (T) of 12 ± 1 °C and a salinity (S) of 0.29 ± 0.02 PSU. This water exhibits a dominant bicarbonate–calcium facies (HCO3− concentration of 299 ± 10 mg L−1) with a slight alteration of sulfate and nitrate ions (SO42− and NO3− concentration of 28 ± 3 and 33 ± 3 mg L−1 respectively). Ammonium ions are also present in water but at very low concentrations (0.10 ± 0.13 mg L−1).69 The concentration of metallic trace elements (Fe and Mn) is around 0.99 mg L−1 (Fe) and 0.11 mg L−1 (Mn).69
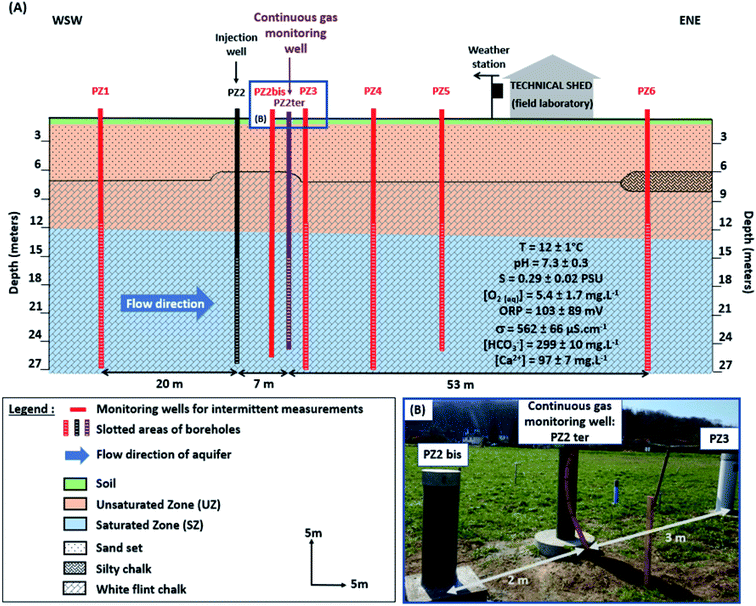 | ||
Fig. 1 (A) Schematic vertical section of the Catenoy experimental injection site (geological formations, equipment, injection and monitoring wells) (according to Gombert et al. 2014; Lafortune et al. 2020![[thin space (1/6-em)]](https://www.rsc.org/images/entities/char_2009.gif) 66,69). For better visibility, the dimensions of the monitoring wells, the weather station and the technical shed are not to scale, and the UZ monitoring wells (boreholes only reaching the UZ) are not represented here. They will be described in a future study. (B) Photograph of the location of the continuous gas monitoring well (PZ2 ter) in relation to two other monitoring wells for discontinuous measurements. 66,69). For better visibility, the dimensions of the monitoring wells, the weather station and the technical shed are not to scale, and the UZ monitoring wells (boreholes only reaching the UZ) are not represented here. They will be described in a future study. (B) Photograph of the location of the continuous gas monitoring well (PZ2 ter) in relation to two other monitoring wells for discontinuous measurements. | ||
The experimental site is equipped with one injection well (PZ2 in Fig. 1A) and seven monitoring wells (PZ1, PZ2 bis, PZ2 ter, PZ3, PZ4, PZ5 and PZ6 in Fig. 1A). All these wells are arranged linearly and parallel to the flow direction over 80 m and reach the saturated zone (SZ) until 27 m deep. The upper limit of the strainers varies from 11 to 15 m in depth depending on the piezometers66,70 (Fig. 1). The monitoring wells represented in red in Fig. 1A are designed for intermittent sampling of physico-chemical and gas measurements.66,69,71 In contrast, PZ2 ter (represented in purple in Fig. 1A and B), which is located 7 m downstream from the injection well (PZ2), is designed for in situ and continuous gas measurements. Moreover, the depth in each well was checked manually again in 2019 in order to verify the good operation (absence of mud plugs inside) of the piezometers several years since their last use using a depth probe.
Continuous gas measurements by Raman and infrared spectroscopies in a PZ2 ter well
A new 220 mm diameter borehole (PZ2 ter) was rotary drilled to a depth of 25 m. This piezometer was then equipped with a plastic filter between 15 and 24 m deep with a diameter of 80 mm (int.) to 90 mm (ext.). The annulus was filled up with quartz sand, intercalated with two layers of clay balls. The top of the borehole was sealed with cement and bentonite (Appendix 1 in the ESI section†). After the drilling operations, the piezometer was cleaned up by airlift, before installing the completion system.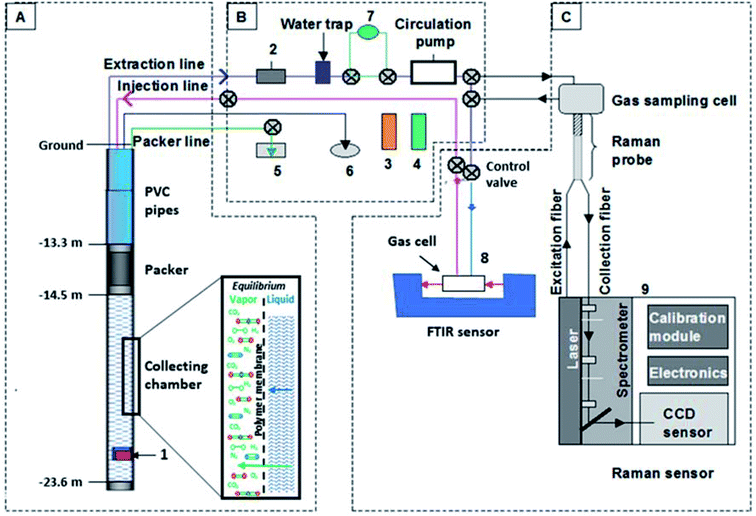 | ||
| Fig. 2 Experimental device used in the Catenoy site for in situ and continuous gas measurements by FTIR and Raman spectroscopies (according to Taquet et al., 2013; Derrien and Navelot, 201932,70). (A) Completion module set up in the PZ2 ter well with a drawing of gas and liquid phase reactions at equilibrium through the membrane (1: temperature sensor); (B) gas circulation module (2: pressure sensor, 3: atmospheric pressure sensor, 4: atmospheric temperature sensor, 5: packer pressure sensor, 6: borehole temperature indicator and 7: fluxmeter); (C) optical sensor module (8: simple compartment FTIR spectrometer BRUKER ALPHA and 9: Kaiser Optical System RXn1 Raman spectrometer). | ||
Inside this completion system, steel lines cross the entire length of the well (Appendix 2 in the ESI†) allowing gas to circulate in the second module (see the next section).
Measurement protocol and data processing
All Raman spectral data are acquired and recorded by iCRaman software. This software automatically performs data processing by Fourier transform and apodization with a resampling interval of 1 cm−1. The signals of CO2, CH4, H2, O2, and N2 were collected from May 7, 2019 to November 19, 2019, gathering a total of 7966 spectra. In order to optimize the signal, the accumulation number (which corresponds to the number of spectra recorded and then averaged to provide a unique spectrum) and the acquisition duration were optimized during the first weeks of measurement. From May 7 to 23, the measurements were acquired in 4 accumulations of 1 minute, then from May 23 to May 29, they were recorded in 8 accumulations of 1 minute and from May 29 to November 19 in 16 accumulations of 30 seconds. The acquisitions were performed every 30 minutes (sampling frequency) over the full period (from May 7 to November 19, 2019). This whole period was divided into nine sub-periods because of logistical interruptions during measurements (shutdown/restart due to power cut, fuse change, resumption and modification of the acquisition parameters).
The infrared spectra were recorded, via OPUS software, from May 7 to November 19, 2019 gathering a total of 3270 spectra. The spectra were acquired every hour from May 7 to October 24, 2019 and then every 30 minutes from October 24 to November 19, 2019. An OPUS macro-command was established to automatically calculate the areas of the bands associated with gas molecules. The whole baseline period was divided into seven sub-periods because of logistical interruptions during measurements (shutdown/restart due to power cut and electronic bugs).
It is possible to determine the molar proportion of each gas in a mixture from the peak area and from the Raman relative scattering cross section (RRSCS).73–76 This last parameter depends on the excitation light wavelength used in the Raman spectrometer and on the wavenumber of each molecule vibration mode.73,77–80 In this study, the laser is at 532 nm. However, there are no references of the RRSCS of the studied gases at this wavelength. Thus, those approaching this wavelength (514.5 nm) are used to calculate gas concentrations from their respective Raman spectral lines (Table 1) considering that the wavelength correction is negligible between 514.5 nm and 532 nm.80 As the peak areas of CH4 molecules are zero or very negligible over the whole period, they are excluded from the calculation of the gas molar proportion. As explained before, water vapor was also neglected, probably affecting the results by a few percent.
Mathematical development for the calculation of the peak area and the quantitative calculation of the gas concentration is detailed in Appendix 3 in the ESI.†
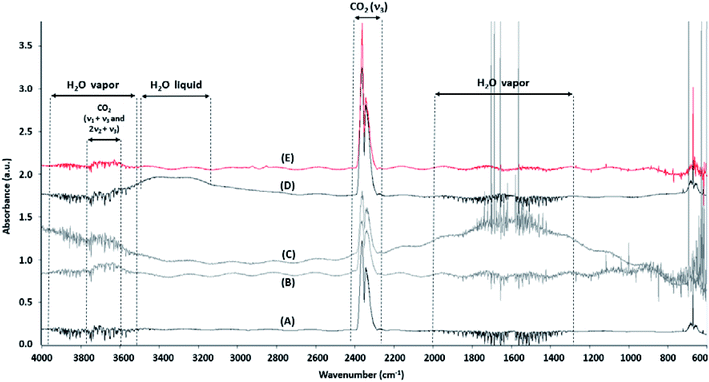
The CH4 band expected around 3015 cm−1 is not detected in the infrared spectra. The fundamental vibration band (ν3) of the CO2 molecule (doublet between 2400 and 2220 cm−1) is identified into the literature (ref. 81 and references therein). The band area calculation of CO2 by OPUS software is determined as a function of a wavenumber interval after baseline subtraction. Thus, the selected signal of CO2 is integrated between 2400 and 2220 cm−1. The ν3 band is characterized by the presence of a doublet whose intensity of the second peak is always lower by a ratio of ¾ compared to that of the first peak. Some spectra respect this characteristic (A to D in Fig. 4) despite interference due to the presence of vapor water (A, B, C in Fig. 4) or liquid water (D in Fig. 4). However, some spectra do not respect the ¾ ratio (E in Fig. 4). These spectra are therefore removed from the dataset. Thereby, 2335 infrared spectra are kept for the period from May 7 to November 19, 2019 (71.4% of the initial dataset).
Furthermore, the band area data are also processed using “Chauvenet's criteria” (eqn (2) and (3) in Appendix 3 in the ESI†), while checking beforehand the data distribution follows a normal law. After the processing with Chauvenet's criteria (from 1 to 3 runs) of each time sub-period within the baseline period, 2325 spectra are selected (71.1% of the initial dataset).
It is also possible to quantify the CO2 absolute concentration from a previous mathematical calibration (polynomial type) of the band area data55 extended by Adisaputro et al. (2021)82 for CO2 measurements acquired with a resolution of 1 cm−1. It provides an absolute concentration of CO2 in ppmv.
In order to determine the dissolved CO2 concentration, the hypothesis of the equilibrium between the gas phase and the dissolved phase of the considered species is also put forward. Thus, a formula similar to eqn (4) in Appendix 3 in the ESI† is used. Then, a comparison between the Raman data and the infrared data is established to assess the quality of the measurements by integrating the optical parameters detailed in the following sections.
Results and discussion
In the following figures (Fig. 5–8), the start of each numbered sub-period corresponds to logistical interruptions during measurements (shutdown/restart due to power cut, fuse change, resumption and modification of the acquisition parameters, gas cell cleaning) that can change a little the spectrometer response and induce some discontinuity in calculated concentrations especially for Raman. During the Raman sub-period #5 (from July 26 to August 22, 2019), the temperature in the technical shed increased sharply. Thus, the infrared device switched automatically to temperature safety mode while the Raman device continued to record measurements. It is possible that the Raman measurement bias during this period is linked to the heatwave: more than 35 °C in the shade for several days.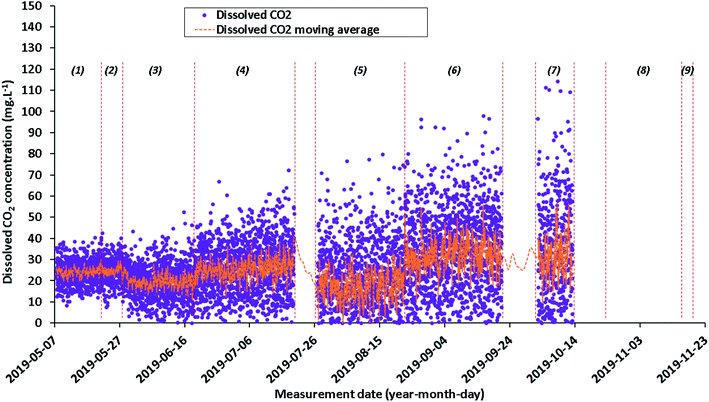 | ||
| Fig. 6 Quantitative evolution of dissolved CO2 concentrations (data values in purple and moving average in orange) from May 7, 2019 to November 19, 2019, calculated from Raman data. | ||
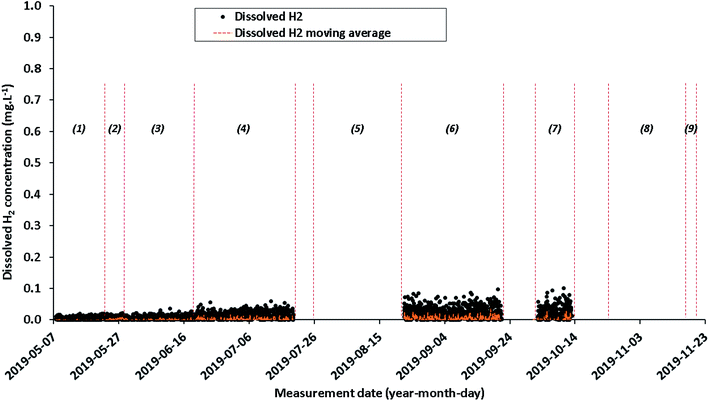 | ||
| Fig. 7 Quantitative evolution of dissolved H2 concentration (data values in black and moving average in orange) from May 7, 2019 to November 19, 2019 calculated from Raman data. | ||
 | ||
| Fig. 8 Quantitative evolution of dissolved CO2 concentration (data values in purple and moving average in orange) from May 7, 2019 to November 19, 2019, calculated from infrared data. | ||
Raman results
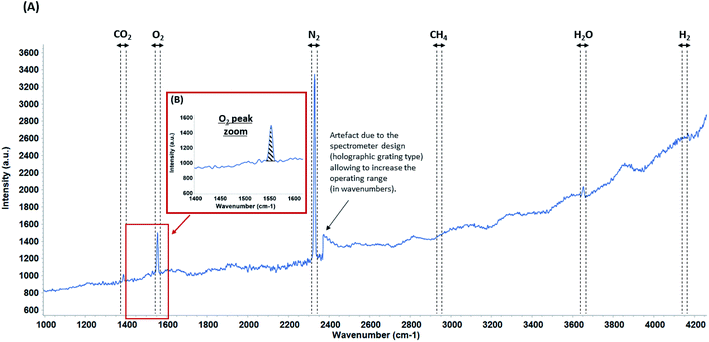
The peak area evolution of N2, O2, CO2 and H2 is studied from 7633 Raman spectra (example of a spectrum in Fig. 3). In order to interpret the future variations in dissolved H2 concentrations during the injection of this gas into the aquifer, H2 concentrations are also monitored in the geochemical baseline period.The dissolved gas concentrations are obtained with a water temperature of 12 °C and an average pressure in the membrane of 1.45 bar (relatively constant pressure during the baseline period) which conforms to the pressure of the gas system.
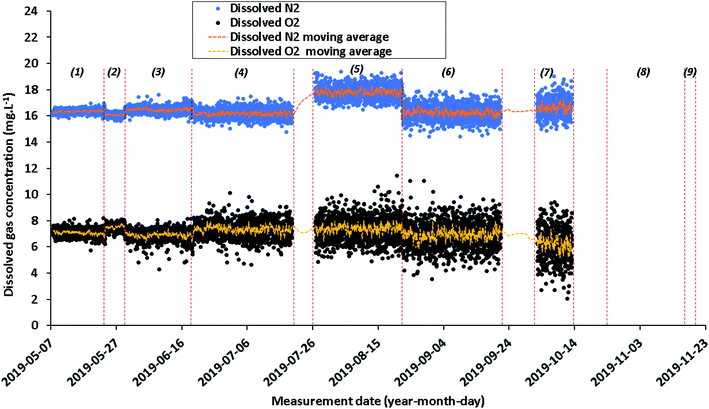
Since the signal for each gas is noised by several transient fluctuations throughout the duration of baseline monitoring, a concentration representation by a moving average is needed to attenuate signal fluctuations (Fig. 5–7). This parameter may be relevant for the future dissolved H2 injection due to the high cross section of H2: a variation in signal intensity at time intervals with a magnitude of tens of minutes is expected there. Moving averages on various sets of data (from 5 to 25 data) are therefore tested. A moving average on a set of 10 individual data allows the general trend to be shown, which best represents individual data while attenuating signal fluctuations. Since the individual data are acquired every 30 minutes, each Raman moving average corresponds to a period of 300 minutes (i.e. 5 hours). Even if the measurements were carried out continuously, the Raman signal cannot be accumulated in situ over 5 hours because of CCD detector saturation, background changes over time that do not average correctly or signal distortion owing to high background. The dissolved N2, O2 CO2 and H2 concentrations are plotted as daily individual data to better monitor how the situation evolves and as a moving average to show clearly the trend (Fig. 5–7).
Although the Raman measurements were carried out from May 7, 2019 to November 19, 2019, a drift of the system is observed mainly due to a gradual decrease in laser power. This drift induces erroneous concentration values which prevent any physical interpretation. For this reason and in order not to confuse the interpretation, the data for periods #8 (October 24, 2019 to November 18, 2019) and #9 (November 18 to November 19, 2019) are not presented.
The concentrations of dissolved N2 and O2 are generally stable around an average of 16.5 ± 0.4 mg L−1 (±1σ) for N2 and 7.1 ± 0.7 mg L−1 (±1σ) for O2 with a data dispersion which widens from month to month. Small variations of dissolved N2 concentrations were noted between the first seven time periods with average concentrations from 16.1 ± 0.1 to 17.8 ± 0.5 mg L−1 for N2 and the O2 concentrations were varied from 6.2 ± 1.3 to 7.5 ± 0.3 mg L−1 (Fig. 5 and Table 2). As explained before, this fluctuation is mainly due to the decrease of the laser power. Under these conditions, it is hard to make a link with a fluctuation in the geochemical characteristics of the aquifer.
| Period in 2019 | Spectra number | Dissolved gases | |||
|---|---|---|---|---|---|
| N2 (mg L−1) | O2 (mg L−1) | ||||
| Average | Standard deviation (±1σ) | Average | Standard deviation (±1σ) | ||
| May 7–23 | 735 | 16.3 | 0.2 | 7.1 | 0.3 |
| May 23–29 | 271 | 16.1 | 0.1 | 7.5 | 0.3 |
| May 29–June 19 | 968 | 16.5 | 0.2 | 6.9 | 0.4 |
| June 19–July 19 | 1391 | 16.2 | 0.4 | 7.4 | 0.6 |
| July 26–August 22 | 1223 | 17.8 | 0.5 | 7.4 | 0.9 |
| August 22–September 21 | 1382 | 16.2 | 0.6 | 6.9 | 1.0 |
| October 2–13 | 477 | 16.6 | 0.7 | 6.2 | 1.3 |
| October 24–November 18 | 1167 | — | — | — | — |
| November 18–19 | 19 | — | — | — | — |
The evolution of the dissolved CO2 concentration also varied over the nine time periods. During each period, the average concentration stabilizes around a different average value from that of the previous period: from 17.5 to 32.2 mg L−1. Moreover, the increase of the initial dispersion of concentrations over each of these 8 periods is due to a strong decrease of the laser power.
As shown in Fig. 7, the concentrations of dissolved H2 are close to zero, at the level of the limit of detection (LOD) of the fiber Raman sensor during the entire baseline period. Note that during period #5, from July 26, 2019 to August 22, 2019, the dissolved H2 values are not shown in Fig. 7.
Infrared results
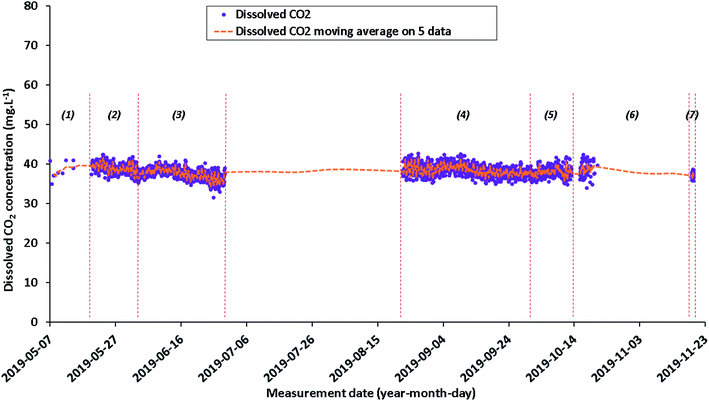
As with Raman data, infrared data are also represented in individual data and in moving averages (on five data) (Fig. 8). Since the individual data are acquired every 60 minutes, each infrared moving average data point corresponds to a period of 300 minutes (i.e. 5 hours).During the entire baseline period, dissolved CO2 concentrations are generally relatively stable with an average of 38.2 ± 1.4 mg L−1. However, seven time periods can be defined. The dispersion of the infrared data is relatively low over time: from 0.7 to 2.0 mg L−1 (±1σ) (Fig. 8 and Table 4). The lack of data between the end of June and the end of August (Fig. 8) is due to computer or spectrometer overheating because of higher summer temperatures. During the period from end-October to mid-November 2019, the cell was often filled in with liquid water, which resulted in incorrect measurements: these data are not shown in Fig. 8.
Instrumental assessment between Raman and infrared data
| Period in 2019 | Spectra number | Dissolved gas | |
|---|---|---|---|
| CO2 (mg L−1) | |||
| Average | Standard deviation (±1σ) | ||
| May 7–23 | 735 | 24.2 | 5.8 |
| May 23–29 | 271 | 24.6 | 5.5 |
| May 29–June 19 | 968 | 19.2 | 8.1 |
| June 19–July 19 | 1391 | 25.7 | 12.8 |
| July 26–August 22 | 1223 | 17.5 | 19.1 |
| August 22–September 21 | 1382 | 32.2 | 21.0 |
| October 2–13 | 477 | 31.2 | 27.5 |
| October 24–November 18 | 1167 | — | — |
| November 18–19 | 19 | — | — |
| Period in 2019 | Spectra number | Dissolved gas | |
|---|---|---|---|
| CO2 (mg L−1) | |||
| Average | Standard deviation (±1σ) | ||
| May 7–19 | 10 | 38.4 | 2.0 |
| May 19–June 2 | 330 | 39.1 | 1.3 |
| June 2–29 | 638 | 37.5 | 1.4 |
| August 22–October 2 | 981 | 38.4 | 1.4 |
| October 2–13 | 246 | 38.1 | 1.2 |
| October 15–22 | 65 | 38.7 | 1.9 |
| November 18–19 | 55 | 37.2 | 0.7 |
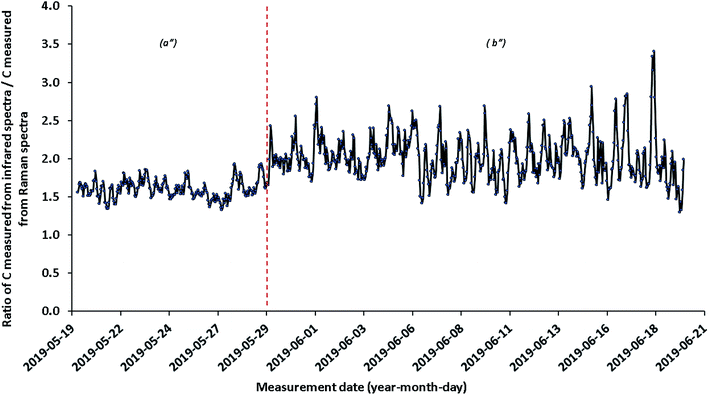
One can conclude that the evolution over time of the optical characteristics of the Raman sensor is more important than for the infrared sensors. This leads to variations in the determination of the dissolved CO2 concentration. Indeed, the dissolved CO2 concentrations determined by Raman spectroscopy fluctuate between 17.5 and 32.2 mg L−1 (Table 3) and those determined by infrared spectroscopy are around 37.2–38.4 mg L−1 (Table 4). However, a ratio between the moving average concentrations of dissolved CO2 measured from infrared and those measured from Raman was determined over the period from May 19 to June 19, 2019 (Fig. 9). This period is the one that presents the best quality of measurements over the entire period of the geochemical baseline. An average ratio of 1.6 was observed from May 19 to 29 (subperiod a′′). This average ratio drops to 1.9 from May 29 to June 19, 2019 (sub-period b′′) (Fig. 9). This confirms the progressive decrease about the optical characteristic of the fiber Raman sensor (see Appendix 4†). Due to the greater stability and sensitivity of the infrared sensor, the infrared data for dissolved CO2 can be used both for monitoring the deviation of the fiber Raman sensor and for the calibration of quantitative Raman measurements.
All these observations strongly argue in favor of a regular maintenance of the Raman spectrometer (spectrometer wavelength calibration, cleaning and purging the measuring cells, checking laser power) that is necessary every two months to obtain gas measurement of better quality with an almost zero derivative factor and better SNR values (see Appendix 4†). In order to ensure the relevance of the data measured by two different techniques, it is necessary to carry out a comparison for other gaseous species such as by regularly taking water samples on the same site (e.g. dissolved O2 concentrations69).
Moreover, using a mathematical simulation (PhreeqC software83) with the physico-chemical and ionic parameters of the Catenoy waters analyzed during the same period of the geochemical baseline,69 an average dissolved CO2 concentration of 28 mg L−1 is obtained. Moreover, discontinuous sampling in the aquifer under the same conditions in PZ1 and PZ3 exhibits a concentration of CO2(aq) between 23.8 and 26.6 mg L−1. All these data are relevant to Raman and infrared in situ measurements in the dedicated well “PZ2 ter”.
Conclusion
Monitoring of dissolved gases was carried out under real conditions in a shallow water table in the Paris basin (Catenoy, France) over a period of more than 6 months. The measurement device involves 3 modules, a completion module placed in a dedicated well and equipped with a semi-permeable membrane with rapid gas transfer kinetics, a gas circulation module connected to a measurement module equipped with a fiber Raman sensor and an infrared sensor with a low optical path. It leads to the following main conclusions:• The variability of dissolved gases can be continuously monitored in a saturated system such as an aquifer.
• The combination of Raman and infrared sensors makes it possible to quantify the concentrations of N2, O2, CO2, H2 and CH4 and to monitor their variability over more than one seasonal cycle.
• The Raman and infrared measuring cell must be placed in a temperature-controlled place. Under this condition, the signal-to-noise ratio remains stable for the infrared sensor during the period studied, requiring only an annual maintenance operation. For the fiber Raman sensor, the signal-to-noise ratio depends on the evolution of the laser power, which must be checked quarterly.
• Monitoring over a period of more than 6 months shows a very low variability of the dissolved gas concentrations in the aquifer, which will allow rapid detection of any possible drift, particularly linked to an accidental arrival of gases such as hydrogen.
Moreover, such online gas measurement systems can be deployed as it is on any type of site without the need for adaptation. For a new site and in order to validate the experiment protocol, it will be necessary to carry out a comparison by regularly analyzing water samples by conventional chemical methods. In order to improve the industrialization of these monitoring techniques in the context of underground gas storage, additional promising technologies are actually in development such as fiber optic network platforms84,85 and/or sensors of the AlGaN/GaN doped semiconductor type HEMT (High Electron Mobility Transistors).86
Conflicts of interest
There are no conflicts to declare.Acknowledgements
The results presented in this paper were acquired as part of the ROSTOCK-H research project funded by the GEODENERGIES Scientific Interest Group. This work is a part of the PhD thesis of Elodie Lacroix (Ineris/University of Lorraine). The authors also wish to express their gratitude to Ineris, thanks to the on-site experiments took place, the University of Lorraine and its subcontractor, the Solexperts company for the technical and scientific development of analytical tools.References
- S. Choi, J. H. Drese and C. W. Jones, Adsorbent Materials for Carbon Dioxide Capture from Large Anthropogenic Point Sources, ChemSusChem, 2009, 2(9), 796–854, DOI:10.1002/cssc.200900036.
- IPCC, Global warming of 1.5°C, An IPCC Special Report on the impacts of global warming of 1.5°C above pre-industrial levels and related global greenhouse gas emission pathways, in The Context of Strengthening the Global Response to the Threat of Climate Change, Sustainable Development, and Efforts to Eradicate Poverty, ed. V. Masson-Delmotte, P. Zhai, H.-O. Pörtner, D. Roberts, J. Skea, P. R. Shukla, A. Pirani, W. Moufouma-Okia, C. Péan, R. Pidcock, S. Connors, J. B. R. Matthews, Y. Chen, X. Zhou, M. I. Gomis, E. Lonnoy, T. Maycock, M. Tignor and T. Waterfield, 2018, p. 630, disponible sur: https://www.ipcc.ch/site/assets/uploads/sites/2/2019/06/SR15_Full_Report_High_Res.pdf Search PubMed.
- R. Bader and W. Lipiński, Solar thermal processing, in Advances in Concentrating Solar Thermal Research and Technology, Elsevier, 2017, pp. 403–459, cité 24 avr 2020, disponible sur: https://linkinghub.elsevier.com/retrieve/pii/B9780081005163000186 Search PubMed.
- J. R. Kotzebue and M. Weissenbacher, The EU’s Clean Energy strategy for islands: A policy perspective on Malta’s spatial governance in energy transition, Energy Policy, 2020, 139, 111361, DOI:10.1016/j.enpol.2020.111361.
- A. Millot, A. Krook-Riekkola and N. Maïzi, Guiding the future energy transition to net-zero emissions: Lessons from exploring the differences between France and Sweden, Energy Policy, 2020, 139, 111358, DOI:10.1016/j.enpol.2020.111358.
- Z. Abdin, A. Zafaranloo, A. Rafiee, W. Mérida, W. Lipiński and K. R. Khalilpour, Hydrogen as an energy vector, Renewable Sustainable Energy Rev., 2020, 120, 109620, DOI:10.1016/j.rser.2019.109620.
- AFHYPAC, Production et consommation d’hydrogène aujourd’hui, 2016, disponible sur: http://www.afhypac.org/documents/tout-savoir/Fiche%201.3%20-%20Production%20et%20consommation%20d%27hydrog%C3%A8ne%20rev.%20fev2016%20PM.pdf Search PubMed.
- Ministère de la transition écologique et solidaire, Plan de déploiement de l’hydrogène pour la transition énergétique, Paris, 2018, disponible sur: https://www.ecologique-solidaire.gouv.fr/sites/default/files/2018.06.01_dp_plan_deploiement_hydrogene_0.pdf Search PubMed.
- K. O’Malley, G. Ordaz, J. Adams, K. Randolph, C. C. Ahn and N. T. Stetson, Applied hydrogen storage research and development: A perspective from the U.S. Department of Energy, J. Alloys Compd., 2015, 645, S419–S422, DOI:10.1016/j.jallcom.2014.12.090.
- Congrès OSE, L’hydrogène, vecteur énergétique du futur?, Presses des MINES. École nationale supérieure des mines (Paris), Paris, 2019. pp. 1–117 Search PubMed.
- REN21, Renewables 2019 Global Status Report, REN21, Paris, 2019, disponible sur: https://www.ren21.net/wp-content/uploads/2019/05/gsr_2019_full_report_en.pdf Search PubMed.
- IEA, Sustainable Recovery, IEA, Paris, 2020, p. 174, cité 30 janv 2021, World Energy Outlook Special Report, disponible sur: https://www.iea.org/reports/sustainable-recovery Search PubMed.
- Hydrogen Council, Position Paper: Invest in Hydrogen for Robust, Resilient and Sustainable Growth as a Response to the COVID-19 Pandemic, Hydrogen Council, 2020, cité 29 janv 2021, disponible sur: https://hydrogencouncil.com/en/invest-in-hydrogen-for-a-robust-resilient-and-sustainable-growth-as-a-response-to-the-covid-19-pandemic/ Search PubMed.
- Hydrogen Council, Path to Hydrogen Competitiveness: A Cost Perspective, Hydrogen Council, 2020, p. 88, cité 30 janv 2021. Disponible sur: https://hydrogencouncil.com/wp-content/uploads/2020/01/Path-to-Hydrogen-Competitiveness_Full-Study-1.pdf Search PubMed.
- A. Ozarslan, Large-scale hydrogen energy storage in salt caverns, Int. J. Hydrogen Energy, 2012, 37(19), 14265–14277, DOI:10.1016/j.ijhydene.2012.07.111.
- M. Bai, K. Song, Y. Sun, M. He, Y. Li and J. Sun, An overview of hydrogen underground storage technology and prospects in China, J. Pet. Sci. Eng., 2014, 124, 132–136, DOI:10.1016/j.petrol.2014.09.037.
- Ineris, Le stockage souterrain dans le contexte de la transition énergétique, Verneuil-en-Halatte, 2016, disponible sur: https://www.ineris.fr/sites/ineris.fr/files/contribution/Documents/ineris-dossier-ref-stockage-souterrain.pdf Search PubMed.
- A. Le Duigou, A.-G. Bader, J.-C. Lanoix and L. Nadau, Relevance and costs of large scale underground hydrogen storage in France, Int. J. Hydrogen Energy, 2017, 42(36), 22987–23003, DOI:10.1016/j.ijhydene.2017.06.239.
- D. G. Caglayan, N. Weber, H. U. Heinrichs, J. Linßen, M. Robinius, P. A. Kukla and D. Stolten, Technical potential of salt caverns for hydrogen storage in Europe, Int. J. Hydrogen Energy, 2020, 45(11), 6793–6805, DOI:10.1016/j.ijhydene.2019.12.161.
- L. Zhou, Progress and problems in hydrogen storage methods, Renewable Sustainable Energy Rev., 2005, 9(4), 395–408, DOI:10.1016/j.rser.2004.05.005.
- H. Barthelemy, M. Weber and F. Barbier, Hydrogen storage: Recent improvements and industrial perspectives, Int. J. Hydrogen Energy, 2017, 42(11), 7254–7262, DOI:10.1016/j.ijhydene.2016.03.178.
- R. Moradi and K. M. Groth, Hydrogen storage and delivery: Review of the state of the art technologies and risk and reliability analysis, Int. J. Hydrogen Energy, 2019, 44(23), 12254–12269, DOI:10.1016/j.ijhydene.2019.03.041.
- R. Tarkowski, Perspectives of using the geological subsurface for hydrogen storage in Poland, Int. J. Hydrogen Energy, 2017, 42(1), 347–355, DOI:10.1016/j.ijhydene.2016.10.136.
- R. Tarkowski, Underground hydrogen storage: Characteristics and prospects, Renewable Sustainable Energy Rev., 2019, 105, 86–94, DOI:10.1016/j.rser.2019.01.051.
- A. S. Lord, P. H. Kobos and D. J. Borns, Geologic storage of hydrogen: Scaling up to meet city transportation demands, Int. J. Hydrogen Energy, 2014, 39(28), 15570–15582, DOI:10.1016/j.ijhydene.2014.07.121.
- S. Flesch, D. Pudlo, D. Albrecht, A. Jacob and F. Enzmann, Hydrogen underground storage—Petrographic and petrophysical variations in reservoir sandstones from laboratory experiments under simulated reservoir conditions, Int. J. Hydrogen Energy, 2018, 43(45), 20822–20835, DOI:10.1016/j.ijhydene.2018.09.112.
- R. Tarkowski and G. Czapowski, Salt domes in Poland – Potential sites for hydrogen storage in caverns, Int. J. Hydrogen Energy, 2018, 43(46), 21414–21427, DOI:10.1016/j.ijhydene.2018.09.212.
- A. Chadwick, R. Arts, O. Eiken, P. Williamson and G. Williams, Geophysical Monitoring Of The Co2 Plume At Sleipner, North Sea, in Advances in the Geological Storage of Carbon Dioxide, ed. S. Lombardi, L. K. Altunina and S. E. Beaubien, Springer Netherlands, Dordrecht, 2006, pp. 303–314, cité 18 avr 2020, disponible sur: http://link.springer.com/10.1007/1-4020-4471-2_25 Search PubMed.
- R. A. Chadwick, R. Arts, M. Bentham, O. Eiken, S. Holloway and G. A. Kirby, et al., Review of Monitoring Issues and Technologies Associated with the Long-Term Underground Storage of Carbon Dioxide, Geological Society, London, Special Publications, 2009, vol. 313(1), pp. 257–275 Search PubMed.
- T. Laier and H. Øbro, Environmental and Safety Monitoring of the Natural Gas Underground Storage at Stenlille, Denmark, Geological Society, London, Special Publications, 2009, 313(1), 81–92, DOI:10.1144/SP313.6.
- S. Lafortune, Z. Pokryszka, G. Bentivegna and R. Farret, From Geochemical Baseline Studies to Characterization and Remediation of Gas Leaks: Experiences and Case Studies of the French Institute for Risk Management (INERIS), Energy Procedia, 2013, 37, 4391–4399, DOI:10.1016/j.egypro.2013.06.344.
- N. Taquet, J. Pironon, P. De Donato, H. Lucas and O. Barres, Efficiency of combined FTIR and Raman spectrometry for online quantification of soil gases: Application to the monitoring of carbon dioxide storage sites, Int. J. Greenhouse Gas Control, 2013, 12, 359–371, DOI:10.1016/j.ijggc.2012.10.003.
- D. Y. C. Leung, G. Caramanna and M. M. Maroto-Valer, An overview of current status of carbon dioxide capture and storage technologies, Renewable Sustainable Energy Rev., 2014, 39, 426–443, DOI:10.1016/j.rser.2014.07.093.
- J. M. Matter, M. Stute, J. Hall, K. Mesfin, S. Ó. Snæbjörnsdóttir and S. R. Gislason, et al., Monitoring permanent CO2 storage by in situ mineral carbonation using a reactive tracer technique, Energy Procedia, 2014, 63, 4180–4185, DOI:10.1016/j.egypro.2014.11.450.
- U. Schacht and C. Jenkins, Soil gas monitoring of the Otway Project demonstration site in SE Victoria, Australia, Int. J. Greenhouse Gas Control, 2014, 24, 14–29, DOI:10.1016/j.ijggc.2014.02.007.
- J. A. Sorensen, L. S. Botnen, S. A. Smith, C. D. Gorecki, E. N. Steadman and J. A. Harju, Application of Canadian Standards Association guidelines for geologic storage of CO2 toward the development of a monitoring, verification, and accounting plan for a potential CCS project at Fort Nelson, British Columbia, Canada, Energy Procedia, 2014, 63, 5959–5970, DOI:10.1016/j.egypro.2014.11.631.
- B. Garcia, K. Rhino, C. Loisy, O. Le Roux, A. Cerepi and V. Rouchon, et al., CO2-Vadose and DEMO-CO2 Projects: Two Complementary Projects about Geochemical and Geophysical Monitoring During CO2 Leakage, Energy Procedia, 2017, 114, 3695–3698, DOI:10.1016/j.egypro.2017.03.1500.
- C. Kervévan, M.-H. Beddelem, X. Galiègue, Y. Le Gallo, F. May and K. O’Neil, et al., Main Results of the CO2-DISSOLVED Project: First Step toward a Future Industrial Pilot Combining Geological Storage of Dissolved CO2 and Geothermal Heat Recovery, Energy Procedia, 2017, 114, 4086–4098, DOI:10.1016/j.egypro.2017.03.1549.
- C. Jenkins, The State of the Art in Monitoring and Verification: an update five years on, Int. J. Greenhouse Gas Control, 2020, 100, 103118, DOI:10.1016/j.ijggc.2020.103118.
- P. Bossart, F. Bernier, J. Birkholzer, C. Bruggeman, P. Connolly and S. Dewonck, et al., Mont Terri rock laboratory, 20 years of research: introduction, site characteristics and overview of experiments, Swiss J. Geosci., 2017, 110(1), 3–22, DOI:10.1007/s00015-016-0236-1.
- S. Lombardi, A. Annunziatellis, S. E. Beaubien and G. Ciotoli. Near-Surface Gas Geochemistry Techniques To Assess And Monitor Co2 Geological Sequestration Sites, in Advances in the Geological Storage of Carbon Dioxide, ed. S. Lombardi, L. K. Altunina and S. E. Beaubien, Kluwer Academic Publishers, Dordrecht, 2006, pp. 141–156, cité 20 avr 2020, Disponible sur: http://link.springer.com/10.1007/1-4020-4471-2_13 Search PubMed.
- Total, Carbon Capture and Storage: the Lacq Pilot (Project and Injection Period 2006-2013), Total, France, 2015, p. 276, disponible sur: https://www.globalccsinstitute.com/archive/hub/publications/194253/carbon-capture-storage-lacq-pilot.pdf Search PubMed.
- Y. Sawada, J. Tanaka, C. Suzuki, D. Tanase and Y. Tanaka, Tomakomai CCS Demonstration Project of Japan, CO2 Injection in Progress, Energy Procedia, 2018, 154, 3–8, DOI:10.1016/j.egypro.2018.11.002.
- J. Kim, S. Yu, S.-T. Yun, K.-H. Kim, J.-H. Kim and Y.-J. Shinn, et al., CO2 leakage detection in the near-surface above natural CO2-rich water aquifer using soil gas monitoring, Int. J. Greenhouse Gas Control, 2019, 88, 261–271, DOI:10.1016/j.ijggc.2019.06.015.
- A. Raza, R. Gholami, R. Rezaee, V. Rasouli and M. Rabiei, Significant aspects of carbon capture and storage – A review, Petroleum, 2019, 5(4), 335–340, DOI:10.1016/j.petlm.2018.12.007.
- J. B. Riding and C. A. Rochelle, Subsurface characterization and geological monitoring of the CO2 injection operation at Weyburn, Saskatchewan, Canada, Geological Society, London, Special Publications, 2009, 313, 227–256, DOI:10.1144/SP313.14.
- S. Schloemer, M. Furche, I. Dumke, J. Poggenburg, A. Bahr and C. Seeger, et al., A review of continuous soil gas monitoring related to CCS – Technical advances and lessons learned, Appl. Geochem., 2013, 30, 148–160, DOI:10.1016/j.apgeochem.2012.08.002.
- K. Shitashima, Y. Maeda and T. Ohsumi, Development of detection and monitoring techniques of CO2 leakage from seafloor in sub-seabed CO2 storage, Appl. Geochem., 2013, 30, 114–124, DOI:10.1016/j.apgeochem.2012.08.001.
- A. K. Luhar, D. M. Etheridge, R. Leuning, Z. M. Loh, C. R. Jenkins and E. Yee, Locating and quantifying greenhouse gas emissions at a geological CO 2 storage site using atmospheric modeling and measurements: EMISSIONS AT A GEOLOGICAL CO2 STORAGE, J. Geophys. Res.: Atmos., 2014, 119(18), 10959–10979, DOI:10.1002/2014JD021880.
- N. Labat, M. Lescanne, J. Hy-Billiot, P. de Donato, M. Cosson and T. Luzzato, et al., Environmental monitoring and modelling, in Carbon Capture and Storage: the Lacq Pilot (Project and Injection Period 2006–2013, Total, France, 2015, ch. 7, pp. 180–186, total, disponible sur: https://www.globalccsinstitute.com/archive/hub/publications/194253/carbon-capture-storage-lacq-pilot.pdf Search PubMed.
- C. Jenkins, T. Kuske and S. Zegelin, Simple and effective atmospheric monitoring for CO2 leakage, Int. J. Greenhouse Gas Control, 2016, 46, 158–174, DOI:10.1016/j.ijggc.2016.01.001.
- J. Pironon, P. de Donato, O. Barrés, C. Garnier, C. Cailteau and A. Vinsot, et al., On-line greenhouse gas detection from soils and rock formations, Energy Procedia, 2009, 1(1), 2375–2382, DOI:10.1016/j.egypro.2009.01.309.
- F. Gal, K. Le Pierres, M. Brach, G. Braibant, C. Beny and A. Battani, et al., Surface Gas Geochemistry above the Natural CO 2 Reservoir of Montmiral (Drôme, France), Source Tracking and Gas Exchange between the Soil, Biosphere and Atmosphere, Oil Gas Sci. Technol., 2010, 65(4), 635–652, DOI:10.2516/ogst/2009068.
- C. Cailteau, J. Pironon, P. de Donato, A. Vinsot, T. Fierz and C. Garnier, et al., FT-IR metrology aspects for on-line monitoring of CO2 and CH4 in underground laboratory conditions, Anal. Methods, 2011, 3, 877–887, 10.1039/c0ay00623h.
- C. Cailteau, P. de Donato, J. Pironon, A. Vinsot, C. Garnier and O. Barres, In situ gas monitoring in clay rocks: mathematical developments for CO2 and CH4 partial pressure determination under non-controlled pressure conditions using FT-IR spectrometry, Anal. Methods, 2011, 3(4), 888, 10.1039/c0ay00622j.
- P. de Donato, J. Pironon, J. Sterpenich, A. Laurent, M. Piedevache and Z. Pokryszka, et al., CO2 flow baseline: Key factors of the geochemical monitoring program of future CO2 storage at claye-souilly (Paris basin), Energy Procedia, 2011, 4, 5438–5446, DOI:10.1016/j.egypro.2011.02.529.
- P. de Donato, J. Pironon, O. Barrès, J. Sausse, N. Quisel, S. Thomas, Z. Pokryszka and A. Laurent, Lessons Learned from Pratical Application of Geochemical Monitoring Methodology to CO2 Storage Site: Specific Case of Claye-Souilly project, Paris Basin, France, Carbon Management Technology Conference, 2012, 1–10 Search PubMed , CMTC CMTC-150308-PP.
- T. Schädle, B. Pejcic and B. Mizaikoff, Monitoring dissolved carbon dioxide and methane in brine environments at high pressure using IR-ATR spectroscopy, Anal. Methods, 2016, 8(4), 756–762, 10.1039/C5AY02744F.
- T. Schädle, B. Pejcic, M. Myers and B. Mizaikoff, Portable Mid-Infrared Sensor System for Monitoring CO2 and CH4 at High Pressure in Geosequestration Scenarios, ACS Sens., 2016, 1(4), 413–419, DOI:10.1021/acssensors.5b00246.
- A. Vinsot, C. A. J. Appelo, M. Lundy, S. Wechner, C. Cailteau-Fischbach and P. de Donato, et al., Natural gas extraction and artificial gas injection experiments in Opalinus Clay, Mont Terri rock laboratory (Switzerland), Swiss J. Geosci., 2017, 110(1), 375–390, DOI:10.1007/s00015-016-0244-1.
- U. Saleem, M. Dewar, T. N. Chaudhary, M. Sana, A. Lichtschlag and G. Alendal, et al., Numerical modelling of CO2 migration in heterogeneous sediments and leakage scenario for STEMM-CCS field experiments, Int. J. Greenhouse Gas Control, 2021, 109, 103339, DOI:10.1016/j.ijggc.2021.103339.
- A. Vinsot, C. A. J. Appelo, C. Cailteau, S. Wechner, J. Pironon and P. De Donato, et al., CO2 data on gas and pore water sampled in situ in the Opalinus Clay at the Mont Terri rock laboratory, Phys. Chem. Earth, 2008, 33, S54–S60, DOI:10.1016/j.pce.2008.10.050.
- J. Kiefer, Recent Advances in the Characterization of Gaseous and Liquid Fuels by Vibrational Spectroscopy, Energies, 2015, 8(4), 3165–3197, DOI:10.3390/en8043165.
- K. Romanak, L. Dobeck, T. Dixon and L. Spangler, Potential for a Process-based Monitoring Method above Geologic Carbon Storage Sites using Dissolved Gases in Freshwater Aquifers, Procedia Earth Planet. Sci., 2013, 7, 746–749, DOI:10.1016/j.proeps.2013.03.122.
- F. Gal, L. Julie, P. Zbigniew, G. Philippe, G. Solenne and P. François, et al., CO2 leakage in a shallow aquifer – Observed changes in case of small release, Energy Procedia, 2014, 63, 4112–4122, DOI:10.1016/j.egypro.2014.11.442.
- P. Gombert, Z. Pokryszka, S. Lafortune, J. Lions, F. Gal and C. Joulian, et al., Selection, Instrumentation and Characterization of a Pilot Site for CO2 Leakage Experimentation in a Superficial Aquifer, Energy Procedia, 2014, 63, 3172–3181, DOI:10.1016/j.egypro.2014.11.342.
- A. Petit, A. Cerepi, C. Loisy, O. Le Roux, L. Rossi and A. Estublier, et al., Aquifer-CO2 leak project: Physicochemical characterization of the CO2 leakage impact on a carbonate shallow freshwater aquifer, Int. J. Greenhouse Gas Control, 2021, 106, 103231, DOI:10.1016/j.ijggc.2020.103231.
- R. T. J. Porter, H. Mahgerefteh, S. Brown, S. Martynov, A. Collard and R. M. Woolley, et al., Techno-economic assessment of CO2 quality effect on its storage and transport: CO2 QUEST, Int. J. Greenhouse Gas Control, 2016, 54, 662–681, DOI:10.1016/j.ijggc.2016.08.011.
- S. Lafortune, P. Gombert, Z. Pokryszka, E. Lacroix, P. d. Donato and N. Jozja, Monitoring Scheme for the Detection of Hydrogen Leakage from a Deep Underground Storage. Part 1: On-Site Validation of an Experimental Protocol via the Combined Injection of Helium and Tracers into an Aquifer, Appl. Sci., 2020, 10(17), 6058, DOI:10.3390/app10176058.
- M. Derrien and V. Navelot, Rapport d’installation d’un système de mesure des gaz en forage: Site de Catenoy (60), Solexperts France, Vandoeuvre-les-Nancy, 2019, pp. 1–9, report no: RI_FRA222_Rostock Search PubMed.
- E. Lacroix, S. Lafortune, P. De Donato, P. Gombert, Z. Pokryszka and M.-C. Caumon, et al., Metrological Assessment of On-Site Geochemical Monitoring Methods within an Aquifer Applied to the Detection of H2 Leakages from Deep Underground Storages, Virtual AGU American Geophysical Union-Fall Meeting, 2020, Présentation poster présenté à: Virtual AGU American Geophysical Union-Fall Meeting 2020; 2020 déc 1, cité 23 nov 2020, Virtual, online. Disponible sur: https://www.essoar.org/doi/10.1002/essoar.10505922 Search PubMed.
- M. Magat, Effet Raman. Tables annuelles de constantes et données numériques n°15, Hermann & Cie, 1937, vol. XII, ch. 26, p. 146.
- H. W. Schrötter and H. W. Klöckner, Raman Scattering Cross Sections in Gases and Liquids, in Raman Spectroscopy of Gases and Liquids, ed. A. Weber, Springer Berlin Heidelberg, Berlin, Heidelberg, 1979, pp. 123–166, cité 23 avr 2020, disponible sur: http://link.springer.com/10.1007/978-3-642-81279-8_4 Search PubMed.
- G. Placzek, The Rayleigh and Raman Scattering, Lawrence Radiation Laboratory: UCRL, 1934, vol. 526, p. 212, cité 29 mars 2021, disponible sur: http://www.satyensaha.com/pdf%20files/literature/Placzek-Rayleigh-Raman-scattering-English.pdf Search PubMed.
- G. Placzek, The Rayleigh and Raman Scattering, Lawrence Radiation Laboratory: UCRL, 1959, vol. 526, p. 212, cité 29 mars 2021, disponible sur: http://www.satyensaha.com/pdf%20files/literature/Placzek-Rayleigh-Raman-scattering-English.pdf Search PubMed.
- B. Wopenka and J. D. Pasteris, Limitations to Quantitative Analysis of Fluid Inclusions in Geological Samples by Laser Raman Microprobe Spectroscopy, Appl. Spectrosc., 1986, 40(2), 144–151, DOI:10.1366/0003702864509592.
- J. D. Pasteris, B. Wopenka and J. C. Seitz, Practical aspects of quantitative laser Raman microprobe spectroscopy for the study of fluid inclusions, Geochim. Cosmochim. Acta, 1988, 52(5), 979–988, DOI:10.1016/0016-7037(88)90253-0.
- E. A. J. Burke, Raman microspectrometry of fluid inclusions, Lithos, 2001, 55(1–4), 139–158, DOI:10.1016/S0024-4937(00)00043-8.
- J. Dubessy, M.-C. Caumon, F. Rull and S. Sharma, Instrumentation in Raman spectroscopy: elementary theory and practice, in Raman Spectroscopy Applied to Earth Sciences and Cultural Heritage, ed. G. Ferraris, J. Dubessy, M.-C. Caumon and F. Rull, European Mineralogical Union, 2012, pp. 83–172, cité 11 mai 2020, disponible sur: https://pubs.geoscienceworld.org/books/book/948/chapter/106822777/ Search PubMed.
- V. Garcia-Baonza, F. Rull and J. Dubessy, Raman Spectroscopy of Gases, Water and other Geological Fluids, in Raman Spectroscopy Applied to Earth Sciences and Cultural Heritage, ed. G. Ferraris, J. Dubessy, M.-C. Caumon and F. Rull, European Mineralogical Union, 2012, pp. 279–320, cité 23 avr 2020, disponible sur: https://pubs.geoscienceworld.org/books/book/948/chapter/106833765/ Search PubMed.
- J. B. Goddard, A History of Gas Analysis, in Specialty Gas Analysis: a Practical Guidebook, WILEY-VCH, New York, 1997, ch. 1, pp. 1–19 Search PubMed.
- D. Adisaputro, P. De Donato, L. Saint-Andre, O. Barres, C. Galy and G. Nourrisson, et al., Baseline Subsoil CO2 Gas Measurements and Micrometeorological Monitoring: Above Canopy Turbulence Effects on the Subsoil CO2 Dynamics in Temperate Deciduous Forest, Appl. Sci., 2021, 11(4), 1753, DOI:10.3390/app11041753.
- C. I. Steefel, C. A. J. Appelo, B. Arora, D. Jacques, T. Kalbacher and O. Kolditz, et al., Reactive transport codes for subsurface environmental simulation, Comput. Geosci., 2015, 19(3), 445–478, DOI:10.1007/s10596-014-9443-x.
- J. Dai, W. Peng, G. Wang, F. Xiang, Y. Qin and M. Wang, et al., Ultra-high sensitive optical fiber hydrogen sensor using self-referenced demodulation method and WO_3-Pd_2Pt-Pt composite film, Opt. Express, 2017, 25(3), 2009, DOI:10.1364/OE.25.002009.
- S. Cai, Á. González-Vila, X. Zhang, T. Guo and C. Caucheteur, Palladium-coated plasmonic optical fiber gratings for hydrogen detection, Opt. Lett., 2019, 44(18), 4483, DOI:10.1364/OL.44.004483.
- C. Bishop, Y. Halfaya, A. Soltani, S. Sundaram, X. Li and J. Streque, et al., Experimental Study and Device Design of NO, NO 2, and NH 3 Gas Detection for a Wide Dynamic and Large Temperature Range Using Pt/AlGaN/GaN HEMT, IEEE Sens. J., 2016, 16(18), 6828–6838, DOI:10.1109/JSEN.2016.2593050.
Footnote |
| † Electronic supplementary information (ESI) available: Appendix 1: schematic representation of the continuous gas monitoring device in the Catenoy site (according to Derrien and Navelot, 2019). Appendix 2: completion module installation in PZ2 ter in the Catenoy site with the packer and the gas circulation lines (Solexperts' photography, according to Derrien and Navelot, 2019). Appendix 3: mathematical development for the calculation of the peak area and the quantitative calculation of the gas concentration. Appendix 4: determination of the optical characteristics: signal-to-noise ratio (SNR) and the instrumental derivative factor (F). See DOI: 10.1039/d1ay01063h |
| This journal is © The Royal Society of Chemistry 2021 |

