 Open Access Article
Identification of black microplastics using long-wavelength infrared hyperspectral imaging with imaging-type two-dimensional Fourier spectroscopy†
Kosuke
Nogo
 a,
Kou
Ikejima
b,
Wei
Qi
a,
Natsumi
Kawashima
a,
Tomoya
Kitazaki
a,
Satoru
Adachi
a,
Kenji
Wada
c,
Akira
Nishiyama
c and
Ichiro
Ishimaru
*a
a,
Kou
Ikejima
b,
Wei
Qi
a,
Natsumi
Kawashima
a,
Tomoya
Kitazaki
a,
Satoru
Adachi
a,
Kenji
Wada
c,
Akira
Nishiyama
c and
Ichiro
Ishimaru
*a
aFaculty of Engineering, Kagawa University, 2217-20 Hayashi-cho, Takamatsu, Kagawa 761-0396, Japan. E-mail: ishimaru.ichiro@kagawa-u.ac.jp
bFaculty of Agriculture and Marine Science, Kochi University, 200 Otsu, Monobe, Nangoku, Kochi 783-8502, Japan
cFaculty of Medicine, Kagawa University, 1750-1 Miki-cho, Kita, Kagawa 761-0793, Japan
First published on 15th January 2021
Abstract
Despite recent progress in focal plane array Fourier transform infrared spectroscopy (FPA-FT-IR) for automatic microplastic (MP) discrimination, the analysis time is still too long (e.g., 9 h for a sample with a diameter of 47 mm) and the equipment is expensive. As a solution, a hyperspectral camera restricted to the near-infrared or short-wavelength infrared band could be applied. However, with these bands, the minimum discriminable size is only about 100 μm, and discrimination among darkly colored plastics is difficult. The long-wavelength infrared (LWIR) band is reportedly effective for discrimination among darkly colored plastics. In this study, we constructed a palm-sized LWIR hyperspectral camera (105 mm × 90 mm × 50 mm, 1.25 kg) for imaging-type two-dimensional Fourier spectroscopy. Our system used a general-purpose, inexpensive, and compact microbolometer for the LWIR band. This system could record the absorbance of black MPs (polystyrene, polyethylene, and polypropylene) in a 3.8 mm × 3.0 mm area in 36 s, which was less than 1/6th of the time required for FPA-FT-IR. Additionally, our system could obtain spectra for a 12 μm × 12 μm area. Because our device is cheaper and more compact than a FPA-FT-IR, it will be easier to take out in the field or on a research vessel.
1. Introduction
There is growing concern about microplastic (MP) pollution in aquatic environments. MPs are commonly defined as plastic particles that are <5 mm in diameter, and are classified as primary and secondary according to their sources.1,2 Primary MPs are those that enter the environment directly either accidently or intentionally, while secondary MPs are derived from fragmentation of larger plastic waste.1 MP pollution is widespread from freshwater to the open ocean and from the sea surface to deep sea sediments.3–5 MPs have also been detected in organisms ranging from large fish to small zooplankton and benthic invertebrates, and in bacterial communities, where they have adverse effects because of physical impacts and endocrine disruption induced by plastic additives and waterborne persistent organic pollutants adsorbed by the MPs.6–8 Ultimately, the biological and ecological impacts of MPs could pose risks to human livelihoods and health.2,8,9 Despite the growing number of publications regarding the distributions and potential harmful effects of MP pollution, many knowledge gaps remain in our understanding of the mechanisms of MP pollution. These gaps need to be filled to support evidence-based decision and policy making.To better understand the distribution and fate of MPs in the environment and biota, and the mechanisms of their biological and ecological effects, both field and experimental studies are required to successfully detect MPs, identify the polymer types, and measure the number of MPs and their sizes.10,11
Visual sorting (including counting and size measurement) and subsequent analysis using pyrolysis (e.g., GC-MS) or spectroscopy (e.g., Fourier transform infrared spectroscopy (FT-IR) or Raman spectroscopy) for polymer identification is the most widely used approach.10,11 However, misidentification (both false positives and negatives) occurs in visual sorting, especially for the objects smaller than 1 mm in diameter.12 Staining of MPs with lipophilic fluorescent staining agents, such as Nile red, and measurement of the fluorescence is an inexpensive method that can reduce the rate of misidentification of MPs as non-plastics; however, it is difficult to distinguish the polymer type with this method alone.13
An alternative emerging approach is chemical imaging. Since the 2000s, progress in focal plane array (FPA) technology has led to the development of FPA-FT-IR for two-dimensional (2D) spectroscopic measurement.14 With single-point measurements by FT-IR, it is necessary to perform a separate measurement for each sample. Conversely, FPA-FT-IR can be used for analysis of many different small samples at the same time. Consequently, it is particularly suitable for MP analysis. In recent years, many studies have used FPA-FT-IR for discrimination among MPs.15–24 However, the spectral measurement time is very long. For example, Tagg et al. (2015) reported a spectral measurement time of 9 h for an area with a diameter of 47 mm, Bergmann et al. (2019) reported a spectral measurement time of 4 h for an area of 14 mm × 14 mm, and Liu et al. (2019) reported a spectral measurement time of 4 h for an area with a diameter of 10 mm.18,22–24 The long analysis times are attributed to the wide wavenumber range of FT-IR (400–4000 cm−1 [2.5–25 μm]), which beneficially gives a signal with a high signal-to-noise ratio. If the wavenumber range is expanded to include long wavelengths, to satisfy the sampling theorem, the sampling interval needs to be decreased, which increases the number of acquired data points and in turn the measurement time.25 Furthermore, a wider wavenumber range produces more data for analysis, which means it takes longer to detect characteristic peaks and perform spectral correlation analysis with reference data. The number of pixels in a wideband FPA mounted on a commercially available FPA-FT-IR is usually around 128 × 128, and if the measurement range assigned to one pixel is 20 μm × 20 μm, the measurable area is only 2.56 mm × 2.56 mm at most.23,24 Widening the wavenumber band is problematic because it increases the cost of the equipment since broadband FPAs are expensive.26 In addition, broadband FPAs used in FT-IR frequently use HgCdTe, which means the device will need a cooling system to reach the required low operating temperature of around 100 K or less. Incorporation of a cooling system will directly increase the equipment size, mass, and cost.26
To solve these problems, hyperspectral cameras with wavenumber ranges limited to the near-infrared and short-wavelength infrared (SWIR) bands have been applied to plastic analysis.27–30 Shan et al. (2019) used the SWIR band to discriminate among eight kinds of plastics, and Zhu et al. (2020) used the SWIR band of 5882–10![[thin space (1/6-em)]](https://www.rsc.org/images/entities/char_2009.gif) 000 cm−1 (1.0–1.7 μm) to discriminate among 11 kinds of plastics.27,28 However, when the MP diameter is smaller than 100 μm, the ability to discriminate among polymer types decreases.27,28 Additionally, it becomes difficult to detect characteristic peaks for dark-colored (e.g., gray and black) plastics that contain carbon black.28 Serranti et al. (2018) used the 4000–10
000 cm−1 (1.0–1.7 μm) to discriminate among 11 kinds of plastics.27,28 However, when the MP diameter is smaller than 100 μm, the ability to discriminate among polymer types decreases.27,28 Additionally, it becomes difficult to detect characteristic peaks for dark-colored (e.g., gray and black) plastics that contain carbon black.28 Serranti et al. (2018) used the 4000–10![[thin space (1/6-em)]](https://www.rsc.org/images/entities/char_2009.gif) 000 cm−1 (1.0–2.5 μm) band to discriminate among three polymer types with a minimum size of 500 μm, and Schmidt et al. (2018) used the same band to discriminate among five polymer types with almost the same minimum size (450 μm).29,30 Perhaps the 4000–5000 cm−1 (2.0–2.5 μm) band could be used for identification of black MPs; however, HgCdTe or InSb is needed in the 4000–5000 cm−1 (2.0–2.5 μm) band, and as stated above, this means a cooling device is required, which is not conducive to downsizing the system.26 It has been reported that the mid-wavelength infrared (MWIR) band and long-wavelength infrared (LWIR) band of 4000 cm−1 or less (2.5 μm or more) are effective for stable detection of darkly colored plastics, which is problematic with the SWIR band.31,32 However, although hyperspectral cameras for the MWIR and LWIR bands are commercially available, they have not been applied to MP measurements.33,34
000 cm−1 (1.0–2.5 μm) band to discriminate among three polymer types with a minimum size of 500 μm, and Schmidt et al. (2018) used the same band to discriminate among five polymer types with almost the same minimum size (450 μm).29,30 Perhaps the 4000–5000 cm−1 (2.0–2.5 μm) band could be used for identification of black MPs; however, HgCdTe or InSb is needed in the 4000–5000 cm−1 (2.0–2.5 μm) band, and as stated above, this means a cooling device is required, which is not conducive to downsizing the system.26 It has been reported that the mid-wavelength infrared (MWIR) band and long-wavelength infrared (LWIR) band of 4000 cm−1 or less (2.5 μm or more) are effective for stable detection of darkly colored plastics, which is problematic with the SWIR band.31,32 However, although hyperspectral cameras for the MWIR and LWIR bands are commercially available, they have not been applied to MP measurements.33,34
We previously developed a palm-sized hyperspectral camera for the LWIR band combined with a microbolometer and imaging-type 2D Fourier spectrometer.35 A microbolometer is an inexpensive and uncooled FPA, which is sensitive in the LWIR band.26 Imaging-type 2D Fourier spectroscopy can be applied to measure a cell with a diameter of 20 μm in the visible light region.36 We wondered if a hyperspectral camera using the LWIR band could be constructed that would be less expensive, more compact, and faster than FPA-FT-IR. Such an instrument would be more applicable to the measurement of black MPs as it could be easily transported to the field or on research vessels.
In this paper, we compared our results for black polystyrene (PS), polyethylene (PE), and polypropylene (PP) with reference spectra. We also investigated MP identification using the LWIR band (714–1250 cm−1 [8–14 μm]). Furthermore, we compared the measurement time of our proposed method with that of FPA-FT-IR.
2. Imaging-type 2D Fourier spectroscopy
2.1 Comparison with the Michelson interferometer
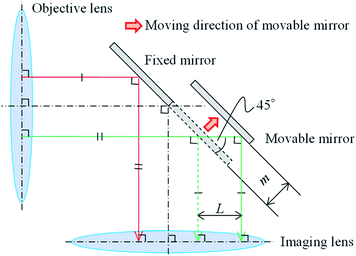
Imaging-type two-dimensional Fourier spectroscopy is categorized as a Fourier spectroscopy method. Fourier spectroscopy is more sensitive than dispersive spectroscopy, which uses a diffraction grating or prism, and it is easier to achieve both good wavenumber resolution and sensitivity.34The features of imaging-type 2D Fourier spectroscopy can be described in comparison with the Michelson interferometer, which is mainly used in FT-IR.25 The optical systems of a Michelson interferometer and imaging-type 2D Fourier spectrometer are shown in Fig. 1(a) and (b), respectively. In both the Michelson interferometer and imaging-type 2D Fourier spectrometer, the light emitted nondirectionally from the bright point is converted into a parallel luminous flux by an objective lens, divided into two parts, and then reunited by an imaging lens with a path length difference created by fixed and movable mirrors. This produces an interferogram of the interference intensity change at each pixel of the FPA.
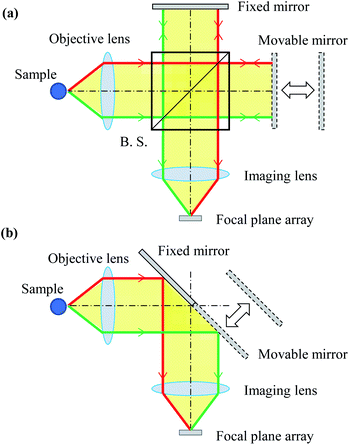 | ||
| Fig. 1 Optical system of the (a) Michaelson interferometer and (b) imaging-type 2D Fourier spectrometer. | ||
The Michelson interferometer and imaging-type 2D Fourier spectrometer differ in how the parallel luminous flux is divided. In the Michelson interferometer, the parallel luminous flux is split by a beam splitter (strictly speaking, a half-mirror) into two parallel luminous fluxes, each of which has an intensity of half of that of the original parallel luminous flux. One of these is directed to the fixed mirror and the other to the movable mirror. Conversely, in imaging-type 2D Fourier spectroscopy, half of the parallel luminous flux is reflected by a fixed mirror and the other half by a movable mirror.
According to the characteristics of the parallel flux splitting method, the Michelson interferometer is classed as an amplitude-divided interferometer, while the imaging-type 2D Fourier spectrometer is classed as a wavefront-divided interferometer. Therefore, an anti-vibration mechanism is essential for the Michelson interferometer. In imaging-type 2D Fourier spectrometer, the wavefront-divided light fluxes pass through an almost common optical path, so that even if vibrations are superimposed on the mirror, there is no relative difference in the optical path length between the light fluxes. This means the system has high vibration resistance and overcomes that weakness of the Michelson interferometer. Compared with Michelson interferometry, imaging-type 2D Fourier spectroscopy requires fewer optical components, does not require an anti-vibration mechanism, and has a shorter optical path. Therefore, imaging-type 2D Fourier spectrometers can be used to construct cheaper, smaller, lighter, and more vibration-resistant devices than the Michelson interferometer. In fact, imaging-type 2D Fourier spectroscopy has been successfully used on a drone to superimpose mechanical vibrations and observe interferograms in flight.35
2.2 Minimum spectral acquisition area and measurement area
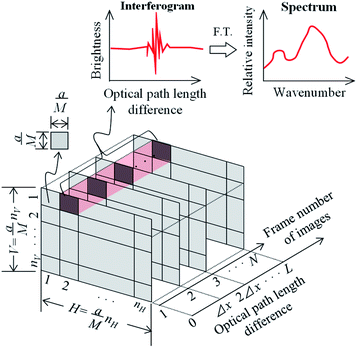
In imaging-type 2D Fourier spectroscopy, a spectrum is obtained for each pixel of the FPA shown in Fig. 2. The spectrum of all pixels is obtained simultaneously in one scan. If the pixel size of the FPA is a × a and the magnification of the optical system is M, then the field of view per pixel of the FPA is a/M × a/M, which is the minimum area that can be acquired with this method. Therefore, when the number of pixels in the vertical direction of the FPA is nV and the number of pixels in the horizontal direction is nH, the measurement ranges in the vertical (V) and horizontal (H) directions can be expressed using the following equations: | (1) |
 | (2) |
This means that the measurement area is V × H.
2.3 Spectral acquisition time
For spectroscopic measurements, it is necessary to set an appropriate wavenumber resolution for the target because it affects the ability to separate adjacent peaks in the resulting spectrum. In Fourier spectroscopy, the wavenumber resolution, Δν, and the maximum optical path length difference, L, between two light fluxes to cause interference are related as shown in eqn (3).25 | (3) |
To improve the wavenumber resolution in Fourier spectroscopy, it is necessary to increase the maximum optical path length difference. In imaging-type 2D Fourier spectroscopy, an optical path length difference is given between two light beams by a fixed mirror and a movable mirror installed at an angle of 45° with respect to the incident light beam (Fig. 3). Therefore, the distance, m, the movable mirror needs to move to maximize the optical path length difference, L, is expressed as shown in eqn (4).
 | (4) |
Next, considering the image acquisition interval and to satisfy the sampling theorem, the sampling interval, Δx, must fulfill eqn (5) to allow for discrete observation of the interferogram by the FPA (Fig. 2). vmax in eqn (5) is the maximum wavenumber in the measurement wavenumber band.
 | (5) |
Accordingly, the number, N, of image acquisitions required to obtain the desired wavelength resolution, Δν, can be expressed as follows:
 | (6) |
Therefore, the interferogram acquisition time, t, required to acquire N images, which corresponds to the measurement time in the present method, is given by eqn (7) using the frame rate, f, of the FPA.
 | (7) |
The movable mirror may be moved a distance, m, at a speed, S, as shown in eqn (8).
 | (8) |
The spectral acquisition time, T, is equal to the interferogram acquisition time, t, plus the time for the Fourier transform process (tFT), which includes the read time of the group of images in which the interferogram was recorded.
| T = t + tFT | (9) |
The value of tFT varies with the Fourier transform algorithm (e.g., discrete Fourier Transform or fast Fourier Transform (FFT)) and computer processing power. The spectral acquisition time in Michelson interferometry can also be obtained by eqn (4)–(9). However, in the Michelson interferometer, the mirror surface is perpendicular to the direction of the light flux, so in eqn (4)m = L/2.
3. Materials and methods
The ability to measure black MPs using the LWIR band and an imaging-type 2D Fourier spectrometer was investigated. In addition, FT-IR was used to study differences among SWIR, MWIR, and LWIR measurements of white and black plastics.3.1 Materials
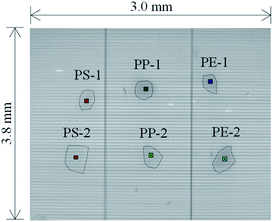
PS, PP, and PE, which are the main plastics found in the ocean, were used as samples. Black PS cups (thickness: 1 mm, Sunnap Co., Ltd., Tokyo, Japan), PP lids (thickness: 1 mm, Kaneiwanori Co., Ltd., Kochi, Japan), and PE garbage bags (thickness: 20 μm, System Polymer Co., Ltd., Tokyo, Japan) (Fig. 4(a)) were used to create black MPs. The thickness of a sample is known to influence the spectral measurement. Therefore, to prepare black MPs of known thickness, we cut out specimens of about 4 mm × 4 mm (Fig. S1(a)†) from the products shown in Fig. 4(a) (e.g., PS_1 and PS_2 were cut from the black PS cups) and then measured their thicknesses using a micrometer (M820-25, Mitutoyo Corporation, Kanagawa, Japan). The thicknesses of the specimens shown in Fig. S1(a)† were 47 μm for PS_1, 78 μm for PS_2, 44 μm for PP_1, 75 μm for PP_2, 21 μm for PE_1, and 21 μm for PE_2. The black MPs shown in Fig. S1(b)† were cut from the Fig. S1(a)† specimens (e.g., PS-1 was cut from PS_1) and had thicknesses of less than 47 μm for PS-1, 78 μm for PS-2, 44 μm for PP-1, 75 μm for PP-2, 21 μm for PE-1, and 21 μm for PE-2. Fig. 4(b) shows microscope images of the samples in Fig. S1(b)† taken with a digital microscope (KH-7700, HIROX CO., LTD., Tokyo, Japan).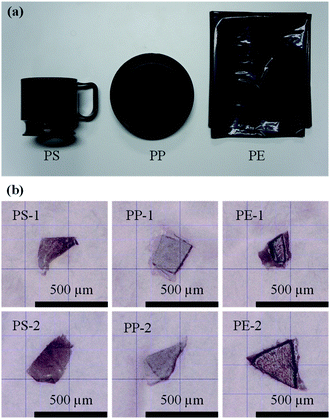 | ||
| Fig. 4 (a) Black plastic products. (b) Microscope images of the black MPs shown in Fig. S1(b).† | ||
Fig. S2† shows the white plastic samples measured for spectral comparison with the black plastics. These samples were white PS plate (thickness: 1 mm, HIKARI CO., LTD., Osaka, Japan), PP plate (thickness: 1 mm, Plaport Co., Ltd., Shizuoka, Japan), and PE garbage bags (thickness: 20 μm, Daiso Sangyo Co., Ltd., Hiroshima, Japan).
3.2 Measurement of black MPs with an imaging-type 2D Fourier spectrometer
The experimental optical system used for MP measurements in this study comprised an imaging-type 2D Fourier spectrometer, a sample table, and a light source (Fig. 5). The imaging-type 2D spectrometer (105 mm × 90 mm × 50 mm, 1.25 kg) comprised an observation magnification lens (ø 50 mm, focal length: 50 mm), multislit array (aperture: 24 μm, light shield: 24 μm),37 objective lens (ø 25 mm, focal length: 17 mm), fixed mirror, movable mirror, imaging lens (ø 25 mm, focal length: 17 mm), and a FPA (Boson 320, FLIR Systems, Inc., Wilsonville, OR). The movable mirror was adjusted by a piezo stage (PPS-20-11300, Micronix USA, LLC, Santa Ana, CA) with a stage controller (MMC-100-01010, Micronix USA). An aluminum plate was used as the sample table. An IR light source (IR-Si217-P1, Hawkeye Technologies, Inc., Milford, CT) with a condenser lens (ø 50 mm, focal length: 25 mm) was used for illumination. A DC power supply (31.5 W, eps80WL, Fujitsu Ltd., Kanagawa, Japan) was used to power the IR light source. The black MPs shown in Fig. 4(b) were used as the samples. Light reflection from the aluminum plate without any sample was measured as the background spectrum.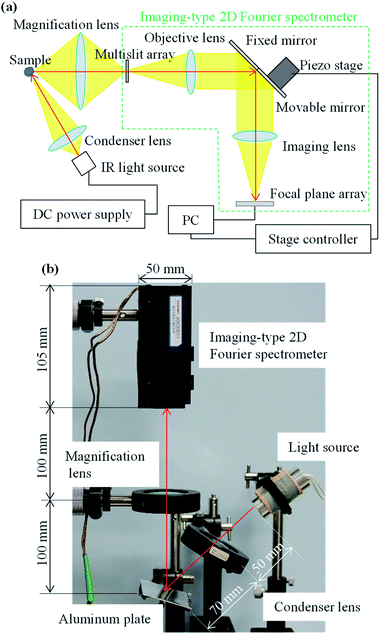 | ||
| Fig. 5 (a) Configuration of a hyperspectral imaging system for imaging-type two-dimensional Fourier spectroscopy. (b) Experimental setup for microplastic measurements. | ||
Table 1 shows the sample and background measurement conditions. The measurement conditions were a wavenumber resolution of 8 cm−1, wavenumber range of 714–1250 cm−1 (8–14 μm), and one scan. SpectroCapture software (NISSIN KIKAI Co., Ltd., Kagawa, Japan) was used to control the movable mirror and FPA, and to acquire the image files (16-bit TIFF format) in which the interferograms were recorded by the spectrometer.
| Parameter | Value |
|---|---|
| Wavenumber range | 714–1250 cm−1 |
| Wavenumber resolution | 8 cm−1 |
| Optical path length difference | 1250 μm |
| Movable mirror travel range | 884 μm |
| Sampling interval | 2 μm |
| Speed of movable mirror | 59 μm s−1 |
| Number of images | 870 frames |
| Frame rate | 60 fps |
| Pixel area of the FPA | 12 μm × 12 μm |
| Number of pixels in the FPA | 320 × 256 |
| Optical magnification | 1× |
| Minimum area for acquiring the spectrum | 12 μm × 12 μm |
| Measurement area | 3.8 mm × 3.0 mm |
| Number of scans | 1 |
| Interferogram acquisition time | 30 s (15 s for the background and 15 s for the sample) |
| Time for the Fourier transform process | 6 s (including the read time of the images, which recorded the interferogram of the background and the sample) |
| Spectrum acquisition time | 36 s (interferogram acquisition time plus the time for the Fourier transform process) |
SpectroViewer (NISSIN KIKAI Co., Ltd.) was used to obtain the spectrum of each pixel from the interferogram, which was recorded in the direction of the number of images (16-bit TIFF format). The spectra were obtained by applying FFT to the interferogram. Before FFT, the interferogram was multiplied by the 870-point Hanning window and zero-filled to get 4096 data points. Δx in the proposed method was strictly different for each pixel because of the influence of the angle of view. If this was not corrected and Fourier transformed, the wavenumber of the spectrum would be misaligned between the pixels in the horizontal direction. Inui et al. (2011) proposed a method for correcting the deviation of Δx for each pixel, and this is implemented in SpectroViewer.38 The specific method of correction using the function is described in ESI (Section S2†). Absorbance spectra were calculated using the Beer–Lambert law from spectra obtained from a group of sample and background image files.39
In SpectroViewer, the averaged absorbance spectra of neighboring pixels centered on the pixel of interest can be output as the absorbance spectrum of the pixel of interest. In this paper, to reduce noise by averaging, the absorbance spectra of 5 × 5 pixels (25 pixels in total) centered on the pixel of interest were averaged, and the slope of the baseline was removed by subtracting the approximate line obtained in the range of 700 cm–1250 cm−1.
The observation area of 5 × 5 pixels corresponds to 60 μm × 60 μm since the field of view per pixel is 12 μm × 12 μm. The spectra for average pixel numbers of 1 × 1, 3 × 3, 5 × 5, 7 × 7, and 9 × 9 are given in the ESI (Section S3†).
SpectroViewer has a function to obtain the absorbance difference between two wavenumbers for each pixel and to create a color map. Using this function, we confirmed that black PS, PP, and PE could be extracted. SpectroViewer was implemented on a PC (processor: Intel(R) Core(TM) i5-5300U CPU 2.30 GHz, Implemented Memory (RAM): 4 GB, OS: Windows 10 Home 64 bit).
3.3 White and black plastic measurements by FT-IR
To compare the spectra of white and black plastics over the SWIR to LWIR bands, the reflection measurement method was chosen instead of the transmission or attenuated total reflection (ATR) method.40 The SWIR band generally has a lower absorption coefficient (amount of light absorbed per optical path length) than the MWIR or LWIR band, and if the sample is made thicker to enhance the absorption of the SWIR band, the transmitted light intensity of the MWIR and LWIR bands will be significantly attenuated. The ATR method uses evanescent wave penetration to measure the amount of light absorption in a sample. It is known that the depth of evanescent wave penetration into the sample is proportional to the wavelength of the light. In the SWIR band, the light absorption is lower than in the MWIR and LWIR bands, and the penetration depth into the sample is shallow. Therefore, it is difficult to measure the absorbance in the SWIR band by the ATR method.Therefore, using point-measurement-type FT-IR (ALPHA 2, Bruker Corporation, Billerica, MA) with the front-reflection accessory (Front-REFL, Bruker Corporation, Billerica, MA), reflection measurements were conducted by pressing the samples over the measurement surface (aperture diameter of 4 mm). The black and white PS and PP samples shown in Fig. 4(a) and S2† were measured in contact with a 1-mm-thick area. The black and white PE samples shown in Fig. 4(a) and S2† were measured in contact with a 20-μm-thick area. For the sample measurements, an aluminum plate was placed on the back of the contact area of the sample. The aluminum plate was used on its own for background measurements. The measurement conditions were a wavenumber resolution of 8 cm−1, wavenumber range of 350–8000 cm−1 (1.3–26.7 μm), and 64 scans. The FT-IR measurements and the output of the results were performed using OPUS 8.5 (SP1) software (Bruker Corporation, Billerica, MA).
3.4 Preparation of reference absorbance spectra used to support the measurement results and discussion
To objectively support our discussion, we used the spectral database for various plastics provided by Primpke et al. (2018) This database (file name: 216_2018_1156_MOESM2_ESM.xlsx) contains multiple spectral datasets for one plastic species measured by the ATR method (wavenumber range: 400–4000 cm−1, wavenumber resolution: 4 cm−1).20 We averaged spectra for each plastic species according to the identification numbers shown in Table 2. The averaged spectra were then normalized (absorbance minimum of 0 to a maximum of 1) and treated as representative spectra for each plastic species.| Polymer | Data identification number(s) |
|---|---|
| Acrylonitrile butadiene styrene | 2 and 3 |
| Nylon | 146, 147, 148, 149, 150, 151, and 152 |
| Polycarbonate | 138, 165, 166, 213, 214, and 322 |
| Polyethylene | 12, 13, 14, 52, 53, 54, 109, and 226 |
| Polyethylene terephthalate | 98, 99, 136, 172, 173, 174, 189, 227, and 323 |
| Polymethyl methacrylate | 192, and 324 |
| Polyoxymethylene | 244 |
| Polypropylene | 108, 143, 229, 230, 231, 232, 247, 248, 249, 250, 252, and 325 |
| Polystyrene | 64, 68, 233, 253, 254, 255, and 326 |
| Polytetrafluoroethylene | 196 and 235 |
| Polyvinyl chloride | 107, 140, 201, and 327 |
3.5 Evaluation of spectral similarity
To evaluate the spectra, correlation coefficients were calculated as follows: | (10) |
4. Results and discussion
4.1 Experimental results
Fig. 6 shows the LWIR band images for black PS, PP, and PE. Fig. 7 shows a comparison of the absorbance spectra obtained for each pixel on the black MPs in Fig. 6 with the reference spectra obtained in Section 3.4, and a color map created using the difference in absorbance values for the two wavenumbers for each pixel. In Fig. 7(a), peaks at 758 cm−1, 910 cm−1, 1030 cm−1, and 1072 cm−1, which can also be seen in the PS reference spectrum, are observed for the pixels on PS-1 and PS-2. Fig. 7(b), which was created using the difference in absorbance values between the peak at 758 cm−1 and the dip at 720 cm−1, shows highlighted areas around PS-1 and PS-2. In Fig. 7(c), peaks at 841 cm−1, 974 cm−1, 999 cm−1, and 1168 cm−1, which can be seen in the reference spectrum of PP, are observed in the spectra obtained for the pixels on PP-1 and PP-2. Fig. 7(d), which was created from the difference in absorbance values between the peak at 1168 cm−1 and the dip at 1200 cm−1, shows highlighted areas around PP-1 and PP-2. Fig. 7(e) shows that the 720 cm−1 peak seen in the reference spectrum of PE is also present in the spectra obtained for the pixels on PE-1 and PE-2. Fig. 7(f), which was created from the difference in absorbance values between the peak at 720 cm−1 (dip in PS) and the dip at 758 cm−1 (peak in PS), shows highlighted areas around PE-1 and PE-2. Table 3 shows the correlation coefficients between the spectra in Fig. 7(a), (c), and (e). The software, SpectroViewer, which we used to generate the color map, does not have a function to calculate the correlation coefficients between reference spectra and measured results or to display the correlation coefficient in a color map. However, because the correlation coefficients are high among the same plastics in Table 3, it is possible to identify PS, PP and PE using the correlation coefficients, at least for the samples used in this measurement.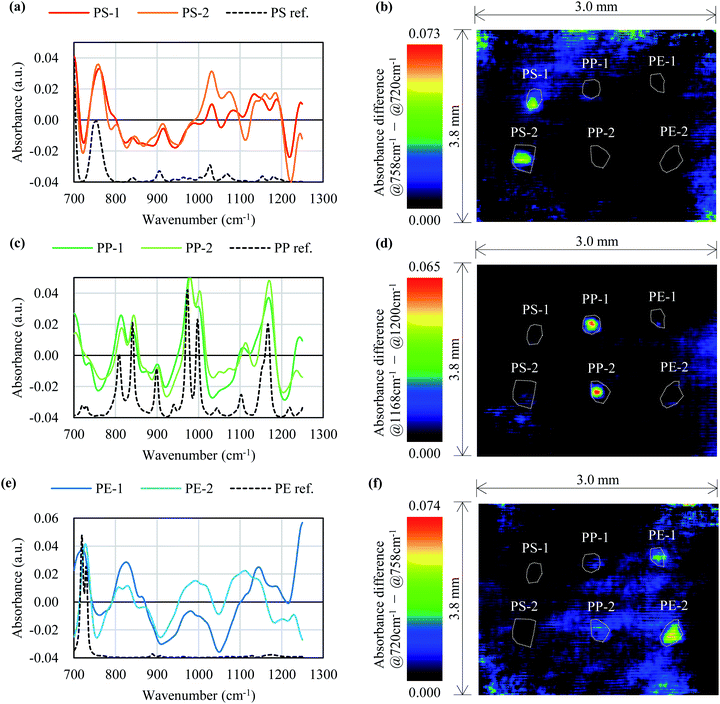 | ||
| Fig. 7 Comparison of the measured and reference absorbance spectra of the black MPs in Fig. 6 and a color map of the absorbance differences. (a), (c), and (e) show absorbance spectra of PS, PP, and PE respectively. (b), (d), and (f) show the color map of PS, PP, and PE extracted in Fig. 6 focusing on the absorbance differences. | ||
| PS-1 | PS-2 | PP-1 | PP-2 | PE-1 | PE-2 | |
|---|---|---|---|---|---|---|
| a Abbreviations: PS, polystyrene; PP, polypropylene; PE, polyethylene. | ||||||
| PS ref. | 0.63 | 0.51 | −0.11 | −0.06 | −0.02 | −0.34 |
| PP ref. | −0.14 | −0.06 | 0.70 | 0.72 | 0.13 | 0.24 |
| PE ref. | −0.07 | −0.16 | 0.01 | 0.03 | 0.36 | 0.35 |
The absorbance values of PS-1, PS-2, PP-1, PP-2, PE-1, and PE-2 with average pixel numbers of 1 × 1, 3 × 3, 5 × 5, 7 × 7, 9 × 9, and 11 × 11 are shown in Fig. S6.† With an average pixel number of 1 × 1, the results were noisy. With average pixel numbers of 3 × 3 or more, the results were very similar and the characteristic peaks remained unchanged as the average pixel number increased up to 11 × 11, which indicated that the absorbance was stable for the MP. The stable detection of characteristic peaks an area of 100 μm × 100 μm for black MPs with a thickness of less than 100 μm demonstrated the applicability of the proposed method to analysis of black MPs with a particle size of less than 100 μm.
4.2 Possible MP discrimination using the LWIR band
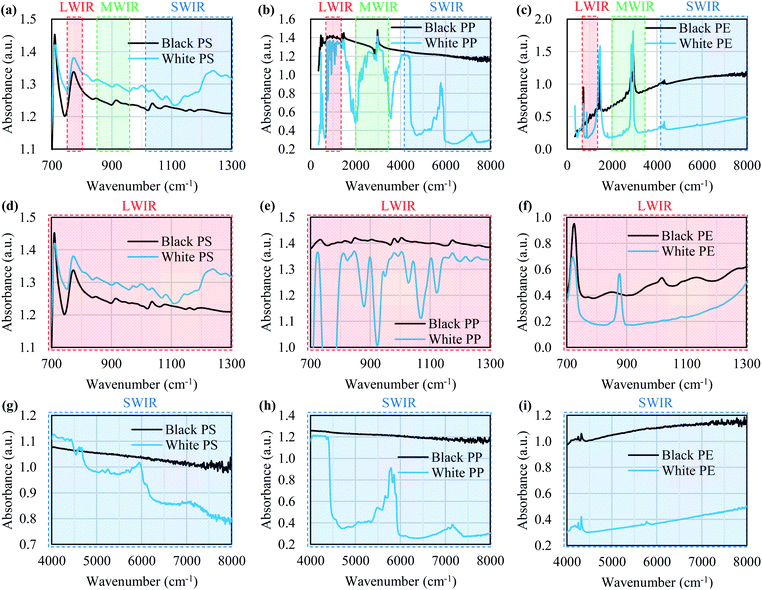
Fig. 8 shows the FT-IR reflection measurement results for the white and black PS (thickness: 1 mm), PP (thickness: 1 mm), and PE (thickness: 20 μm) samples shown in Fig. 4(a) and S2.†Fig. 8(d)–(f) shows enlargements of the LWIR band (700–1300 cm−1) and Fig. 8(g)–(i) shows enlargements of the SWIR band (4000–8000 cm−1) in Fig. 8(a)–(c). The overall absorbance of black plastics tends to be shallower with less of a difference between the maximum and minimum than for white plastics. This is especially true for the SWIR band. In the 4500–8000 cm−1 region, the peaks for black PS, PP, and PE are flatter than those in the 4000–4500 cm−1 region and no peaks are observed for white plastics. For plastics with an absorption peak in the 4000–4500 cm−1 region it may be possible to use the SWIR band for discrimination and avoid the effect of plastic color on the results. However, it will be difficult to identify black PS and PP using the SWIR band. According to Vázquez-Guardado et al. (2015), the LWIR and MWIR bands are less affected by color than the SWIR band.31The spectra obtained in Section 3.4 were used to confirm the ability to discriminate between plastic species in the LWIR band. Fig. 9 shows the spectra obtained in Section 3.4 with the baseline offset to facilitate their comparison. Tables 4–6 show the correlation matrix between the spectra of each plastic species in the 400–4000 cm−1, LWIR (714–1250 cm−1), and MWIR (2000–3333 cm−1) bands. The red-shaded cells in Tables 4–6 highlight the highest correlation coefficient in each column. The smallest and largest of these highlighted values in the same column across Tables 4–6 are circled with red-dotted lines and blue-dotted lines, respectively. Considering that a smaller correlation coefficient indicates lower spectral similarity, we can say that a table with more columns with red-circled cells has a higher discrimination ability for plastic species, and a table with more columns with blue-circled cells has a lower discrimination ability. Table 4 has three columns with red-circled cells and no columns with blue-circled cells. Table 5 has six columns with red-circled cells and two columns with blue-circled cells. Table 6 has two columns with a red-circled cell and nine columns with blue-circled cells.
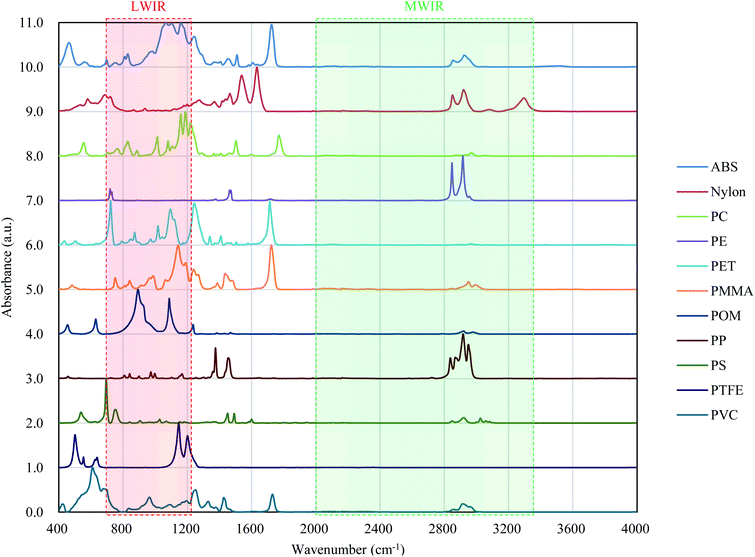 | ||
| Fig. 9 Absorbance values of various plastics. Measurement of these spectra is described in Section 3.4. | ||
| a Abbreviations: ABS, acrylonitrile butadiene styrene; PC, polycarbonate; PE, polyethylene; PET, polyethylene terephthalate; PMMA, polymethyl methacrylate; POM, polyoxymethylene; PP, polypropylene; PS, polystyrene; PTFE, polytetrafluoroethylene; PVC, polyvinyl chloride. |
|---|

|
| a Abbreviations: ABS, acrylonitrile butadiene styrene; PC, polycarbonate; PE, polyethylene; PET, polyethylene terephthalate; PMMA, polymethyl methacrylate; POM, polyoxymethylene; PP, polypropylene; PS, polystyrene; PTFE, polytetrafluoroethylene; PVC, polyvinyl chloride. |
|---|

|
| a Abbreviations: ABS, acrylonitrile butadiene styrene; PC, polycarbonate; PE, polyethylene; PET, polyethylene terephthalate; PMMA, polymethyl methacrylate; POM, polyoxymethylene; PP, polypropylene; PS, polystyrene; PTFE, polytetrafluoroethylene; PVC, polyvinyl chloride. |
|---|

|
By comparing the results for the 400–4000 cm−1 band and the LWIR band, we can see that the ability to discriminate among plastic species does not deteriorate significantly even if the spectral measurement band is narrowed down to the LWIR band. The results suggest that limiting the spectrum to the MWIR band is not a good approach in terms of plastic species discrimination.
Consequently, the 714–1250 cm−1 (8–14 μm) band, for which there is a comprehensive range of general-purpose and inexpensive microbolometers, will be both advantageous for reducing device costs and discriminating black plastics.
4.3 Comparison of the measurement times
Table 7 shows a comparison of the measurement parameters with FPA-FT-IR and the proposed method. The proposed method could measure the absorbance of a 3.8 mm × 3.0 mm sample (FPA pixel area: 12 μm × 12 μm) in 36 s, including the background measurement time. For the measurements reported by Löder et al. (2015), Tagg et al. (2015), Bergmann et al. (2019), and Liu et al. (2019), the fastest measurement time per unit area was reported by Tagg et al. (2015) at 18.6 s mm−2 (or 32![[thin space (1/6-em)]](https://www.rsc.org/images/entities/char_2009.gif) 400 s/1735 mm2, or 9 h/1735 mm2); although, it should be noted that different conditions were used in each of the four studies.17,18,22–24 By comparison, the measurement time per unit area of our method with the FLIR Boson 320 is 3.1 s mm−2 (or 36 s/11.4 mm2 [3.8 mm × 3.0 mm]). Although the measurement conditions are different, we can say that our method reduced the measurement time to less than 1/6th of that required for FPA-FT-IR.17,18,22–24 We were able to decrease the measurement time by reducing the number of scans through introduction of spectral averaging between pixels, limiting the wavenumber band, and employing a microbolometer that was less sensitive than HgCdTe but had more pixels.
400 s/1735 mm2, or 9 h/1735 mm2); although, it should be noted that different conditions were used in each of the four studies.17,18,22–24 By comparison, the measurement time per unit area of our method with the FLIR Boson 320 is 3.1 s mm−2 (or 36 s/11.4 mm2 [3.8 mm × 3.0 mm]). Although the measurement conditions are different, we can say that our method reduced the measurement time to less than 1/6th of that required for FPA-FT-IR.17,18,22–24 We were able to decrease the measurement time by reducing the number of scans through introduction of spectral averaging between pixels, limiting the wavenumber band, and employing a microbolometer that was less sensitive than HgCdTe but had more pixels.
| Method | FPA pixel area | Number of pixels in the FPA | Area for one measurement | Number of scans | Time for one measurement | Total measurement area | Time for measurement of the total area | Wavenumber range | Wavenumber resolution |
|---|---|---|---|---|---|---|---|---|---|
| a Obtained with 1× magnification. | |||||||||
| FPA-FT-IR17 | 2.7 μm × 2.7 μm | 64 × 64 | 170 μm × 170 μm | 6 | Unclear | 111.1 mm2 (10.54 mm × 10.54 mm) | 10.75 h | 1200–3600 cm−1 | 8 cm−1 |
| FPA-FT-IR18 | 25 μm × 25 μm | 4 × 4 | 100 μm × 100 μm | 1 | Unclear | 1735.0 mm2 (ø 47 mm) | 9 h | 650–4000 cm−1 | 16 cm−1 |
| FPA-FT-IR22,24 | 11 μm × 11 μm | 64 × 64 | 704 μm × 704 μm | 32 | Unclear | 196.0 mm2 (14 mm × 14 mm) | 4 h | 1250–3600 cm−1 | 8 cm−1 |
| FPA-FT-IR23,24 | 5.5 μm × 5.5 μm | 128 × 128 | 704 μm × 704 μm | 30 | Unclear | 100.0 mm2 (ø 10 mm) | 4 h | 900–3750 cm−1 | 8 cm−1 |
| Proposed method (with FLIR Boson 320) | 12 μm × 12 μm | 320 × 256 | 3.8 mm × 3.0 mma | 1 | 36 s | 1735.0 mm2 (ø 47 mm) | 1.5 h | 714–1250 cm−1 | 8 cm−1 |
| Proposed method (with FLIR Boson 640) | 12 μm × 12 μm | 640 × 512 | 7.6 mm × 6.1 mma | 1 | 36 s | 1735.0 mm2 (ø 47 mm) | 0.37 h | 714–1250 cm−1 | 8 cm−1 |
We initially used a FLIR Boson 320 (number of pixels: 320 × 256, pixel area: 12 μm × 12 μm, frame rate: 60 fps) as the FPA. By comparison, a FLIR Boson 640 (number of pixels: 640 × 512, pixel area: 12 μm × 12 μm, frame rate: 60 fps) allowed for measurement of an area of 7.6 mm × 6.1 mm, or four times that with the FLIR Boson 320, within the same measurement time using the same spatial resolution and optical magnification. This reduced the overall measurement time to 1/4th of that with the FLIR Boson 320. For the FLIR Boson 320, changing the optical magnification to 0.5× improved the measurement range to four times that with an optical magnification of 1×; however, this made the minimum area for spectrum acquisition approximately 24 μm × 24 μm. If the optical magnification was set to 0.06×, a sample with a diameter of 47 mm could be measured in a single measurement (measurement time: 36 s), but the minimum area for the spectrum acquisition was approximately 200 μm × 200 μm.
The measurements by Tagg et al. (2015) had a wavenumber resolution of 16 cm−1.18 If it was possible to discriminate MP polymer types in the 714–1250 cm−1 (8–14 μm) band with a wavenumber resolution of 16 cm−1, the measurement time could be halved. Furthermore, if only one background measurement (15 s in our experiment) was sufficient and the computer for spectral calculation was powerful enough to ignore the time required for reading and Fourier transforming the interferogram-recorded images (6 s in our experiment), the time required for absorbance measurements would be almost halved. Therefore, our method still has many elements that could be investigated to decrease the measurement time.
5. Conclusions
Using a microbolometer, we designed a system with a LWIR hyperspectral camera for imaging-type 2D Fourier spectroscopy (105 × 90 × 50 mm, 1.25 kg, 714–1250 cm−1 [8–14 μm] band) that required no cooling system or anti-vibration system. We demonstrated that this system could detect the characteristic absorption peaks of black MPs made from PS, PP, and PE, which are difficult to detect in the SWIR band. An area of 3.8 mm × 3.0 mm (12 μm × 12 μm minimum spectral acquisition area) was measured within 36 s using the proposed method. The measurement time was reduced to less than 1/6th of that required for FPA-FT-IR, which is the current main technique for MP discrimination. Our results show that the 714–1250 cm−1 (8–14 μm) band will be useful for MP discrimination. In the future, we will investigate the measurement of MPs collected using different filters.CRediT authorship contribution statement
Kosuke Nogo: conceptualization, data curation, formal analysis, investigation, methodology, resources, software, validation, visualization, writing – original draft, writing – review & editing. Kou Ikejima: conceptualization, formal analysis, funding acquisition, investigation, methodology, project administration, resources, supervision, writing – review & editing. Wei Qi: resources, validation, writing – review & editing. Natsumi Kawashima: resources, validation, writing – review & editing. Tomoya Kitazaki: resources, validation, writing – review & editing. Satoru Adachi: resources, validation, writing – review & editing. Kenji Wada: resources, supervision, writing – review & editing. Akira Nishiyama: supervision, writing – review & editing. Ichiro Ishimaru: conceptualization, funding acquisition, methodology, project administration, supervision, writing – review & editing.Conflicts of interest
There are no conflicts to declare.Acknowledgements
This work was supported by JSPS KAKENHI (Grant Number JP19H04283). We thank Gabrielle David, PhD, from Edanz Group (https://en-author-services.edanzgroup.com/ac) for editing a draft of this manuscript.References
- A. L. Andrady, Mar. Pollut. Bull., 2011, 62(8), 1596–1605 CrossRef CAS.
- J. A. Ivar do Sul and M. F. Costa, Environ. Pollut., 2014, 185, 352–364 CrossRef CAS.
- L. C. Woodall, A. Sanchez-Vida, M. Canals, G. L. J. Paterson, R. Coppock, V. Sleight, A. Calafat, A. D. Rogers, B. E. Narayanaswamy and R. C. Thompson, R. Soc. Open Sci., 2014, 1(4) DOI:10.1098/rsos.140317.
- G. Erni-Cassola, V. Zadjelovic, M. I. Gibson and J. A. Christie-Oleza, J. Hazard. Mater., 2019, 369, 691–698 CrossRef CAS.
- A. E. Schwarz, T. N. Ligthart, E. Boukris and T. van Harmelen, Mar. Pollut. Bull., 2019, 143, 92–100 CrossRef CAS.
- S. L. Wright, R. C. Thompson and T. S. Galloway, Environ. Pollut., 2013, 178, 483–492 CrossRef CAS.
- L. Carlos de Sá, M. Oliveira, F. Ribeiro, T. L. Rocha and M. N. Futter, Sci. Total Environ., 2018, 645, 1029–1039 CrossRef.
- S. Zhang, J. Wang, X. Liu, F. Qu, X. Wang, X. Wang, Y. Li and Y. Sun, TrAC, Trends Anal. Chem., 2019, 111, 62–72 CrossRef CAS.
- R. C. Thompson, Y. Olsen, R. P. Mitchell, A. Davis, S. J. Rowland, A. W. G. John, D. McGonigle and A. E. Russell, Science, 2004, 304, 838 CrossRef CAS.
- J. C. Prata, J. P. da Costa, A. C. Duart and T. Rocha-Santos, TrAC, Trends Anal. Chem., 2019, 110, 150–159 CrossRef CAS.
- J. Pinto da Costa, V. Reis, A. Paço, M. Costa, A. C. Duarte and T. Rocha-Santos, TrAC, Trends Anal. Chem., 2019, 111, 173–184 CrossRef CAS.
- W. J. Shim, S. H. Hongab and S. E. Eoab, Anal. Methods, 2017, 9, 1384–1391 RSC.
- P. Vermeiren, C. Muñoz and K. Ikejima, Environ. Pollut., 2020, 262 DOI:10.1016/j.envpol.2020.114298.
- E. A. Gies, J. L. LeNoble, M. Noël, A. Etemadifar, F. Bishay, E. R. Hall and P. S. Ross, Mar. Pollut. Bull., 2018, 133, 553–561 CrossRef CAS.
- E. N Lewis, P. J. Treado, R. C. Reeder, G. M. Story, A. E. Dowrey, C. Marcot and I. W. Levin, Anal. Chem., 1995, 67(19), 3377–3381 CrossRef.
- J. P. Harrison, J. J. Ojeda and M. E. Romero-González, Sci. Total Environ., 2012, 416, 455–463 CrossRef CAS.
- M. G. J. Löder, M. Kuczera, S. Mintenig, C. Lorenz and G. Gerdts, Environ. Chem., 2015, 12, 563–581 CrossRef.
- A. S. Tagg, M. Sapp, J. P. Harrison and J. J. Ojeda, Anal. Chem., 2015, 87(12), 6032–6040 CrossRef CAS.
- S. Primpke, C. Lorenz, R. Rascher-Friesenhausenbc and G. Gerdtsa, Anal. Methods, 2017, 9, 1499–1511 RSC.
- S. Primpke, M. Wirth, C. Lorenz and G. Gerdts, Anal. Bioanal. Chem., 2018, 410, 5131–5141 CrossRef CAS.
- I. Peeken, S. Primpke, B. Beyer, J. Gütermann, C. Katlein, T. Krumpen, M. Bergmann, L. Hehemann and G. Gerdts, Nat. Commun., 2018, 9(1) DOI:10.1038/s41467-018-03825-5.
- M. Bergmann, S. Mützel, S. Primpke, M. B. Tekman, J. Trachsel and G. Gerdts, Sci. Adv., 2019, 5(8), eaax1157 CrossRef CAS.
- F. Liu, A. Vianello and J. Vollertsen, Environ. Pollut., 2019, 255(2) DOI:10.1016/j.envpol.2019.113335.
- S. Primpke, S. H. Christiansen, W. Cowger, H. D. Frond, A. Deshpande, M. Fischer, E. B. Holland, M. Meyns, B. A. O'Donnell, B. E. Ossmann, M. Pittroff, G. Sarau, B. M. Scholz-Böttcher and K. J. Wiggin, Appl. Spectrosc., 2020, 74(9), 1012–1047 CrossRef CAS.
- J. B. Bates, Comput. Math. Appl., 1978, 4(2), 73–84 CrossRef.
- A. Rogalski, Prog. Quantum Electron., 2012, 36(2–3), 342–473 CrossRef.
- J. Shan, J. Zhao, Y. Zhang, L. Liu, F. Wu and X. Wang, Anal. Chim. Acta, 2019, 1050, 161–168 CrossRef CAS.
- C. Zhu, Y. Kanaya, R. Nakajima, M. Tsuchiya, H. Nomaki, T. Kitahashi and K. Fujikura, Environ. Pollut., 2020, 263(B) DOI:10.1016/j.envpol.2020.114296.
- S. Serranti, R. Palmieri, G. Bonifazi and A. Cózar, Waste Manage., 2018, 76, 117–125 CrossRef.
- L. K. Schmidt, M. Bochow, H. K. Imhof and S. E. Oswald, Environ. Pollut., 2018, 239, 579–589 CrossRef CAS.
- A. Vázquez-Guardado, M. Money, N. McKinney and D. Chanda, Appl. Opt., 2015, 54, 7396–7405 CrossRef.
- W. Becker, K. Sachsenheimer and M. Klemenz, Polymers, 2017, 9 DOI:10.3390/polym9090435.
- C. Coudrain, S. Bernhardt, M. Caes, R. Domel, Y. Ferrec, R. Gouyon, D. Henry, M. Jacquart, A. Kattnig, P. Perrault, L. Poutier, L. Rousset-Rouvière, M. Tauvy, S. Thétas and J. Primot, Opt. Express, 2015, 23, 16164–16176 CrossRef CAS.
- J. Jia, Y. Wang, J. Chen, R. Guo, R. Shu and J. Wang, Infrared Phys. Technol., 2020, 104 DOI:10.1016/j.infrared.2019.103115.
- N. Yamamoto, T. Saito, S. Ogawa and I. Ishimaru, Proc. SPIE 9840, Algorithms and Technologies for Multispectral, Hyperspectral, and Ultraspectral Imagery XXII, 2016, p. 984028 Search PubMed.
- H. Kobayashi, T. Kawajiri, K. Yanogawa, A. Nishiyama, N. Tanaka, S. Takahashi and I. Ishimaru, Jpn. J. Opt., 2012, 41(1), 36–44 Search PubMed , https://annex.jsap.or.jp/photonics/kogaku/public/41-01-kenkyuronbun.pdf..
- W. Qi, Y. Suzuki, S. Sato, M. Fujiwara, N. Kawashima, S. Suzuki, P. Abeygunawardhana, K. Wada, A. Nishiyama and I. Ishimaru, Appl. Opt., 2015, 54, 6254–6259 CrossRef.
- A. Inui, R. Tsutsumi, W. Qi, T. Takuma, H. Kagiyama, D. Kojima and I. Ishimaru, Phys. Procedia, 2011, 19, 61–66 CrossRef.
- J. W. Verhoeven, Pure Appl. Chem., 1996, 68(12), 2223–2286 CAS.
- J. Fahrenfort, Spectrochim. Acta, 1961, 17(7), 698–709 CrossRef CAS.
Footnote |
| † Electronic supplementary information (ESI) available. See DOI: 10.1039/d0ay01738h |
| This journal is © The Royal Society of Chemistry 2021 |

