
 Open Access Article
 This Open Access Article is licensed under a Creative Commons Attribution-Non Commercial 3.0 Unported Licence
Evaluation of table-top lasers for routine infrared ion spectroscopy in the analytical laboratory
Rianne E.
van Outersterp
 a,
Jonathan
Martens
a,
André
Peremans
b,
Laurent
Lamard
c,
Filip
Cuyckens
d,
Jos
Oomens
ae and
Giel
Berden
*a
a,
Jonathan
Martens
a,
André
Peremans
b,
Laurent
Lamard
c,
Filip
Cuyckens
d,
Jos
Oomens
ae and
Giel
Berden
*a
aRadboud University, Institute for Molecules and Materials, FELIX Laboratory, Toernooiveld 7, 6525 ED Nijmegen, The Netherlands. E-mail: g.berden@science.ru.nl; Tel: +31 243653951
bLaboratoire Physique de la Matière et du Rayonnement (P.M.R), Université de Namur, 5000 Namur, Belgium
cLaserSpec, 15 Rue Trieux-Scieurs, 5020 Namur, Belgium
dDrug Metabolism & Pharmacokinetics, Janssen R&D, Beerse, Belgium
eVan ‘t Hoff Institute for Molecular Sciences, University of Amsterdam, P.O. Box 94157, 1090 GD Amsterdam, The Netherlands
First published on 20th October 2021
Abstract
Infrared ion spectroscopy is increasingly recognized as a method to identify mass spectrometry-detected analytes in many (bio)chemical areas and its integration in analytical laboratories is now on the horizon. Commercially available quadrupole ion trap mass spectrometers are attractive ion spectroscopy platforms but operate at relatively high pressures. This promotes collisional deactivation which directly interferes with the multiple-photon excitation process required for ion spectroscopy. To overcome this, infrared lasers having a high instantaneous power are required and therefore a majority of analytical studies have been performed at infrared free electron laser facilities. Proliferation of the technique to routine use in analytical laboratories requires table-top infrared lasers and optical parametric oscillators (OPOs) are the most suitable candidates, offering both relatively high intensities and reasonable spectral tuning ranges. Here, we explore the potential of a range of commercially available high-power OPOs for ion spectroscopy, comparing systems with repetition rates of 10 Hz, 20 kHz, 80 MHz and a continuous-wave (cw) system. We compare the performance for various molecular ions and show that the kHz and MHz repetition-rate systems outperform cw and 10 Hz systems in photodissociation efficiency and offer several advantages in terms of cost-effectiveness and practical implementation in an analytical laboratory not specialized in laser spectroscopy.
Introduction
With the advent of widely and continuously tunable infrared (IR) laser sources, infrared ion spectroscopy (IRIS) has become an invaluable tool in structural mass spectrometry (MS). IRIS comes in two main forms either based on one-photon dissociation of weakly-bound, low-temperature stabilized complexes of the analyte1–9 or based on infrared multiple-photon dissociation (IRMPD) of the analyte itself.10–16 IRMPD spectroscopy has as its main advantage that it can be implemented on commercial MS platforms, making it directly compatible with any MS-based method in a chemical laboratory. In IRMPD spectroscopy, absorption of multiple IR photons at vibrational resonances induces dissociation, which is detected in an MS spectrum collected after irradiation. Monitoring the extent of IR-induced fragmentation as a function of wavelength yields a surrogate IR spectrum of the mass-isolated ions.Using the MS-instrument as detector for IR absorption, IRIS has a much higher sensitivity and (mass)-selectivity than conventional absorption spectroscopy approaches and is therefore increasingly recognized as a valuable tool in analytical chemistry.1,14,17–22 Mass spectrometry is a go-to method in many biochemical laboratories but its main bottleneck is an accurate identification of detected molecular features, as there are often many isobaric candidate structures that are difficult to distinguish on the basis of MS alone.23–25 Being a natural extension of MS, IRIS provides structural information – in the form of IR spectra – for MS-detected ions. Consequently, IRIS has found recent application in a range of biochemical areas such as drug metabolism,26,27 clinical chemistry,28–30 forensics31–34 and environmental sciences.35,36
IRIS is typically performed in an ion storage MS instrument so that the irradiation time can be adjusted to optimize the photofragmentation yield. Instruments of choice are Fourier transform ion cyclotron resonance (FTICR) mass spectrometers12,37–43 or linear and 3D quadrupole ion traps.41,42,44–52 Both home-built37,38,40,45,50,51 and commercial instruments39,41–44,46–49,52 modified for optical access to the stored ions have been used, where the latter offer the advantage of higher sensitivity, which is often required to probe the low-abundance ions encountered in biomedical samples. Extensive MSn-capabilities offer the possibility to record IR spectra for MS/MS fragment ions and to perform two-color IR2MS3 experiments, which may aid the identification of unknown features.18,29,34,53 Quadrupole ion traps do not reach the mass-resolution offered by FTICR mass spectrometers, but are more cost effective and faster.
Quadrupole ion traps normally operate at relatively high pressures (>10−5 mbar) since a helium buffer gas is used to thermalize the ions and to collisionally quench the ion cloud to the center of the trap. At these pressures, collisional cooling of the ions directly competes with the IR multiple-photon excitation process,44,54–57 where absorption of 10–100 IR photons is required to reach the dissociation threshold and induce fragmentation. To achieve a photon absorption rate that can overcome collisional deactivation, lasers with a high instantaneous power (short laser pulses with high peak power) are used. Additionally, lowering the buffer gas pressure in the ion trap can enhance dissociation yields,44,55–57 especially when probing ions with high dissociation thresholds.44,58 This may come at the expense of a reduced trapping efficiency and lower sensitivity.
Many recent analytical IRIS experiments have been performed using infrared free electron lasers (FELs).14,19,26–29,31,33–36,53 FELs offer a wide tuning range in the mid-IR range in combination with short pulses, a high peak power, and high average power, and are therefore ideal light sources for a wide range of applications. However, FELs are large scale facilities based on electron accelerators and therefore very costly and not commercially available, which limits their potential for widespread use in analytical laboratories. To date, optical parametric oscillators (OPOs) are the best table-top alternatives, providing radiation in the 3 μm wavelength range at pulse energies that have been shown to be sufficient for IRMPD on various ion storage MS platforms.42,44,46–49 The 3 μm range (2500–4000 cm−1) provides access to hydrogen stretching vibrations (CH, NH, OH) and several studies have successfully employed this wavelength range for small molecule identification.5,20,21,27,48,59,60
Most commercial OPOs provide a lower (time-averaged) power than FELs. In order to still overcome collisional cooling in ion traps, virtually all table-top IRMPD set-ups currently use 10 Hz pulsed OPOs with 5 ns pulses having energies in the range of 10–30 mJ, i.e. systems with the highest available instantaneous power. Here, we aim to explore the potential of several other commercially available OPOs that offer alternative balances between laser properties (peak power, average power, pulse duration and repetition rate). More specifically, we evaluate the performance of a 10 Hz, 20 kHz, 80 MHz and a continuous-wave (cw) OPO system for IRIS in a commercial quadrupole ion trap, with the goal of determining which system offers the optimal balance between IRMPD efficiency, routine operation, robustness and overall performance, in particular for application in the setting of analytical laboratories that often do not specialize in laser spectroscopy.
Experimental section
Infrared ion spectroscopy
IRIS measurements were performed on a 3D quadrupole ion trap mass spectrometer (Bruker AmaZon speed ETD) with optical access to the trapped ion population.44 The ion trap was operated in positive or negative electrospray ionization (ESI) MS mode and the sample solution (∼1 μM in 50![[thin space (1/6-em)]](https://www.rsc.org/images/entities/char_2009.gif) :50 methanol:water) was infused at a 180 μL h−1 flow rate. In the ion trapping region, mass-to-charge (m/z) selected ions were irradiated by a wavelength-tunable infrared laser to induce wavelength-dependent IRMPD.14,61 Details on laser properties, irradiation times, triggering and synchronization are given below. IR spectra of m/z-selected ions are obtained by plotting the IRMPD yield as a function of IR frequency. The IRMPD yield is defined as the ratio of the sum of all fragment ions over the sum of all ions (fragments + precursor) and was obtained from 6 averaged mass spectra for each IR wavelength. The IR frequency was calibrated by recording the IR spectrum of protonated tryptophan (Trp, m/z 205) using the strongest vibrational band at 3555 cm−1.62 Additionally, precursor ion depletion curves were obtained by recording the normalized precursor ion intensity (1 – IRMPD yield) as a function of irradiation time using an automated protocol described in ref. 34.
:50 methanol:water) was infused at a 180 μL h−1 flow rate. In the ion trapping region, mass-to-charge (m/z) selected ions were irradiated by a wavelength-tunable infrared laser to induce wavelength-dependent IRMPD.14,61 Details on laser properties, irradiation times, triggering and synchronization are given below. IR spectra of m/z-selected ions are obtained by plotting the IRMPD yield as a function of IR frequency. The IRMPD yield is defined as the ratio of the sum of all fragment ions over the sum of all ions (fragments + precursor) and was obtained from 6 averaged mass spectra for each IR wavelength. The IR frequency was calibrated by recording the IR spectrum of protonated tryptophan (Trp, m/z 205) using the strongest vibrational band at 3555 cm−1.62 Additionally, precursor ion depletion curves were obtained by recording the normalized precursor ion intensity (1 – IRMPD yield) as a function of irradiation time using an automated protocol described in ref. 34.
The ion trap employs a helium buffer gas for efficient trapping of ions. The He pressure can be adjusted as a percentile setting of the gas controller, here indicated as GCHe. The standard setting for the instrument used here (calibrated for optimal ion signal) is 60% which gives a pressure of ∼10−3 mbar in the trap. Lowering the GCHe to a value of 5–15% decreases the pressure to ∼10−5 mbar, while a value of 0% (no helium) gives a pressure of ∼10−6 mbar. IR spectra have been recorded at different settings of the gas controller in order to observe the effect of buffer gas pressure on the IRMPD efficiency.
Table-top infrared lasers
Four table-top infrared lasers have been used to obtain the data reported here. The major difference between the systems is the pulse repetition rate of the lasers. We therefore label them as follows: 10 Hz system, 20 kHz system, 80 MHz system and continuous-wave (cw) system. An overview of selected laser specifications is provided in Table 1.| OPO system | 10 Hz | 20 kHz | 80 MHz | CW |
|---|---|---|---|---|
| Repetition rate (Hz) | 10 | 2 × 10⁴ | 8 × 10⁷ | ∞ |
| Average power (mW) | 150 | 600 | 450 | 1350 or 5400 |
| Pulse energy (J) | 1.5 × 10⁻² | 3 × 10⁻⁵ | 5.6 × 10⁻⁹ | — |
| Pulse duration (ns) | 6 | 10 | 35 × 10−3 | — |
| Peak power (W) | 2.5 × 10⁶ | 3 × 10³ | 1.6 × 10² | 1.35 or 5.4 |
To perform IRIS, the trapped ions are irradiated with one or more lasers pulses, which is achieved by a mechanical shutter (Thorlabs Optical Shutter SH05) triggered by the quadrupole ion trap.44 Precise synchronization of the laser pulses with respect to the MS sequence is required to ensure that the ions are irradiated with the same number of laser pulses in each MS cycle. This is achieved by triggering the MS sequence with a TTL pulse from the laser.44 Communication between laser and mass spectrometer is provided by a LabView program that also stores the IR frequency value into the Bruker MS data file.44
The Nd:YAG pump laser head and the OPO are physically connected to each other, so that there is no free space for the pump laser beam between the two systems. The dimensions of the system are 960 (length) × 130 (width) × 140 (height) mm excluding the power supply of the Nd:YAG laser. The OPO output beam is focused with a CaF2 lens into the center of the ion trap through a CaF2 window (diameter 25 mm, clear aperture 16 mm) and a 3 mm hole in the ring electrode. The position of the lens is optimized to achieve maximum IR-induced fragmentation of protonated Trp.
The procedures for IRIS measurements are similar to those described for the 10 Hz system and involve a mechanical shutter and a CaF2 focusing lens optimized for maximum photodissociation. However, the high repetition rate of 20 kHz mitigates the need for precise synchronization between the OPO laser and the MS sequence, so that external triggering of the mass spectrometer is no longer required. The trapped ions are irradiated for a time interval that is continuously variable in duration (rather than for a number of pulses); intervals of 20 to 1000 ms were used here. An irradiation time of 100 ms corresponds to 2000 IR laser pulses, while for the 10 Hz system 100 ms corresponds to only a single laser pulse. Note that we report irradiation times as the values sent to the mechanical shutter. Actual irradiation times are slightly longer (+5 ms) as a result of the response time of the shutter following the TTL driving pulse. In addition, with a driving pulse of 10 ms, the minimal opening time of the shutter is 27 ms; for shorter driving pulses, the shutter remains closed. The laser and mass spectrometer communicate with each other via a LabView program that also stores the IR frequency values in the Bruker MS data file.44
The procedures for IRIS measurements are similar to those described for the 20 kHz system, although the focusing optics have been adapted for the 80 MHz system. Note that 100 ms of irradiation with the 80 MHz system corresponds to an exposure of the ions to 8 million pulses.
Due to the high cw laser power, the mechanical shutter cannot be used. Instead, a ‘fast rotating mirror’ (galvanometer scanner) is used to direct the infrared laser beam towards either the parking position (a power meter) or the quadrupole ion trap. This ‘optical shutter’ is much faster than the mechanical shutter and is also triggered by the mass spectrometer. Since the laser is cw, no synchronization between the laser and MS sequence is needed. Finally, note that we have not used this cw laser system for recording IR spectra since the translation of the PPLN crystal is not motorized. The laser frequency was manually tuned to a vibrational band of the ion of interest.
Results and discussion
The quality of the measured IR spectra strongly depends on the IRMPD yield, which is directly determined by the competition between the rates of IR photoexcitation and collisional deactivation. Hence, the yield is affected by several instrumental and molecular parameters including the absorption cross-section, helium pressure in the ion trap, power and pulse characteristics of the IR radiation, and the dissociation threshold of the ion. Therefore, to evaluate the performance of the OPO systems for IRIS in ion trap mass spectrometers, we performed several experiments varying these parameters systematically.Comparison of OPO systems for IRMPD on protonated Trp
Protonated tryptophan ([Trp + H]+, m/z 205) is frequently used to study the performance of IRMPD spectroscopy in quadrupole ion traps.44,49,62 In the 3300–3600 cm−1 region, its IR spectrum contains a strong carboxylic acid OH stretching mode at 3555 cm−1, a strong indole NH stretching mode at 3500 cm−1 and a weaker mode related to the NH3+ moiety at 3340 cm−1. Here, we recorded IR spectra of the [Trp + H]+ ion with the 10 Hz, 20 kHz and 80 MHz OPO systems using an irradiation time of 200 ms, which corresponds to only two laser pulses for the 10 Hz system, 4000 for the 20 kHz and 16 million pulses for the 80 MHz system. The black traces in panels a–c of Fig. 1 show the IR spectra recorded with the helium buffer gas pressure optimized for maximum ion trapping efficiency. The three spectra are qualitatively identical. For the strongest absorption band (OH stretch, 3555 cm−1), the ion population is completely depleted by the 20 kHz and 80 MHz lasers systems (yield equal to 1), whereas a yield of only 0.86 is reached using the 10 Hz system. This suggests that the yield reached at strong absorption bands of systems with a modest dissociation threshold is mainly determined by the average power rather than by the peak power (see laser parameters in Table 1). In contrast, for the weaker absorption bands at 3500 cm−1 and 3340 cm−1, the dissociation yield reached by the 10 Hz laser is comparable or even slightly higher than that of the other laser systems. This can be attributed to the high peak power of the 10 Hz system, which facilitates the threshold to be reached within one 6 ns pulse, thus outcompeting collisional de-excitation. | ||
| Fig. 1 Comparison of OPO systems for IRMPD on protonated tryptophan (Trp, m/z 205, see inlay in panel d). IRMPD spectra recorded with the (a) 10 Hz OPO system, (b) 20 kHz OPO system and (c) 80 MHz OPO system using standard pressures (GCHe = 60%, black traces) and reduced pressures (GCHe = 5% or 15%, green and red traces) in the ion trap. (d) Precursor ion depletion as a function of irradiation time recorded using the three pulsed OPO laser systems and the cw-OPO system (using a power of 1.35 W and 5.4 W) tuned to the 3553 cm−1 resonance. Panel (e) shows an alternative representation of the same data, where the vertical axis shows the IRMPD intensity (see text). | ||
To further explore the effect of peak and average laser power on the IR dissociation yield, we recorded the normalized precursor ion intensity as a function of irradiation time with the frequency of the three pulsed OPO lasers tuned to the OH stretch mode. The results are displayed in Fig. 1d together with previously recorded data for the cw OPO system operating at two different powers.44 For the 10 Hz system, irradiation with a single laser pulse corresponds to 6 ns of irradiation time (the duration of the laser pulse), for which the mechanical shutter has to open for less than 100 ms. For clarity, and in order to be able to understand the precursor depletion curve, we plot the corresponding data point in Fig. 1d at 100 ms, although it should be realized that the irradiation time for recording an IR spectrum with a single pulse could be set much shorter. The first three data points clearly show that with each IR laser pulse, approximately 2/3 of the ions dissociates, giving a logarithmic dependence for precursor ion depletion, which is indeed as expected and which has also been observed for IRMPD with other radiation sources.40,61,63,64
The two high repetition rate lasers and the cw-laser operated at 5.4 W show very similar precursor ion depletion curves; the time needed to reach full dissociation is <100 ms. In contrast, the 10 Hz system needs a much longer irradiation time of about 350 ms. IRMPD using the 1.35 W cw-laser – a higher average power than that of all pulsed OPO systems used here – drastically reduces the dissociation efficiency; the time needed to reach complete precursor ion depletion increases to >1000 ms. Collisional cooling by the helium buffer gas is now strongly competing with IR excitation, leading to a considerably lower IRMPD yield for the same irradiation time.
The IR dissociation yield as defined here has a value between 0 (no dissociation) and 1 (100% dissociation). For comparison with calculated IR spectra and with precursor depletion spectra, the parameter S = −ln(1 − yield) is more appropriate as it links directly to the photodissociation rate and therefore should scale linearly with the irradiation time.61,65,66 Note that S is identical to −ln(Ip), where Ip is the normalized precursor ion intensity. Fig. 1e displays S as a function of irradiation time, which clearly shows that for all laser systems the dependence is indeed linear up to an IR yield of 0.98 (S = 4).
The quadrupole ion trap employs a helium buffer gas pressure in the 10−3 mbar range for efficient trapping of ions. The rate of collisional cooling is directly proportional to the He pressure and therefore strongly affects the IRMPD efficiency. We explored this by recording an IR spectrum of [Trp + H]+ at reduced pressure in the ion trap using each of the pulsed OPOs (data for the cw OPO are available in ref. 44). We express the pressure as a percentile setting of the gas controller GCHe. Fig. 1a–c compares the spectrum recorded at reduced pressures to that recorded at a standard pressure (GCHe = 60%) for each system. For the 10 Hz system, reducing the pressure to a very low value of 5% does not significantly increase the dissociation yield, because the very high peak power of a single pulse ensures that the IR excitation rate is higher than the collisional de-excitation rate at both He pressure settings. For the 20 kHz and 80 MHz systems, a reduction of the pressure to 15% leads to considerably higher IRMPD yields. This indicates that the absorption of photons from multiple pulses is needed for dissociation due to the lower peak power, but that the high repetition rate of these lasers ensures that photon absorption still outcompetes collisional deactivation. Assuming that the ion population in the trap is thermalized, we estimate an average collision time on the order of 0.1–1.0 ms at 10−3 mbar. With a pulse interval of 50 μs, the 20 kHz OPO can outcompete collisional deactivation if an ion absorbs a photon from approximately every tenth laser pulse. Using the values in Table 1 and a laser focus of 0.1–1.0 mm2, the photon absorption rate is indeed on the order of the collision rate (taking the absorption rate as the product of absorption cross section and photon flux, kabs = σ·ϕ). Reducing the He pressure then directly influences the competition. A similar rationalization holds for the 80 MHz system, where the slightly lower average power as compared to the 20 kHz system (see Table 1) may explain the more pronounced IRMPD enhancement upon He pressure reduction seen in Fig. 1.
Comparison of OPO systems for IRMPD on deprotonated para-coumaric acid
Deprotonated para-coumaric acid ([PCA-H]−, m/z 163) was previously shown to adopt a phenolate rather than carboxylate structure (see Fig. 2) upon ESI, corresponding to the lowest energy structure in the gas phase.67 This ion is more difficult to photodissociate than protonated Trp such that collisional deactivation competes more strongly with IRMPD, which may cause vibrational bands to become entirely unobservable. In a previous study using the same type of ion trap mass spectrometer, a 10 Hz OPO (15 mJ per pulse) was unable to induce dissociation at the OH stretch band of [PCA-H]− (3590 cm−1) when using standard operating pressures of the ion trap.44 Even upon reducing the helium pressure to its minimum (GCHe = 0%), IR dissociation yields were never above 0.1. | ||
| Fig. 2 Comparison of OPO lasers for IRMPD on deprotonated para-coumaric acid (PCA, m/z 163). IRMPD spectra recorded with the (a) 10 Hz OPO system, (b) 20 kHz OPO system and (c) 80 MHz OPO system using reduced helium pressure (GCHe = 20%, black traces) and without helium (GCHe = 0%, red traces) in the ion trap. The ions were irradiated for 1 s (corresponding to 10 IR pulses for the 10 Hz system). | ||
Here, we record IR spectra of deprotonated PCA in the same wavelength region to test the performance of the 10 Hz, 20 kHz and 80 MHz OPO systems for this ion. Fig. 2 shows IR spectra recorded using either no helium in the trap (GCHe = 0%, red traces) or a small amount of helium (GCHe = 20%, black traces). Ions were irradiated with 10 IR pulses of the 10 Hz laser (panel a) or for 1000 ms with the 20 kHz and 80 MHz lasers (panel b and c). Observations are analogous to what was found for the weak absorption band of protonated Trp. At the higher pressure settings, only a small amount of dissociation is observed independent of the laser system employed. The 10 Hz system appears to give slightly higher dissociation yields than the other systems, which is in line with its higher peak power and therefore its ability to dissociate the ion within one 6 ns pulse, although only with low yield. Reducing the helium to zero hardly improves the dissociation yield for this laser: in the 100 ms time interval between pulses, complete collisional deactivation occurs. The pressure reduction has no influence on the excitation process within one 6 ns high peak-power pulse, since the absorption rate is orders of magnitude higher than the deactivation rate at either of the He pressures. The dissociation yield reached (<0.1) is the roughly the same for both He settings and comparable to what was achieved previously.44
For the higher repetition rate systems on the other hand, a drastic increase of the dissociation yield is observed when reducing the buffer gas pressure, indicating that the deactivation rate is significantly reduced relative to the photon absorption rate. The 80 MHz laser (35 ps pulses with 12.5 ns intervals) shows a significantly better performance than the 20 kHz laser (10 ns pulses with 50 μs interval). We note that lowering the helium setting to 0% significantly reduces sensitivity of the mass spectrometer. For studies aiming to analyze low-abundance compounds, these operating conditions may therefore not be feasible.
Comparison of the 20 kHz and 80 MHz OPO systems for IRMPD on the sodium adduct of N-acetylglucosamine
The results shown above for Trp and PCA indicate that lowering the pressure in the ion trap enhances the dissociation yield when using kHz and MHz repetition-rate laser systems. To explore this effect further, we recorded IR spectra of the sodium adduct of N-acetylglucosamine ([GlcNAc + Na]+, m/z 244, see Fig. 3) using the 20 kHz and 80 MHz system and four different buffer gas pressures in the ion trap (GCHe = 60%, 45%, 30% and 15%). A previous study from our group focused on the differentiation of GlcNAc from two isomeric molecules and reported the IR spectrum of [GlcNAc + Na]+ in the fingerprint region obtained with a FEL. Recording IR spectra in the 3 μm range with a 10 Hz OPO (<15 mJ per pulse) did not produce a sufficiently high dissociation yield to confidently differentiate the three systems.17Fig. 3 shows the IR spectra recorded here using the 20 kHz (panel a) and 80 MHz (panel b) OPO systems. At the standard helium pressure (GCHe = 60%), it is seen that both lasers generate only a very low dissociation yield and only on a single vibrational band. Reducing the helium setting to 15%, however, gives a spectrum containing four clearly observable vibrational bands corresponding to the OH- and NH-stretching vibrations. The 20 kHz systems shows a better performance for this ion in the sense that all four bands are already observed at GCHe = 30%, whereas for the 80 MHz system a reduction to 15% is required. This indicates that for this Na+-adduct, the higher average power and/or peak powers of the 20 kHz system are favorable.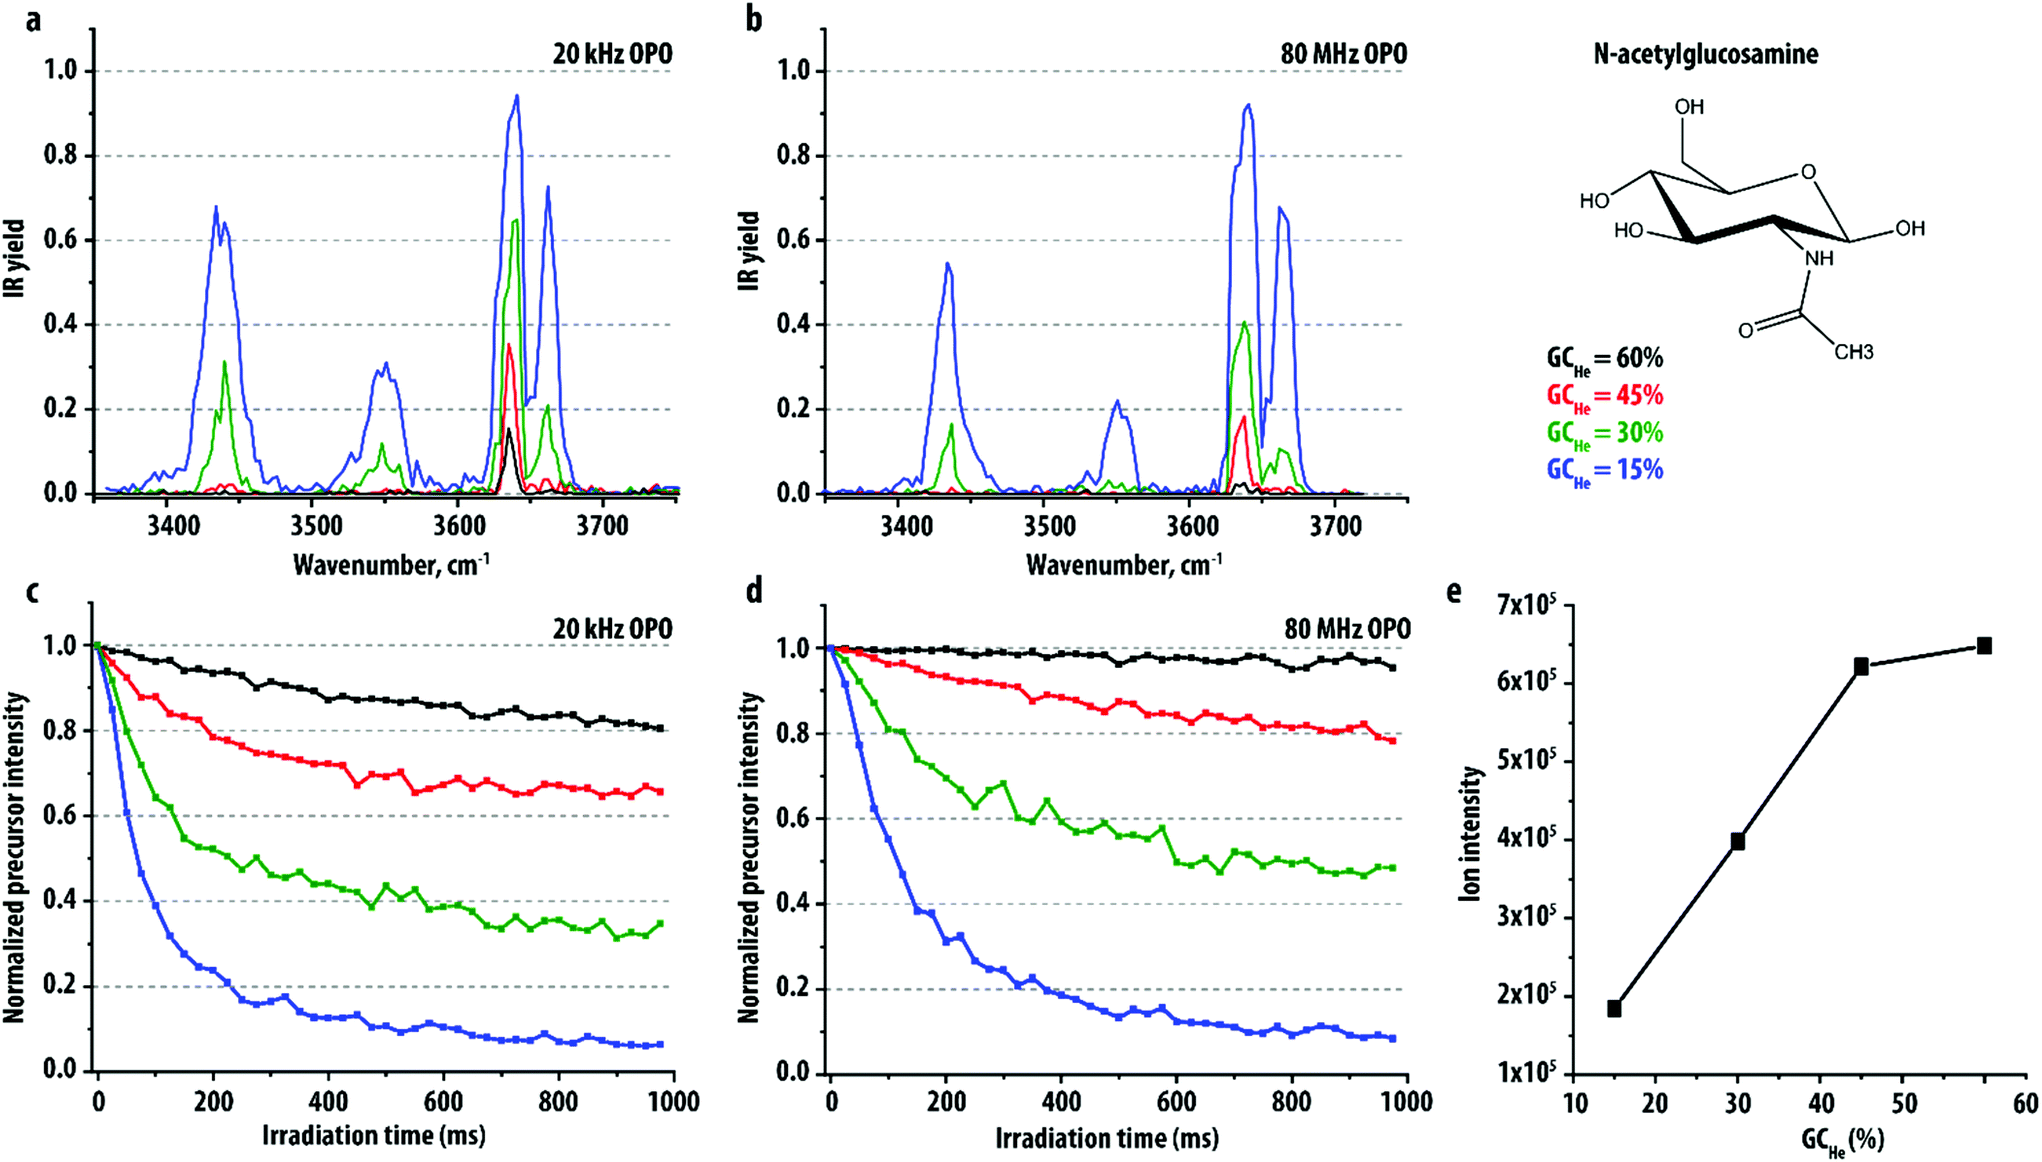 | ||
| Fig. 3 Comparison of the 20 kHz and 80 MHz OPO systems for IRMPD on the sodium adduct of N-acetylglucosamine ([GlcNAc + Na]+, m/z 244, shown at the top right). IRMPD spectra (a and b) and recorded with the (a) 20 kHz OPO system and (b) 80 MHz OPO system and an irradiation time of 600 ms. Normalized precursor intensity (1-IR yield) as a function of irradiation time recorded with the (c) 20 kHz OPO system and (d) 80 MHz OPO system at 3637 cm−1. The spectra and depletion curves in panel (a–d) were recorded using a range of pressures (GCHe = 60%; black traces, GCHe = 45%; red traces, GCHe = 30%; green traces and GCHe = 15%; blue traces) in the ion trap. (e) Number of m/z 244 ions detected in the ion trap as a function of the pressure in the ion trap. | ||
We further explored the competition between vibrational excitation and collisional de-excitation by recording the normalized precursor ion intensity as a function of irradiation time with the laser frequency tuned to the most intense absorption band (3637 cm−1) for each of the pressure settings. Fig. 3c and d show the resulting depletion curves for the 20 kHz and 80 MHz systems. In general, all curves are steeper for the 20 kHz OPO, reaching higher dissociation yields in a shorter irradiation time. Moreover, comparing the depletion curves at the 60% buffer gas setting shows a clear threshold effect for the 80 MHz laser, i.e., even at an irradiation time of 1000 ms, only a minor fraction of the ions undergoes fragmentation. Clearly, the collisional deactivation rate at this helium pressure is higher than the photon absorption rate and increasing the irradiation time does not increase the fragmentation yield.
Note that some of the depletion curves shown in Fig. 3c and d appear not to follow a single exponential decay. This can be caused by several effects. First of all, the normalized precursor intensity (precursor ions divided by all ions) is plotted on the vertical axis in order to have a decent signal to noise ratio. The disadvantage, however, is that this may lead to an overestimation of the number of undissociated precursor ions when there are fragment ions below the low-mass cut-off (LMCO) of the ion trap that are not detected.61 For example, [GlcNAc + Na]+ dissociation likely generates some Na+ at m/z 23, which is below the LMCO. Furthermore, even if fragment ions have an m/z above the LMCO, their trapping efficiency may be reduced at lower pressures. Comparison of the depletion curves in Fig. 3 with those obtained by normalizing on the total number of ions observed without laser irradiation suggests that 10–30% of the fragment ions are not detected for the GCHe = 30% trace recorded with the 20 kHz laser (not shown). In addition, multiple conformations may be present, each with its own IR absorption rate, giving rise to a multi-exponential depletion curve.68
Since the helium buffer gas is employed to enhance the trapping efficiency, operating at a reduced pressure generally leads to a lower sensitivity of the mass spectrometer. This may limit the application of high repetition-rate OPOs in ion spectroscopy on low-abundance compounds in complex (bio)chemical samples. To determine the extent of this effect, we recorded the number of (mass-isolated) [GlcNAc + Na]+ ions as a function of the gas pressure setting. Here, the settings of the ion trap allowed for the ion accumulation time to vary in order to optimize the absolute number of trapped ions (ion charge control). Fig. 3e shows the number of ions normalized for the length of the accumulation time. The number of ions decreases only slightly when lowering the pressure setting to 45% and then drops more rapidly to about 30% at the lowest pressure setting. Simultaneously, the ion accumulation time increases from ∼15 ms at the 60% setting to ∼55 ms at the lowest pressure setting. Hence, lowering the pressure is efficiently compensated for by the accumulation time, so that it has a limited effect on the sensitivity on our MS platform.
IRMPD on CID fragment ions of protonated Trp at reduced ion trap pressures
The IR spectra of fragment ions generated from an unknown by collision-induced dissociation (CID) can often significantly aid in molecular structure identification of precursor ions in a bottom-up approach. Fragment ions are often more stable than their precursors and the recording of their IR spectra can thus be facilitated by lowering the pressure in the ion trap. However, lowering the pressure can have a negative effect on the operation of the ion trap and may reduce the efficiency of generating and trapping CID fragments. Here we focus on the fragmentation of protonated Trp (m/z 205), which has been extensively studied using IRIS by Mino et al.62 The molecular structures of the precursor and fragment ions that were determined in their study are displayed in Fig. 4. NH3-loss yields a fragment with m/z 188 and another round of fragmentation yields m/z 146, via the loss of CH2CO. We recorded IR spectra using the 20 kHz OPO system of the precursor ion, the MS2 fragment ion at m/z 188 and the MS3 fragment ion at m/z 146 at four different buffer gas pressures: GCHe = 60%, 45%, 30% and 15%, see Fig. 4. As was determined before, the IR spectra of the fragment ions contain two absorption bands that are attributed to the indole NH stretching mode, which is red-shifted compared to the precursor ion, and the OH-stretching mode, which is blue-shifted in the m/z 146 ion as it now corresponds to an alcohol OH rather than a carboxylic acid OH. In the fragment ion spectra, it is seen that lowering the pressure significantly enhances the IRMPD efficiency, leading to complete saturation of both bands at the lowest pressure level. At the same time, the quality of the IR spectra remains roughly unchanged, so that we conclude that lowering the pressure is a viable option, even when investigating CID fragment ions.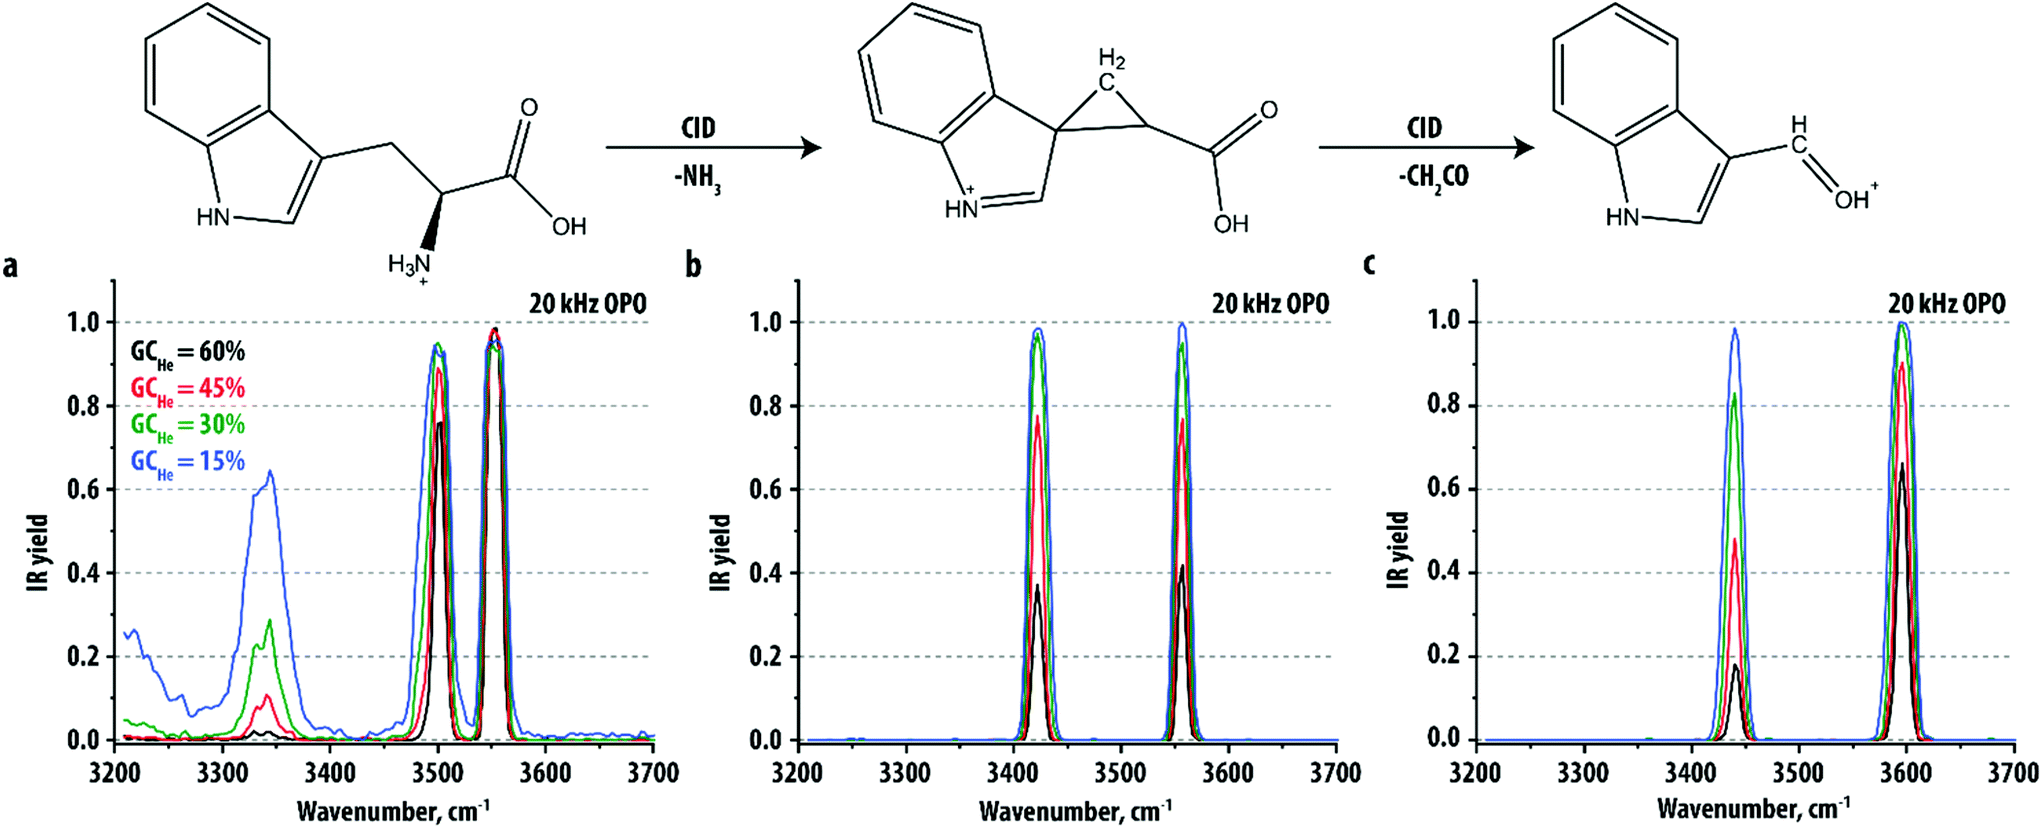 | ||
| Fig. 4 Comparison of IRMPD on fragment ions of protonated tryptophan ([Trp + H]+, m/z 205) generated with collision induced dissociation (CID) at normal and reduced pressures in the ion trap. IRMPD spectra of (a) protonated tryptophan ([Trp + H]+, m/z 205) and fragment ions produced via (b) NH3 loss, (m/z 188, [Trp + H − NH3]+), and (c) subsequent CH2CO loss, (m/z 146, [Trp + H − NH3 − CH2CO]+) recorded with the 20 kHz OPO system using a range of pressures (GCHe = 60%; black traces, GCHe = 45%; red traces, GCHe = 30%; green traces and GCHe = 15%; blue traces) in the ion trap. The ions were irradiated for 200 ms at each wavelength. | ||
Molecular identification with the 20 kHz OPO system
Apart from having a different pulse structure and power, the OPO systems also operate in a wavelength region that is different from that of most FELs used for IRMPD spectroscopy, which is generally the IR fingerprint region from 500 to 2000 cm−1. To demonstrate the use of the high repetition rate OPOs in small-molecule identification, we recorded IR spectra of three isobaric ions using the 20 kHz OPO system. Fig. 5 shows the IR spectrum of the sodium adduct of N-acetylglucosamine, [GlcNAc + Na]+ at m/z 244, discussed also above, compared with IR spectra of the sodium adducts of N-acetylmannosamine ([ManNAc + Na]+, m/z 244) and N-acetylgalactosamine ([GalNAc + Na]+, m/z 244). Recently, ManNAc was identified as a biomarker for the disease NANS-deficiency using untargeted liquid chromatography-mass spectrometry.69 In this study, it was necessary to use NMR spectroscopy to identify the biomarker elevated in patient samples as ManNAc and not GlcNAc and GalNAc, which have the same exact mass and CID MS/MS fragmentation patterns. Later, we showed that the three sugar molecules can also be distinguished based on the IRMPD spectra of their sodium adducts in the 5–15 μm wavelength region.17 The spectral comparison in Fig. 5 shows that the three ions can also be readily distinguished using the table-top 20 kHz OPO system. The three spectra show similar bands resulting from the presence of the same functional groups, but small variations in peak position and band intensity enables their differentiation. | ||
| Fig. 5 Molecular identification using the 20 kHz OPO laser and a reduced pressure (GCHe = 15%). Comparison of IRMPD spectra of the sodium adducts of N-acetylglucosamine, N-acetylmannosamine and N-acetylgalactosamine, which are isomeric. | ||
IRMPD yield at reduced laser power
Of course, laser power is also an important factor determining the IRMPD efficiency, but it was only briefly discussed in the previous sections. We tested lowering the cw-OPO power from 5.4 W to 1.35 W and found that it reduces the IRMPD efficiency drastically (Fig. 1d). This is also true for high repetition rate lasers, which is illustrated in Fig. 6 for the 20 kHz OPO. Here, part of the IR spectrum of the sodium adduct of N-acetylglucosamine has been remeasured with full power (600 mW), 75% (450 mW) and 50% of the power (300 mW) at two helium pressure settings, which shows clearly that laser power is a major factor in selecting an OPO system. | ||
| Fig. 6 Influence of laser power on IRMPD efficiency with the 20 kHz OPO. Comparison of IRMPD spectra of the sodium adduct of N-acetylglucosamine recorded with a power of 600 mW (100% of the maximum, black traces), 450 mW (75% of the maximum, red traces) and 300 mW (50% of the maximum, green traces) and 600 ms irradiation time using (a) standard pressures (GCHe = 60%) and (b) reduced pressures (GCHe = 30%) in the ion trap. | ||
Conclusion and outlook
Helium buffer gas is used to enhance the ion trapping efficiency in many ion trap MS systems and is required to reach ultra-high sensitivities and to act as a collision partner in CID experiments. On the other hand, the buffer gas directly competes with the IRMPD process as collisions remove energy from ions during IR multiple-photon excitation, lowering the IRMPD efficiency or even preventing dissociation entirely. The competition between photoexcitation and collisional deactivation depends on several parameters, including the absorption cross-section and dissociation threshold of the ion, the helium pressure in the ion trap and the power and pulse characteristics of the IR laser radiation.For IRMPD, the most important laser parameters are pulse duration, pulse energy and repetition rate. The highest yields are expected for lasers with high peak powers, so short pulses with high pulse energy. A high repetition rate is favorable, as a shorter time between laser pulses reduces the energy loss due to collisions with the buffer gas. Affordable OPOs currently on the market have in common that their time-averaged power is in the range of a few hundred mW to a few W. Therefore, OPOs that combine a high peak power (for instance a pulse energy of 15 mJ per pulse) with a high repetition rate (for instance 80 MHz) do not exist. The choice of the laser system for IRMPD spectroscopic studies will therefore always involve a trade-off between favorable properties.
In this study, we have tested two commercially available high repetition-rate OPOs for IRIS in a quadrupole ion trap mass spectrometer and compared their performance with more common 10 Hz laser systems and with a high-power cw-OPO, which corresponds to the limit of an “infinite” repetition rate. The effects of an ion's absorption cross section and dissociation threshold were explored by studying several molecular systems having different absorption cross sections and dissociation thresholds. The spectra were recorded with various helium pressures in the ion trap to assess the competition between collisional cooling and IR heating.
The results obtained for each OPO laser system can be summarized as follows:
1. The 10 Hz OPO system (150 mW average power, 6 ns pulse duration) performs well in combination with the standard helium setting of the quadrupole ion trap. Lowering the helium pressure only provides a small increase in IRMPD efficiency as the time between pulses (100 ms) is much longer than the collision time regardless of the setting of the buffer gas pressure. The extremely high peak power during a laser pulse ensures that the photoexcitation rate is much higher than the collisional de-excitation rate during the pulse for all pressure settings. The low repetition rate of the pulses requires precise temporal synchronization of laser and mass spectrometer, which involves external triggering of the mass spectrometer. Although IRMPD with a single pulse (6 ns) is feasible for ions with low dissociation thresholds, multiple pulses are often needed to obtain a decent fractional fragmentation, which quickly increases the irradiation time (Fig. 1d) and hence the time needed to record an IR spectrum. OPOs with similar specifications and pulse energies up to 25 mJ per pulse are available from various vendors.
2. The 20 kHz OPO system (600 mW average power, 10 ns pulse duration) performs similarly to the 10 Hz system at standard helium pressure settings. A drastic increase in IR dissociation yield is obtained when the helium pressure is reduced. Modest pressure reductions already significantly increase the dissociation yield. At this high repetition rate, no synchronization of the laser pulses with respect to the MS sequence is needed. An interesting aspect of this type of laser system is that affordable models are available with powers up to 2 W.
3. The performance of the 80 MHz OPO system (450 mW average power, 35 ps pulse duration) is similar to the 20 kHz system. At very low helium pressures (GCHe < 20%) the 80 MHz OPO gives slightly higher dissociation yields, while at higher pressures the 20 kHz system performs better. Again no temporal synchronization with the MS is required. Affordable 80 MHz lasers are available with powers up to 1 W.
4. The cw OPO system operating at a power of 5.4 W provides the highest IR dissociation yields for protonated tryptophan at standard pressure (Fig. 1d) and at reduced pressure.44 Reduction of the power to 1.35 W, which is still 2–9 times higher compared to the average power of the three pulsed lasers, decreases the IR yield drastically, which makes common 1 W cw OPO systems less attractive for IRIS in ion traps. High power cw OPOs are quite costly compared to the pulsed OPO systems.
Overall, we conclude that kHz and MHz repetition rate OPO systems are a viable alternative to 10 Hz systems for use in table-top (analytical) IRIS set-ups employing commercial ion trap mass spectrometers. The lasers tested in this study have a conservative average output power, demonstrating that even with modest power (and funding) good quality IR spectra can be obtained in the 3 μm spectral range for a wide range of compounds. Especially for high-repetition rate systems, lowering the buffer gas pressure can significantly enhance dissociation yields, while only mildly affecting the sensitivity of the MS platform. We demonstrate how recording IR spectra using OPO systems can aid in the identification of ions detected in an analytical mass spectrometry experiment. Here, we focused on examples in the field of biomarker identification, but we envision the use of table-top IRIS set-ups in a range of analytical fields such as forensics, environmental science and glycomics.
Author contributions
Rianne E. van Outersterp: Investigation, visualization, writing – original draft. Jonathan Martens: Investigation, writing – review & editing. André Peremans: Resources. Laurent Lamard: Resources. Filip Cuyckens: Writing – review. Jos Oomens: Writing – review & editing. Giel Berden: Conceptualization, investigation, writing – original draft.Conflicts of interest
A. Peremans is founder of LaserSpec.Acknowledgements
The authors gratefully acknowledge Guus Tielemans for his excellent help and assistance in software development and the Nederlandse Organisatie voor Wetenschappelijk Onderzoek (NWO) for the support of the FELIX Laboratory. This work was supported by NWO division Exact and Natural Sciences (grant numbers VICI 724.011.002, TTW 15769, TKI-LIFT 731.017.419, Rekentijd 2019.062).References
- A. P. Cismesia, L. S. Bailey, M. R. Bell, L. F. Tesler and N. C. Polfer, J. Am. Soc. Mass Spectrom., 2016, 27, 757–766 CrossRef CAS PubMed.
- A. B. Wolk, C. M. Leavitt, E. Garand and M. A. Johnson, Acc. Chem. Res., 2014, 47, 202–210 CrossRef CAS PubMed.
- O. V. Boyarkin, S. R. Mercier, A. Kamariotis and T. R. Rizzo, J. Am. Chem. Soc., 2006, 128, 2816–2817 CrossRef CAS PubMed.
- J. Jašík, J. Žabka, J. Roithová and D. Gerlich, Int. J. Mass Spectrom., 2013, 354–355, 204–210 CrossRef.
- O. Gorlova, S. M. Colvin, A. Brathwaite, F. S. Menges, S. M. Craig, S. J. Miller and M. A. Johnson, J. Am. Soc. Mass Spectrom., 2017, 28, 2414–2422 CrossRef CAS PubMed.
- I. Dyukova, E. Carrascosa, R. P. Pellegrinelli and T. R. Rizzo, Anal. Chem., 2020, 92, 1658–1662 CrossRef PubMed.
- M. Lettow, M. Grabarics, K. Greis, E. Mucha, D. A. Thomas, P. Chopra, G.-J. Boons, R. Karlsson, J. E. Turnbull, G. Meijer, R. L. Miller, G. von Helden and K. Pagel, Anal. Chem., 2020, 92, 10228–10232 CrossRef CAS PubMed.
- M. Pahl, M. Mayer, M. Schneider, D. Belder and K. R. Asmis, Anal. Chem., 2019, 91, 3199–3203 CrossRef CAS PubMed.
- K. Hirata, Y. Mori, S.-i. Ishiuchi, M. Fujii and A. Zehnacker, Phys. Chem. Chem. Phys., 2020, 22, 24887–24894 RSC.
- N. C. Polfer and J. Oomens, Mass Spectrom. Rev., 2009, 28, 468–494 CrossRef CAS PubMed.
- J. R. Eyler, Mass Spectrom. Rev., 2009, 28, 448–467 CrossRef CAS PubMed.
- T. D. Fridgen, Mass Spectrom. Rev., 2009, 28, 586–607 CrossRef CAS PubMed.
- L. MacAleese and P. Maître, Mass Spectrom. Rev., 2007, 26, 583–605 CrossRef CAS PubMed.
- J. Martens, R. E. van Outersterp, R. J. Vreeken, F. Cuyckens, K. L. M. Coene, U. F. Engelke, L. A. J. Kluijtmans, R. A. Wevers, L. M. C. Buydens, B. Redlich, G. Berden and J. Oomens, Anal. Chim. Acta, 2020, 1093, 1–15 CrossRef CAS PubMed.
- P. Maitre, D. Scuderi, D. Corinti, B. Chiavarino, M. E. Crestoni and S. Fornarini, Chem. Rev., 2020, 120, 3261–3295 CrossRef CAS PubMed.
- L. Jašíková and J. Roithová, Chem. – Eur. J., 2018, 24, 3374–3390 CrossRef PubMed.
- J. Martens, G. Berden, R. E. van Outersterp, L. A. J. Kluijtmans, U. F. Engelke, C. D. M. van Karnebeek, R. A. Wevers and J. Oomens, Sci. Rep., 2017, 7, 3363 CrossRef PubMed.
- R. E. van Outersterp, K. J. Houthuijs, G. Berden, U. F. Engelke, L. A. J. Kluijtmans, R. A. Wevers, K. L. M. Coene, J. Oomens and J. Martens, Int. J. Mass Spectrom., 2019, 443, 77–85 CrossRef CAS.
- J. Martens, G. Berden, H. Bentlage, K. L. M. Coene, U. F. Engelke, D. Wishart, M. van Scherpenzeel, L. A. J. Kluijtmans, R. A. Wevers and J. Oomens, J. Inherited Metab. Dis., 2018, 41, 367–377 CrossRef CAS PubMed.
- A. P. Cismesia, M. R. Bell, L. F. Tesler, M. Alves and N. C. Polfer, Analyst, 2018, 143, 1615–1623 RSC.
- B. Schindler, G. Laloy-Borgna, L. Barnes, A.-R. Allouche, E. Bouju, V. Dugas, C. Demesmay and I. Compagnon, Anal. Chem., 2018, 90, 11741–11745 CrossRef CAS PubMed.
- B. Schindler, L. Barnes, G. Renois, C. Gray, S. Chambert, S. Fort, S. Flitsch, C. Loison, A.-R. Allouche and I. Compagnon, Nat. Commun., 2017, 8, 973 CrossRef PubMed.
- L. Cui, H. Lu and Y. H. Lee, Mass Spectrom. Rev., 2018, 37, 772–792 CrossRef CAS PubMed.
- W. B. Dunn, A. Erban, R. J. M. Weber, D. J. Creek, M. Brown, R. Breitling, T. Hankemeier, R. Goodacre, S. Neumann, J. Kopka and M. R. Viant, Metabolomics, 2013, 9, 44–66 CrossRef CAS.
- S. Heiles, Anal. Bioanal. Chem., 2021, 413, 5927–5948 CrossRef CAS PubMed.
- R. E. van Outersterp, J. Martens, G. Berden, V. Koppen, F. Cuyckens and J. Oomens, Analyst, 2020, 145, 6162–6170 RSC.
- J. Martens, V. Koppen, G. Berden, F. Cuyckens and J. Oomens, Anal. Chem., 2017, 89, 4359–4362 CrossRef CAS PubMed.
- O. Lagatie, A. Verheyen, S. Van Asten, M. R. Odiere, Y. Djuardi, B. Levecke, J. Vlaminck, Z. Mekonnen, D. Dana, R. T'Kindt, K. Sandra, R. van Outersterp, J. Oomens, R. Lin, L. Dillen, R. Vreeken, F. Cuyckens and L. J. Stuyver, Sci. Rep., 2020, 10, 15780 CrossRef CAS PubMed.
- R. E. van Outersterp, S. J. Moons, U. F. H. Engelke, H. Bentlage, T. M. A. Peters, A. van Rooij, M. C. D. G. Huigen, S. de Boer, E. van der Heeft, L. A. J. Kluijtmans, C. D. M. van Karnebeek, R. A. Wevers, G. Berden, J. Oomens, T. J. Boltje, K. L. M. Coene and J. Martens, Commun. Biol., 2021, 4, 367 CrossRef CAS PubMed.
- U. F. H. Engelke, R. E. van Outersterp, J. Merx, F. A. M. G. van Geenen, A. van Rooij, G. Berden, M. C. D. G. Huigen, L. A. J. Kluijtmans, T. M. A. Peters, H. H. Al-Shekaili, B. R. Leavitt, E. de Vrieze, S. Broekman, E. van Wijk, L. A. Tseng, P. Kulkarni, F. P. J. T. Rutjes, J. Mecinović, E. A. Struys, L. A. Jansen, S. M. Gospe Jr., S. Mercimek-Andrews, K. Hyland, M. A. A. P. Willemsen, L. A. Bok, C. D. M. van Karnebeek, R. A. Wevers, T. J. Boltje, J. Oomens, J. Martens and K. L. M. Coene, J. Clin. Invest., 2021, 131(15), e148272 CrossRef CAS PubMed.
- R. F. Kranenburg, F. A. M. G. van Geenen, G. Berden, J. Oomens, J. Martens and A. C. van Asten, Anal. Chem., 2020, 92, 7282–7288 CrossRef CAS PubMed.
- M. R. Bell, L. F. Tesler and N. C. Polfer, Int. J. Mass Spectrom., 2019, 443, 101–108 CrossRef CAS.
- J. Tyler Davidson, E. L. Piacentino, Z. J. Sasiene, Y. Abiedalla, J. DeRuiter, C. R. Clark, G. Berden, J. Oomens, V. Ryzhov and G. P. Jackson, Forensic Chem., 2020, 19, 100245 CrossRef CAS.
- F. A. M. G. van Geenen, R. F. Kranenburg, A. C. van Asten, J. Martens, J. Oomens and G. Berden, Anal. Chem., 2021, 93, 2687–2693 CrossRef CAS PubMed.
- E. Q. Walhout, S. E. Dorn, J. Martens, G. Berden, J. Oomens, P. H. Y. Cheong, J. H. Kroll and R. E. O'Brien, Environ. Sci. Technol., 2019, 53, 7604–7612 CrossRef CAS PubMed.
- L. Vo, E. Legaard, C. Thrasher, A. Jaffe, G. Berden, J. Martens, J. Oomens and R. E. O'Brien, ACS Earth Space Chem., 2021, 5, 910–919 CrossRef CAS.
- J. J. Valle, J. R. Eyler, J. Oomens, D. T. Moore, A. F. G. van der Meer, G. von Helden, G. Meijer, C. L. Hendrickson, A. G. Marshall and G. T. Blakney, Rev. Sci. Instrum., 2005, 76, 023103 CrossRef.
- G. Mauclaire, J. Lemaire, P. Boissel, G. Bellec and M. Heninger, Eur. J. Mass Spectrom., 2004, 10, 155–162 CrossRef CAS PubMed.
- J. M. Bakker, T. Besson, J. Lemaire, D. Scuderi and P. Maître, J. Phys. Chem. A, 2007, 111, 13415–13424 CrossRef CAS PubMed.
- M. F. Bush, J. T. O'Brien, J. S. Prell, R. J. Saykally and E. R. Williams, J. Am. Chem. Soc., 2007, 129, 1612–1622 CrossRef CAS PubMed.
- L. M. Aleese, A. Simon, T. B. McMahon, J.-M. Ortega, D. Scuderi, J. Lemaire and P. Maître, Int. J. Mass Spectrom., 2006, 249–250, 14–20 CrossRef.
- P. Maitre, J. Lemaire and D. Scuderi, Phys. Scr., 2008, 78, 058111 CrossRef.
- K. Zhang, Y. Shi, M. Du, Y. Xu, Y. Wang and X. Kong, Anal. Chem., 2021, 93, 9056–9063 CrossRef CAS PubMed.
- J. Martens, G. Berden, C. R. Gebhardt and J. Oomens, Rev. Sci. Instrum., 2016, 87, 103108 CrossRef PubMed.
- J. Oomens, A. J. A. van Roij, G. Meijer and G. von Helden, Astrophys. J., 2000, 542, 404–410 CrossRef CAS.
- R. K. Sinha, P. Maître, S. Piccirillo, B. Chiavarino, M. E. Crestoni and S. Fornarini, Phys. Chem. Chem. Phys., 2010, 12, 9794–9800 RSC.
- Y. Nosenko, F. Menges, C. Riehn and G. Niedner-Schatteburg, Phys. Chem. Chem. Phys., 2013, 15, 8171–8178 RSC.
- B. Schindler, J. Joshi, A.-R. Allouche, D. Simon, S. Chambert, V. Brites, M.-P. Gaigeot and I. Compagnon, Phys. Chem. Chem. Phys., 2014, 16, 22131–22138 RSC.
- L. A. Hamlow, Y. Zhu, Z. J. Devereaux, N. A. Cunningham, G. Berden, J. Oomens and M. T. Rodgers, J. Am. Soc. Mass Spectrom., 2018, 29, 2125–2137 CrossRef CAS PubMed.
- S. Warnke, J. Seo, J. Boschmans, F. Sobott, J. H. Scrivens, C. Bleiholder, M. T. Bowers, S. Gewinner, W. Schöllkopf, K. Pagel and G. von Helden, J. Am. Chem. Soc., 2015, 137, 4236–4242 CrossRef CAS PubMed.
- K. R. Asmis, M. Brümmer, C. Kaposta, G. Santambrogio, G. von Helden, G. Meijer, K. Rademann and L. Wöste, Phys. Chem. Chem. Phys., 2002, 4, 1101–1104 RSC.
- T. C. Penna, G. Cervi, A. F. Rodrigues-Oliveira, B. D. Yamada, R. Z. C. Lima, J. J. Menegon, E. L. Bastos and T. C. Correra, Rapid Commun. Mass Spectrom., 2020, 34, e8635 CrossRef CAS PubMed.
- R. E. van Outersterp, U. F. H. Engelke, J. Merx, G. Berden, M. Paul, T. Thomulka, A. Berkessel, M. C. D. G. Huigen, L. A. Kluijtmans, J. Mecinović, F. P. J. T. Rutjes, C. D. M. van Karnebeek, R. A. Wevers, T. J. Boltje, K. L. M. Coene, J. Martens and J. Oomens, Anal. Chem., 2021 DOI:10.26434/chemrxiv.14315579.v1.
- D. M. Black, A. H. Payne and G. L. Glish, J. Am. Soc. Mass Spectrom., 2006, 17, 932–938 CrossRef CAS PubMed.
- A. Colorado, J. X. Shen, V. H. Vartanian and J. Brodbelt, Anal. Chem., 1996, 68, 4033–4043 CrossRef CAS PubMed.
- S. M. Boué, J. L. Stephenson Jr. and R. A. Yost, Rapid Commun. Mass Spectrom., 2000, 14, 1391–1397 CrossRef.
- Y. Hashimoto, H. Hasegawa and I. Waki, Rapid Commun. Mass Spectrom., 2004, 18, 2255–2259 CrossRef CAS PubMed.
- J. Palotás, J. Martens, G. Berden and J. Oomens, Nat. Astron., 2020, 4, 240–245 CrossRef.
- Y. Tan, N. Zhao, J. Liu, P. Li, C. N. Stedwell, L. Yu and N. C. Polfer, J. Am. Soc. Mass Spectrom., 2017, 28, 539–550 CrossRef CAS PubMed.
- D. Corinti, A. Maccelli, M. E. Crestoni, S. Cesa, D. Quaglio, B. Botta, C. Ingallina, L. Mannina, A. Tintaru, B. Chiavarino and S. Fornarini, Int. J. Mass Spectrom., 2019, 444, 116179 CrossRef CAS.
- G. Berden, M. Derksen, K. J. Houthuijs, J. Martens and J. Oomens, Int. J. Mass Spectrom., 2019, 443, 1–8 CrossRef CAS.
- W. K. Mino, K. Gulyuz, D. Wang, C. N. Stedwell and N. C. Polfer, J. Phys. Chem. Lett., 2011, 2, 299–304 CrossRef CAS.
- J. Lemaire, P. Boissel, M. Heninger, G. Mauclaire, G. Bellec, H. Mestdagh, A. Simon, S. L. Caer, J. M. Ortega, F. Glotin and P. Maitre, Phys. Rev. Lett., 2002, 89, 273002 CrossRef CAS PubMed.
- T. Gäumann, J. M. Riveros and Z. Zhu, Helv. Chim. Acta, 1990, 73, 1215–1218 CrossRef.
- B. Lucas, G. Grégoire, J. Lemaire, P. Maître, F. Glotin, J. P. Schermann and C. Desfrançois, Int. J. Mass Spectrom., 2005, 243, 105–113 CrossRef CAS.
- J. S. Prell, J. T. O'Brien and E. R. Williams, J. Am. Soc. Mass Spectrom., 2010, 21, 800–809 CrossRef CAS PubMed.
- M. Almasian, J. Grzetic, J. van Maurik, J. D. Steill, G. Berden, S. Ingemann, W. J. Buma and J. Oomens, J. Phys. Chem. Lett., 2012, 3, 2259–2263 CrossRef CAS PubMed.
- J. S. Prell, T. M. Chang, J. A. Biles, G. Berden, J. Oomens and E. R. Williams, J. Phys. Chem. A, 2011, 115, 2745–2751 CrossRef CAS PubMed.
- C. D. M. van Karnebeek, L. Bonafé, X.-Y. Wen, M. Tarailo-Graovac, S. Balzano, B. Royer-Bertrand, A. Ashikov, L. Garavelli, I. Mammi, L. Turolla, C. Breen, D. Donnai, V. Cormier-Daire, D. Heron, G. Nishimura, S. Uchikawa, B. Campos-Xavier, A. Rossi, T. Hennet, K. Brand-Arzamendi, J. Rozmus, K. Harshman, B. J. Stevenson, E. Girardi, G. Superti-Furga, T. Dewan, A. Collingridge, J. Halparin, C. J. Ross, M. I. Van Allen, A. Rossi, U. F. Engelke, L. A. J. Kluijtmans, E. van der Heeft, H. Renkema, A. de Brouwer, K. Huijben, F. Zijlstra, T. Heise, T. Boltje, W. W. Wasserman, C. Rivolta, S. Unger, D. J. Lefeber, R. A. Wevers and A. Superti-Furga, Nat. Genet., 2016, 48, 777–784 CrossRef CAS PubMed.
| This journal is © The Royal Society of Chemistry 2021 |