
 Open Access Article
 This Open Access Article is licensed under a Creative Commons Attribution-Non Commercial 3.0 Unported Licence
A study of the application of graphite MALDI to the analysis of lanthanides and deconvolution of the isobaric species observed†
Ulric
Conway‡
a,
Alexander D.
Warren
ab and
Paul J.
Gates
 *a
*a
aSchool of Chemistry, University of Bristol, Cantock's Close, Bristol, BS8 1TS, UK. E-mail: paul.gates@bristol.ac.uk
bInterface Analysis Centre, School of Physics, University of Bristol, Tyndall Avenue, Bristol, BS8 1TL, UK
First published on 8th September 2021
Abstract
Matrix-assisted laser desorption/ionisation mass spectrometry has always suffered from matrix interference at low-masses making it an unsuitable method for the analysis of low molecular weight analytes. In recent years, there has been considerable interest in the use of graphite as a matrix. In this study, we demonstrate the application of colloidal graphite for the analysis of lanthanides in the positive ion mode. Positive ion mode is of academic interest as spectra are dominated by lanthanide cations, oxides, hydroxides and carbides with the metal having been reduced to oxidation state I, II or III. The ratios of the different ions are considered in terms of redox potentials of the lanthanides and rates of reaction with oxygen. Positive ion mode is shown to be useful as a rapid technique for confirming which metal(s) are present in a sample which can have an application in environmental monitoring, for example. Demonstration of a least squares approach to deconvolution is applied for the complete separation and relative quantification of the different isobaric species observed due to the complex isotope distributions of some lanthanides.
Introduction
The mass spectrometric (MS) analysis of lanthanides (Ln) is very much a niche area, with few studies in the literature. However, the increasing interest in the use of lanthanides in medicine and as proxies in nuclear forensics1 places new demands for the development of reliable methodologies for their analysis. Many MS based protocols for the analysis of heavy metals make use of inductively coupled plasma-mass spectrometry (ICP-MS),2 however this technique suffers from high capital costs and lack of availability in general chemistry laboratories.3 However, matrix-assisted laser desorption/ionisation mass spectrometry (MALDI-MS) is a far cheaper and widely available technique.One of the first notable studies of heavy metal species by MALDI-MS was conducted by Dopke et al. in 1998.4 Here, MALDI-MS was investigated as a method of characterising metal atom clusters, specifically those based on the rhenium(III) halides. This study ignited many further investigations of transition metal clusters, including more recently in 2007 where Guan et al. used MALDI to characterise titanium oxide nanoparticles.5 In 2004, Corpillo et al. analysed lanthanide complexes in cell lysate using MALDI-MS. This study tested for the presence of gadolinium complexes used as contrast agents in magnetic resonance imaging.6 They were able to see the intact complexes and peaks for the free ligands although salt adduction did complicate the spectra. A study by Kerton et al. in 2009 dealt with the analysis of samarium, gadolinium, holmium and ytterbium amide complexes by MALDI-MS using an anthracene matrix.7 In this study the intact complexes were observed, but there were serious issues with low-mass noise from the matrix and salts present in the samples. In recent years, further studies have demonstrated the successful application of MALDI-MS analysis to lanthanide complexes including dendrimers8 and pyridylcarbohydrazones.9 These studies also suffered from issues relating to matrix overcrowding of the low-mass region and excessive salt adduction and clustering to both the matrix and analyte. The drive to improve the methods for the analysis of small molecules by MALDI-MS has driven the search for new/novel matrices and matrix preparation methods which result in little matrix or matrix related signals in the low-mass region of the resulting spectra. The main aim of this is to achieve suppression of the matrix by the analyte and is discussed in detail by Knochenmuss et al.10
The use of graphite as a matrix has been in continuous development over the last 25 years, by several research groups including this lab.11,12 For example, in 1995 Sunner et al. developed a technique they termed as SALDI, where graphite was used to activate a surface for conducting MALDI-MS analysis. In 2006, Langley et al. demonstrated the effective use of a pencil lead graphite matrix in the analysis of uranium metal salts13 and gadolinium nitrate.14 As a result, graphite-MALDI is becoming established as a go to technique for the analysis of low molecular analytes – i.e. those with molecular weights less than 1000 Da.15 Following on from the previous highly successful studies of colloidal graphite (CG) as a matrix for the analysis of low molecular weight organic species and low-mass polymers,15,16 a study was instigated to investigate the use of CG as a matrix for the analysis of lanthanide metal salts and determine its effectiveness when compared to traditional organic matrices. CG was deposited either by pipette or by using a previously published airbrush application method.17
Although lanthanide chemistry is a fairly specialist field, there are a number of emerging applications in areas such as proteomics,18 organometallic and co-ordination chemistry,19 superconducting materials20 and in nuclear medicine.21 Lanthanide salts are readily available and easily handled (apart from promethium which is radioactive) and as such are good candidates as proxies for other more toxic heavy metals as well as for the actinides (many of which are radioactive).1 Despite the importance and diversity of these emerging areas of lanthanide chemistry, MALDI-MS analysis of smaller lanthanide compounds, such as salts, are much less common in the literature. In this study, we demonstrate the application of colloidal graphite (CG), a carbon-based matrix, to the analysis of lanthanides. Despite graphite's early successes as a matrix for the analysis of uranium and gadolinium,13,14 it has not been systematically tested before. In this study, we analyse a full set of commercially available high purity lanthanide(III) nitrates (commercial ICP standards – see ESI Table S1†) by MALDI-MS and make use of in-house developed scripts to deconvolute isobaric species in order to aid the identification of the chemistry taking place during ionisation.
Experimental
Instrumentation
All MALDI-MS analyses were performed on a 4700 Proteomics Analyzer (Applied Biosystems, Warrington, UK). This is a reflectron time-of-flight/time-of-flight (TOF/TOF) mass analyser, used in reflectron mode. All spectra were recorded at 1000 shots per spectrum (comprised of 8 sub-spectra, over a 5 seconds run) at a resolution of approximately 25![[thin space (1/6-em)]](https://www.rsc.org/images/entities/char_2009.gif) 000 FWHM. The laser used was a 200 Hz Nd:YAG at a wavelength of 355 nm with a beam diameter is 50 μm, a pulse energy of 12 μJ and pulse length of less than 500 ps. External calibration (better than 5 ppm) was achieved using the 4700 Proteomics Analyzer Calibration Mixture (Applied Biosystems, Warrington, UK). Data collection was fully randomised. Features or trends which appeared in the majority of the resulting spectra where then reported.
000 FWHM. The laser used was a 200 Hz Nd:YAG at a wavelength of 355 nm with a beam diameter is 50 μm, a pulse energy of 12 μJ and pulse length of less than 500 ps. External calibration (better than 5 ppm) was achieved using the 4700 Proteomics Analyzer Calibration Mixture (Applied Biosystems, Warrington, UK). Data collection was fully randomised. Features or trends which appeared in the majority of the resulting spectra where then reported.
Airbrush deposition of the matrix was achieved using an Aztek/Testors A470 (Rockford, Illinois, USA) airbrush in the single action mode. A Revell ‘Master Class’ airbrush compressor (Elk Grove Village, Illinois, USA) was used to provide a pressure of 35 psi using a needle size of 0.7 mm. The methodology of using the airbrush followed that previously published by us.17
Ten spots were deposited for each analyte/matrix combination and twenty sub spectra were obtained and averaged to produce a single spectrum per spot. This process was then repeated twice. A summary of the experimental parameters is presented in the ESI Table S2.†
Matrices and chemicals
Colloidal graphite (CG) was obtained as an aerosol suspended in ethanol from The Graphite Trading Company (Halesowen, UK). All solvents were HPLC gradient grade purchased from Fisher Scientific (Loughborough, UK). The CG matrix solution was prepared by spraying the graphite aerosol can into a vial until approximately 1 mL of fluid collected at the bottom. The solution was then made up by adding 7 mL of water. The solution was thoroughly shaken before each use.The lanthanides were obtained as ICP standards at a concentration of 1000 mg mL−1 in 2% HNO3 aqueous solution (see Table S1 in the ESI† for more details). The lanthanides were diluted to a concentration of 0.125 mg mL−1 in water and either mixed 1:1 with the matrix solution and 1 μl of the mixture pipetted onto the target plate, or 1 μl pipetted on top of the airbrushed matrix.
Results and discussion
Lanthanides have a strong preference for oxidation state III. Their atomic and ionic radii both decrease across the lanthanide period, a trend known as the lanthanide contraction. These two effects exert considerable influence on their chemistries. As shown in the initial analysis in Fig. 1, terbium and ytterbium underwent redox processes during the ionisation in positive mode to generate intense ions for the Ln+ cation. Analysis of the whole lanthanide period was performed, and their spectra are contained in the ESI Fig. S1.† During this analysis, there were a number of additional peaks observed due to a range of species, namely, LnO+, LnOH+ and LnC2+. Fig. 1 shows replotted data (with any non-lanthanide ions removed) of the Ln+ region for the analyses of Tb and Yb nitrates.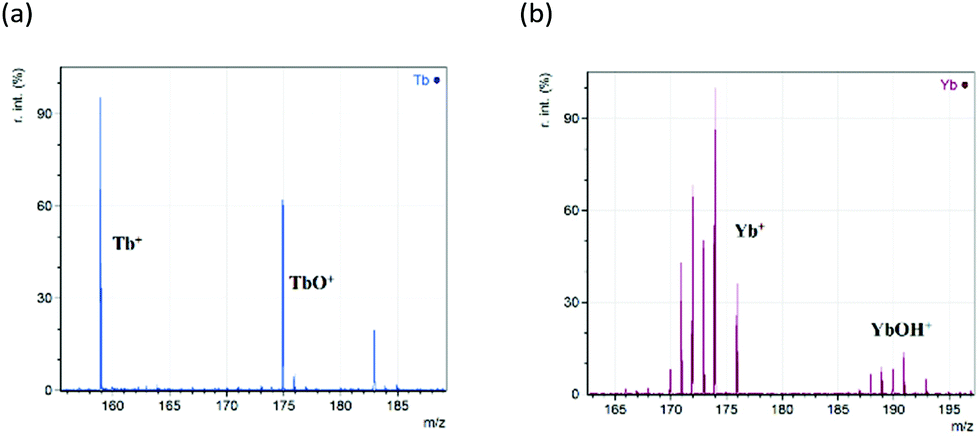 | ||
| Fig. 1 Replotted spectra from the positive ion CG-MALDI-MS analysis of (a) terbium(III) nitrate (Tb(NO3)3) and (b) ytterbium(III) nitrate (Yb(NO3)3) focussing on the main analyte peaks observed. Peaks of interest are labelled. | ||
Here it is clear that reduction to the bare metal cation (Ln+) is occurring, along with generation of intense peaks due to the oxide (LnO+) and hydroxide (LnOH+). Other peaks observed are due to the dicarbide (LnC2+) and the metallacyclopropene cation (LnC2H2+)22,23 occurring at 24 and 26 mass units above the bare metal ion respectively. The LnOH+ ion was only detected for samarium, europium, thulium and ytterbium. The occurrence of LnC2H2+ was unpredictable, with abundances typically only a few percent of the base peak and it is not considered further. All the peaks observed will be studied in more detail later. Before that we need to deal with the issues of isotopic distributions overlapping, and possibly even obscuring ions, through the process of deconvolution.
The presence of isobaric interference is a significant problem when dealing with the MS analysis of the lanthanide elements. This is primarily due to many of them having a wide isotopic distribution which can overlap other species if they are similar in mass or isobaric. For example, LnO+ and LnOH+ only differ by 1 mass unit. It is therefore difficult to separate the individual species in order to deduce their relative abundance. A good example is given in Fig. 2 where the difficulty of separating the individual ions relating to samarium is particularly challenging. The isotope pattern for Sm (7 intense isotopes over a 10 m/z range) can clearly be seen from the bare metal ion and it would be expected that the monoxide ion should show the same isotopic pattern at 16 m/z higher. However, the pattern has been distorted by the presence of other isobaric species. For example, 150SmO+ and 149SmOH+ are isobaric at m/z 166 with a mass difference of only 0.007 and require a high-resolution instrument to be separated in the mass domain.
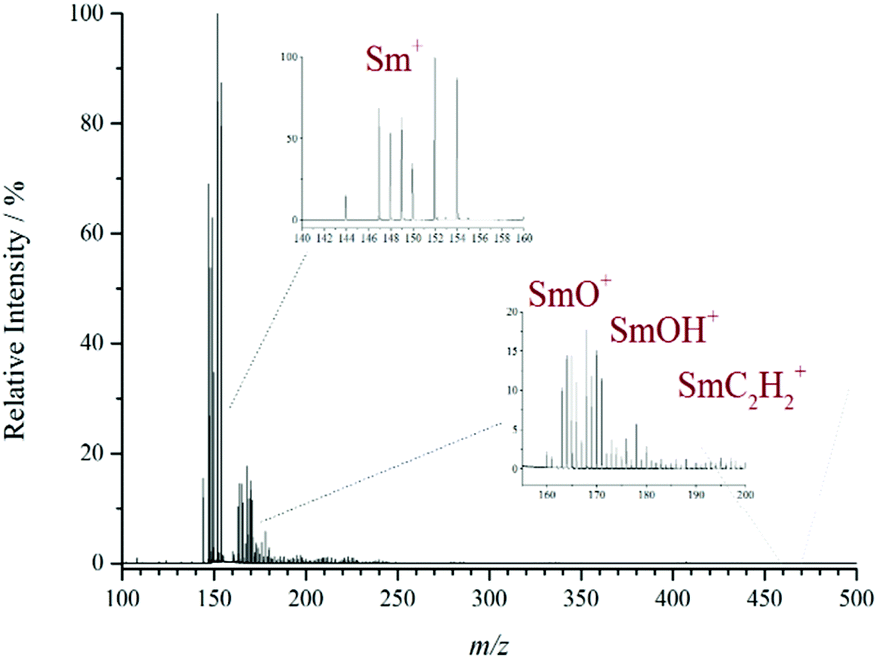 | ||
| Fig. 2 Positive ion CG-MALDI-MS of samarium(III) nitrate, showing the Sm+, SmO+, SmOH+ and SmC2H2+ ions along with their distinctive isotopic distributions. The figure shows considerable overlapping of the individual isotopic distributions due to the isobaric species present. | ||
One possible way to overcome these issues of overlapped isobaric distributions might be by a qualitative trial and error method, where a spectrum is generated by guessing the percentage contribution from each component, and then adjusting to visually match the observed spectrum. However, since the adjustment of the percentage contributions is done visually, this introduces a large amount of operator uncertainty which is difficult to quantify.
A more scientifically rigorous approach to generate reliable quantitative information about the relative amounts of overlapping species is needed. Such an approach can operate in two domains – the intensity domain or the mass domain. In the intensity domain the observed spectrum is reconstructed by superposing the theoretical patterns of the species believed to be present, in such proportions as to match the observed spectrum as closely as possible. The key assumption underlying this technique is that the intensity at each point in the spectrum is a linear combination of its components, that is, it obeys the superposition principle. In the mass domain, isobaric interferences lead to a shift in the peak centroids and a distorted peak shape due to the small discrepancy in mass between isobaric species. This can be modelled by forming Gaussian components of the individual species and then adjusting to match the width and position of the observed peak. The key assumption here is that ions are normally distributed with respect to their arrival time at the detector.
The mass domain approach requires instruments with very high resolving power in order to be effective, and so deconvolution in the intensity domain is the preferred method for most applications. Meija and Caruso24 present a relatively straightforward method involving deconvolution of mass spectra in the intensity domain using a least squares algorithm which has been adapted here and integrated into the standard data analysis of the lanthanide spectra in positive ion mode. This was achieved by deriving the necessary formulae and constructing in-house scripts in the Origin data package. The mathematical steps and code are outlined in detail in the ESI.† The reason for employing this type of methodology is to provide a greater insight into the chemistry taking place; separating the relative proportions of ions detected in the spectra will give a more accurate picture of the trends across different analytes. In previous work peaks found at the correct mass would be integrated blindly, that is, with little regard to interfering (isobaric) species.
To illustrate the method of solving the least squares, the positive ion MALDI-MS of Sm(NO3)3 is used as an example (see Fig. 2), because it has a particularly complex isotope pattern. In the spectrum the following five ions were identified: Sm+, SmO+, SmOH+, SmC2+ and SmC2H2+. The bare metal ion does not encounter any interference from other species and so an accurate isotope pattern is observed. However, the latter four ions all have similar masses, so their isotope distributions overlap, and the isobaric components interfere with each other, causing a distortion of the isotope pattern and incorrect reporting of the observed composition. The spectrum was imported into Origin and run through the in-house developed deconvolution script (see ESI Fig. S2†). The results of the deconvolution for Sm were as follows: Sm+ = 100%, SmO+ = 17%, SmOH+ = 12%, SmC2+ = 3%, SmC2H2+ = 4% (all relative intensity to ±2%). The solving of the least squares deconvolution was performed in the same fashion for all the lanthanides enabling the trends in the observed ions across the period to be reported more accurately. Fig. S2† also shows the results for neodymium and europium. The deconvolution results are then used to instigate the further discussions below.
Two dominant ions were detected for each of the lanthanide analytes: the lanthanide oxide ion, LnO+, and the bare metal cation, Ln+. One of these two ions will always be the base peak in any analysis, with the ratio of the two varying across the lanthanide period (see later). The dicarbide ion, LnC2+, was also detected in every case, but at much lower abundances, typically <30% RI. The relative proportions of these three ions are shown graphically in Fig. 3. Fig. 3(a) shows the data without deconvolution, whereas Fig. 3(b) shows the data where a deconvolution algorithm has been applied. The first notable difference is that the samarium monoxide ion had been over-represented in the original data. This is because the peaks that are expected to be made up of just the monoxide ion are being contributed to by other ions, such as the hydroxide ion, making the peak area larger and hence being overestimated. The other notable difference is the proportion of the ytterbium monoxide ion. Before deconvolution, the peaks that were thought to be contributing to this ion were in fact almost solely due to the hydroxide ion, hence a blind integration of the peaks gave an overestimate of the amount of the monoxide ion.
 | ||
| Fig. 3 Stacked bar charts showing the relative proportions of Ln+, LnO+ and LnC2+ ions across the lanthanide period. (a) is unprocessed data, (b) is the same data after deconvolution of the LnO+ and LnC2+ ions. To keep the graphic simple, error bars have been omitted. | ||
The Ln+ and LnO+ ions
The ratio of LnO+ to Ln+ decreases across the lanthanide period. The trend is shown in Fig. 4. Two anomalies to the downward trend occur at gadolinium and lutetium. The experimental variation in the LnO+/Ln+ ratio was remarkably small (just a few percent) especially when compared with variations in ion yields typically observed in MALDI, which can be in the order of tens of percent. The LnO+/Ln+ ratio was unique in this respect; no other ions observed in this study exhibited this precision in their ratio across multiple repeats. Such a stable observation must indicate that this ratio is due to a fundamental feature of the analyte, independent of sample preparation effects such as inhomogeneous spot drying and indicates a more intrinsic property of the lanthanides themselves. | ||
| Fig. 4 Graph of the trend in LnO+/Ln+ ratio across the lanthanide period vs. reaction rate constants for Ln + O2 (obtained at 5 Torr and at 373 K by Campbell et al.25 – exponential scales). | ||
The decrease of the LnO+/Ln+ ratio can be caused by either of two factors: an increase in the absolute abundance of Ln+ across the period or a decrease in the absolute abundance of LnO+. During the MALDI ionisation process, there is a small delay of the order of a hundred microseconds (depending on instrument) between laser irradiation and ion extraction (the extraction delay). During this delay, ions and molecules in the plume can interact in the gas-phase. Since the extraction of the ions occurs on a very short timescale compared to the delay, the detected ions present is in fact a snapshot of the progress of these reactions. For different lanthanides, these reactions occur at different rates, leading to the observed variation of the LnO+/Ln+ ratio across the lanthanide period.
Little is known about what processes exactly take place in the MALDI plume, especially with unorthodox analytes like lanthanide metal salts, but some insight might be gained by looking at a study conducted by Campbell et al.25 Here, a study of the gas-phase reaction rates of lanthanide atoms with molecular oxygen was performed through the laser induced dissociation of the Ln(TMHD)3 precursor to form lanthanide atoms in the gas-phase. Their abundance was monitored using laser-induced fluorescence while they reacted in a slowly flowing gas. The reaction mechanism was stated as being a bimolecular abstraction of an oxygen atom, see eqn (1).
| Ln (g) + O2 (g) → LnO (g) + O (g) | (1) |
The observed decay rate of the Ln atoms was used to calculate the reaction rate constant. They repeated the experiment at multiple temperatures from around 300 K to 600 K and always the same trend was apparent; the results from the experiment conducted at 398 K are also plotted in Fig. 4 alongside the LnO+/Ln+ ratio we observed. The two trends correlate remarkedly closely. This implies that the MALDI “snapshot” of the reactions in the plume has progressed to different extents depending on the lanthanide present due to their different rates of reaction with oxygen, and we can speculate that this is the origin of the observed trend in the LnO+/Ln+ ratio.
Although the correlation between the two data sets in Fig. 4 is good, the link is still tentative. It is not clear whether the reaction, if it takes place, proceeds exactly as stated in eqn (1), and also whether the conditions in the plume are sufficiently similar to make this comparison valid. The LnO species must be ionised to be detected, and the source of the molecular oxygen is unclear. The way that the analyte crystallises on the sample plate and what form it is in when initially desorbed are also unknown. For example, depending on the lanthanide, different amounts of the preformed monoxide might be present on the sample spot in the solid state. Subsequent desorption and ionisation by the laser could then give rise to the above trend.
Another contributing factor to the downward trend in the LnO+/Ln+ ratio could be the absolute increase in the abundance of the Ln+ ion. An effect which may come into play in the MALDI plume is the first ionisation energy of the lanthanide atom and its corresponding monoxide; this is presented in Fig. 5. The values for the oxides are taken from an analysis conducted in 2006 by Schofield.26 Both sets of ionisation energies increase across the period, but those of the lanthanide monoxide increase at a greater rate, such that near the middle of the period there is a cross-over. As a result, the early LnO species are much easier to ionise than the bare metal, but as the atomic number increases the monoxide becomes more difficult to ionise than the metal. In the context of the MALDI experiment this means that the Ln+ ion may be more likely to be formed relative to the LnO+ in the plume, and this in turn will contribute to the decrease in the LnO+/Ln+ ratio.
 | ||
| Fig. 5 Graph of the first ionisation energy of the atomic lanthanides and lanthanide monoxide molecules. The data for LnO is taken from work by Schofield26 and the data for Ln atoms is from the work by Lang.27 | ||
Assuming that the reaction in eqn (1) is taking place, it is interesting to note that the reaction rates of the lanthanides vary over such a large scale. The data in Fig. 4 is plotted on an exponential scale, showing that the reaction rate constants vary over nearly two orders of magnitude. Lanthanides are often thought to not exhibit diversity in their behaviour because their electronic structures change only by adding successive electrons into the 4f shell, which does not extend far enough spatially to be involved in bonding. Campbell et al. noticed that the activation energies for the reaction correlated with the energy needed to promote an electron out of the 6s subshell into a higher energy level.25 The rationalization of this is as follows: if a Ln atom in its ground state approaches an oxygen molecule there will be an overlap of the outer s orbital of the lanthanide and the antibonding π* orbitals of the oxygen. But the 6s orbital in each Ln is doubly occupied, which means there is zero probability of finding an additional shared electron there and hence no lowering in energy as the species approach and the dominant force will be electrostatic repulsion. However, promotion of one of these electrons to a higher energy level will make the s orbital of the lanthanide available for an interaction, reducing the repulsion between the Ln atom and O2 molecule.
The promotion energies for the singly ionised lanthanide ions Ln+ are shown in Fig. 6. This is the energy needed to take the Ln+ ions from their ground state (usually of the form 4fn6s1) into a higher energy configuration that has two non-f electrons, either 4fn−15d16s1 or 4fn−15d2 configurations. A promotion energy of zero in Fig. 6 indicates that the ion is already in the correct configuration in its ground state. A theoretical analysis by Gibson in 2003 looked at the bonding in lanthanide oxide molecules and speculated that for effective bonding between the metal and the oxygen atom, two unpaired d orbital electrons must be available, hence the 4fn−15d2 configuration is more likely to be involved in the reaction.28 Both sets of data show a similar trend though, and it appears that the more difficult it is to promote an electron into a reactive configuration, the lower the rate of reaction.
 | ||
| Fig. 6 Graph showing variation of the electron promotion energies for the singly charged lanthanide ions Ln+. Energies are shown for the excitation of one of the 4f electrons from the ground state configuration to the next two lowest-lying excited states, which are the 4fn−15d16s1 and 4fn−15d2 configurations.28 | ||
The LnOH+ ion
The LnO+ and Ln+ ions were detected for all the lanthanides, but only four of the lanthanide analytes generate the LnOH+ ion. These were samarium, europium, thulium and ytterbium. The LnOH+ ion has not been reported in any previous work on Ln salts by MALDI, probably because it is difficult to distinguish it from the ever-present LnO+ ion, which differs by only one mass unit. This is particularly difficult in the case of samarium and ytterbium, which have complicated isotope patterns. Europium and thulium have not been tested previously.In the hydroxide cation, the lanthanide is in the +2 oxidation state, which is unusual, however, the four elements listed are known to be stable in this oxidation state.29 This can be understood by studying the reduction potentials for the following process:
| Ln3+ + e− → Ln2+ | (2) |
 | ||
| Fig. 7 Graph showing the reduction potentials of the lanthanide series for the reaction shown in eqn (2).30 | ||
The abundances of the hydroxide ions decreased in the order Eu > Yb > Sm > Tm, which matches the trend in Fig. 7. It should be noted that detection of TmOH+ is aided because thulium is monoisotopic. In practice this means that its peak intensity is not spread out across multiple peaks, and also no deconvolution of its mass spectra is needed to separate the TmOH+ from TmO+ ions. If this was not the case, it is likely that any TmOH+ ions would have been below the limit of detection.
The LnC2+ ion
Lanthanide dicarbide ions, LnC2+, were detected for every lanthanide tested. The relative amounts compared to the monoxide and metal ions were shown in Fig. 3, but this figure does not convey the variation in abundance with repeated measurements. When compared to the base peak in the spectra, the standard deviation of its intensity was around 15 percent. This deviation did not appear to change with the selection of any other reference peak; no relationship or constant ratio could be established, unlike the case with the LnO+ and Ln+ ions. This could indicate that the relative abundance of the lanthanide dicarbide ion is affected by the sample preparation method and inhomogeneities in the sample spot. The graphite matrix provides the source of carbon, so local build-ups of matrix in the irradiated area would lead to more carbon clusters being available for interactions in the plume. The converse would also be true, and so these effects may provide the origin of the random variation of the abundance of the LnC2+ ion. The observation of the dicarbide ion is little known in the literature for the gas-phase reactions of lanthanides. The nature of the bonding of the dicarbide (and the very lower intensity LnC2H2+) ions and their spatial geometry are open to discussion, however Yang et al. have proposed structures based on metal substituted cyclopropene or metallocyclopropenes.22,23Conclusions
In conclusion, the lanthanides were observed to exist in a range of oxidation states in the gas-phase. For example, I, II and III for the Ln+, LnOH+ and LnO+ ions respectively. Oxidation state II was only observed for samarium, europium, thulium and ytterbium which agrees with the expected behaviour of those four elements, in the sense that they are known to form stable divalent compounds.29 The LnOH+ ion also had not been detected in previous studies and had to be separated from the interfering LnO+ ion in the majority of cases, by deconvolution of the mass spectra. Analysing a complete set of lanthanide analytes revealed an interesting downward trend in the LnO+/Ln+ ratio of abundances, confirming propositions from earlier work. This downward trend correlated well with the reaction rates of lanthanide atoms with oxygen25 but could also be explained in terms of the tendencies of the Ln atoms and LnO+ molecules to become ionised at different rates; across the period the lanthanide oxide becomes more difficult to ionise than its bare metal counterpart.Work by the Bohme group investigated a variety of gas-phase reactions involving lanthanide cations, by using an ICP-MS. The reactions of the Lanthanides with a range of gases were studied, including nitric oxide,31 sulfur hexafluoride32 and ammonia.33 In all cases, the periodic trends in reaction efficiency were similar and rationalised in terms of the electron promotion energies of Ln+. In our study presented here, we show a very similar trend of reactivity across the Ln period. It is most certain that the periodicity of reactivity across the lanthanide group is controlled by their complicated electronic configuration and promotion energies in much the same way as other metals, and that their chemistries are in fact much more complicated than one may initially think.
The exact nature of the reactions occurring in the plume are still open to question. The correlation of the detected ions with reaction rates, however compelling, is still speculative, and one should not ignore effects caused by inhomogeneous crystallisation on the sample spots and/or the creation of preformed ions. But, if the trends result from random processes occurring the sample spots prior to ablation or uncontrolled events occurring in the desorbing plume, then that would not explain their close correlation with the reaction rates.
The periodicity in ionisation and reactions were investigated with the help of an in-house developed deconvolution algorithm to quantify the contribution of the various isobaric species across the broad (overlapped) isotopic distributions. The trend in reactivities can be rationalised in terms of the energy needed to put the lanthanide ion into a configuration with two non-f valence electrons, where they can become involved in bonding with an oxygen atom.
Conflicts of interest
The authors declare that there are no conflicts.Acknowledgements
UC and ADW would like to acknowledge the mass spectrometry facility in the University of Bristol for providing access to the instruments.Notes and references
- L. de Almeida, S. Grandjean, N. Vigier and F. Patisson, Eur. J. Inorg. Chem., 2012, 31, 4986 CrossRef.
- N. Lewen, S. Mathew, M. Schenkenberger and T. Raglione, J. Pharm. Biomed. Anal., 2004, 35, 739 CrossRef CAS PubMed.
- K. L. Nuttall, W. H. Gordon and K. O. Ash, Ann. Clin. Lab. Sci., 1995, 25, 264 CAS.
- N. C. Dopke, P. M. Treichel and M. M. Vestling, Inorg. Chem., 1998, 37, 1272 CrossRef CAS PubMed.
- B. Guan, W. Lu, J. Fang and R. B. Cole, J. Am. Soc. Mass Spectrom., 2007, 18, 517 CrossRef CAS PubMed.
- D. Corpillo, C. Cabella, S. G. Crich, A. Barge and S. Aime, Anal. Chem., 2004, 76, 6012 CrossRef CAS PubMed.
- N. Ikpo, S. M. Butt, K. L. Collins and F. M. Kerton, Organometallics, 2009, 28, 837 CrossRef CAS.
- J. C. García-Martínez, C. Atienza, M. de la Peña, A. C. Rodrigo, J. Tejeda and J. Rodríguez-López, J. Mass. Spectrom., 2009, 44, 613 CrossRef PubMed.
- G. Bartkowiak, K. Gawron, S. Jurga and G. Schroeder, Rapid Commun. Mass Spectrom., 2015, 29, 1696 CrossRef CAS PubMed.
- R. Knochenmuss, F. Dubois, M. Dale and R. Zenobi, Rapid Commun. Mass Spectrom., 1996, 10, 871 CrossRef CAS.
- J. Sunner, E. Dratz and Y. C. Chen, Anal. Chem., 1995, 67, 4335 CrossRef CAS PubMed.
- M. J. Dale, R. Knochenmuss and R. Zenobi, Anal. Chem., 1996, 68, 3321 CrossRef CAS PubMed.
- C. Black, C. Poile, J. Langley and J. Herniman, Rapid Commun. Mass Spectrom., 2006, 20, 1053 CrossRef CAS PubMed.
- G. J. Langley, J. M. Herniman and M. S. Townell, Rapid Commun. Mass Spectrom., 2007, 21, 180 CrossRef CAS PubMed.
- A. D. Warren, U. Conway, C. J. Arthur and P. J. Gates, J. Mass Spectrom., 2016, 51, 491 CrossRef CAS.
- U. Conway, A. D. Warren, C. J. Arthur and P. J. Gates, Polym. Chem., 2021, 12, 439 RSC.
- A. D. Warren, D. J. Mitchell and P. J. Gates, Eur. J. Mass Spectrom., 2018, 24, 89 CrossRef CAS PubMed.
- G. Schwarz, L. Mueller, S. Beck and M. W. Linscheid, J. Anal. At. Spectrom., 2014, 29, 221 RSC.
- C. E. Kefalidis, L. Castro, L. Perrin, I. del Rosala and L. Maron, Chem. Soc. Rev., 2016, 45, 2516 RSC.
- W. Sun, X. Kuang, H. D. J. Keen, C. Lu and A. Hermann, Phys. Rev. B, 2020, 102, 144524 CrossRef CAS.
- C. Cutler, C. J. Smith, G. Ehrhardt, T. Tyler, S. Jurisson and E. Deutsch, Cancer Biother. Radiopharm., 2000, 15, 531 CrossRef CAS PubMed.
- D. Hewage, W. R. Silva, W. Cao and D. S. Yang, J. Am. Chem. Soc., 2016, 138, 2468 CrossRef CAS PubMed.
- S. Kumari, W. Cao, Y. Zhang, M. Roudjane and D. S. Yang, J. Phys. Chem. A, 2016, 120, 4482 CrossRef CAS PubMed.
- J. Meija and J. Caruso, J. Am. Soc. Mass Spectrom., 2004, 15, 654 CrossRef CAS PubMed.
- M. L. Campbell, J. Phys. Chem. A, 1999, 103, 7274 CrossRef CAS.
- K. Schofield, J. Phys. Chem. A, 2006, 110, 6938 CrossRef CAS PubMed.
- P. F. Lang and B. C. Smith, J. Chem. Educ., 2010, 87, 875 CrossRef CAS.
- J. Gibson, J. Phys. Chem. A, 2003, 107, 7891 CrossRef CAS.
- S.-E. Bae, T. S. Jung, Y.-H. Cho, J.-Y. Kim, K. Kwak and T.-H. Park, Inorg. Chem., 2018, 57, 8299 CrossRef CAS PubMed.
- L. R. Morss, Chem. Rev., 1976, 76, 827 CrossRef CAS.
- V. Blagojevic, E. Flaim, M. Jarvis, G. Koyanagi and D. Bohme, Int. J. Mass Spectrom., 2006, 249–250, 385 CrossRef.
- P. Cheng, A. Shayesteh and D. K. Bohme, Inorg. Chem., 2009, 48, 1018 CrossRef CAS PubMed.
- G. K. Koyanagi, P. Cheng and D. K. Bohme, J. Phys. Chem. A, 2010, 114, 241 CrossRef CAS PubMed.
Footnotes |
| † Electronic supplementary information (ESI) available. See DOI: 10.1039/d1an00981h |
| ‡ Present address: Kratos Analytical, Trafford Park, Manchester, M17 1GP, UK. |
| This journal is © The Royal Society of Chemistry 2021 |