
 Open Access Article
 This Open Access Article is licensed under a
 Creative Commons Attribution 3.0 Unported Licence
3D printed imaging platform for portable cell counting†
Diwakar M.
Awate
a,
Cicero C.
Pola
a,
Erica
Shumaker
a,
Carmen L.
Gomes
 a and
Jaime J.
Juárez
*ab
a and
Jaime J.
Juárez
*ab
aDepartment of Mechanical Engineering, Iowa State University, 2529 Union Drive, Ames, IA 50011, USA. E-mail: jjuarez@iastate.edu
bCenter for Multiphase Flow Research and Education, Iowa State University, 2519 Union Drive, Ames, IA 50011, USA
First published on 24th May 2021
Abstract
Despite having widespread application in the biomedical sciences, flow cytometers have several limitations that prevent their application to point-of-care (POC) diagnostics in resource-limited environments. 3D printing provides a cost-effective approach to improve the accessibility of POC devices in resource-limited environments. Towards this goal, we introduce a 3D-printed imaging platform (3DPIP) capable of accurately counting particles and perform fluorescence microscopy. In our 3DPIP, captured microscopic images of particle flow are processed on a custom developed particle counter code to provide a particle count. This prototype uses a machine vision-based algorithm to identify particles from captured flow images and is flexible enough to allow for labeled and label-free particle counting. Additionally, the particle counter code returns particle coordinates with respect to time which can further be used to perform particle image velocimetry. These results can help estimate forces acting on particles, and identify and sort different types of cells/particles. We evaluated the performance of this prototype by counting 10 μm polystyrene particles diluted in deionized water at different concentrations and comparing the results with a commercial Beckman-Coulter Z2 particle counter. The 3DPIP can count particle concentrations down to ∼100 particles per mL with a standard deviation of ±20 particles, which is comparable to the results obtained on a commercial particle counter. Our platform produces accurate results at flow rates up to 9 mL h−1 for concentrations below 1000 particle per mL, while 5 mL h−1 produces accurate results above this concentration limit. Aside from performing flow-through experiments, our instrument is capable of performing static experiments that are comparable to a plate reader. In this configuration, our instrument is able to count between 10 and 250 cells per image, depending on the prepared concentration of bacteria samples (Citrobacter freundii; ATCC 8090). Overall, this platform represents a first step towards the development of an affordable fully 3D printable imaging flow cytometry instrument for use in resource-limited clinical environments.
1. Introduction
The emergence of infectious diseases has been recognized for millennia, well before the discovery of their causative agents.1 Despite major advances in developing countermeasures such as diagnostic tools, therapeutics and vaccines, global pandemics remain a serious risk to human health which places an enormous economic burden on resource-limited countries and rural areas. Flow cytometry is one tool that is widely used by medical professionals to study and identify potential pathogens.2,3 These instruments rely on hydrodynamic flow focusing to align cells and direct them to pass through a laser spot where a detector collects scattered light for the purpose of counting cells and quantifying biomarkers.4,5 While flow cytometers have found widespread use in the biomedical sciences, there are several limitations that prevent their application to point-of-care (POC) diagnostics in resource-limited environments. First, flow cytometers are large, sensitive instruments that require access to lab facilities, highly trained personnel, and cost ∼$50K US dollars.6 And second, cells often require chemical labeling before introducing a sample to the flow cytometer,7 which increases processing time and cost for handling samples.3D printing represents one method to reduce the cost of POC devices and improve their accessibility in resource-limited environments that lack ready access to machining facilities. Parts manufactured by 3D printing are fabricated layer by layer, which means that there is little to no excess waste material. Furthermore, the speed at which 3D printed components can be fabricated make this process cost-effective. The application of 3D printing to POC device fabrication includes optofluidic platforms that operate as a flow cytometer and perform quantitative measurements of red and white blood cells8,9 or particles.10 A 3D-printed electrochemiluminescent immunoarray that can detect two proteins simultaneously from complex liquid samples with high sensitivity and selectivity for cancer diagnostics.11 An autonomous 3D-printed platform is able to perform DNA loop-mediated isothermal amplification (LAMP) and acoustic detection at the POC directly in crude samples with the use of a smartphone.12 A 3D-printed microfluidic reactor array capable of carrying out extraction, concentration and isothermal amplification of nucleic acids in variety of body fluids to allow rapid molecular diagnostic tests for infectious diseases at POC.13 A 3D-printed portable POC device was also developed to magnetically separate and analyze biological samples.14,15 The examples of 3D printed platforms described here highlight the utility of this manufacturing process for creating a wide variety of POC devices.
Despite the advantages offered by 3D printing to POC device development, there remain opportunities for improvement. For example, many of the 3D-printed platforms described above rely on sample labeling,16,17 which increases assay cost and processing time. Reliance on sample labeling can be reduced or eliminated by using optical video microscopy to identify samples. Imaging flow cytometry platforms have advanced to the point where we can distinguish between cell types18 or identify specific cellular structures19 and automate the process of scanning samples for a wide array of cytometric parameters.20 However, combining 3D-printed POC devices with imaging flow cytometry offers its own unique set of challenges. In an effort to maintain portability, 3D-printed POC devices often rely on smartphone cameras that feature built-in software that cannot be disabled and will create image artifacts that cannot be corrected for.21 Utilizing smartphones for imaging flow cytometry risks sacrificing sensitivity and accuracy when compared to conventional laboratory microscopes. Furthermore, attaching an excessive number of accessories to smartphones for POC purposes can make the device unwieldy, which leads to a loss of assay accuracy.22
In this paper, a 3D-printed imaging platform (3DPIP) capable of accurately counting particles is introduced. This platform combines conventional microscopy optics and a low-cost machine vision camera with 3D-printed attachments to overcome the limitations of smartphone-based POC devices. At an estimated material cost of $1.4K US dollars, this platform is a cost-effective alternative to a commercial particle counter, which costs approximately $17K US dollars. Our 3DPIP is capable of counting particle concentrations down to 124 particles per mL with an accuracy of ±20 particles at a flow rate of 1 mL h−1. Our results show that this accuracy is maintained for flow rates up to 5 mL h−1. Furthermore, by analyzing 10 μm polystyrene and 1–5 μm sized bacteria, we also show that our platform is able to image a wide range of particle dimensions. The 3DPIP is not only accurate, inexpensive and portable, but also its reliance on direct imaging of particles means that we do not rely on complex sample preparation methods. Overall, this platform represents a first step towards the development of an affordable fully 3D printable imaging flow cytometry instrument for use in resource-limited environments.
2. Materials and methods
3D-printed optomechanics
The 3DPIP was designed to be compatible with a FLIR Blackfly machine vision camera (Model BFLY-U3-23S6M, FLIR Systems, Wilsonville, OR). As shown in Fig. 1, the 3D-printed assembly for the platform consists of a camera tube, two camera tube holders and a flow cell holder. Images of our platform are also shown in Fig. S1 in the ESI.† These components were designed using CAD software (SolidWorks, Waltham, MA). Using 3D-printed parts means that our platform is lightweight and portable, which allows for easy assembly and component modification. The components were printed using the fused filament fabrication method on a LulzBot Taz6 3D printer (FAME 3D, Fargo, ND) with 3 mm acrylonitrile butadiene styrene (ABS) filament sourced from Keene Village Plastics (Barberton, OH).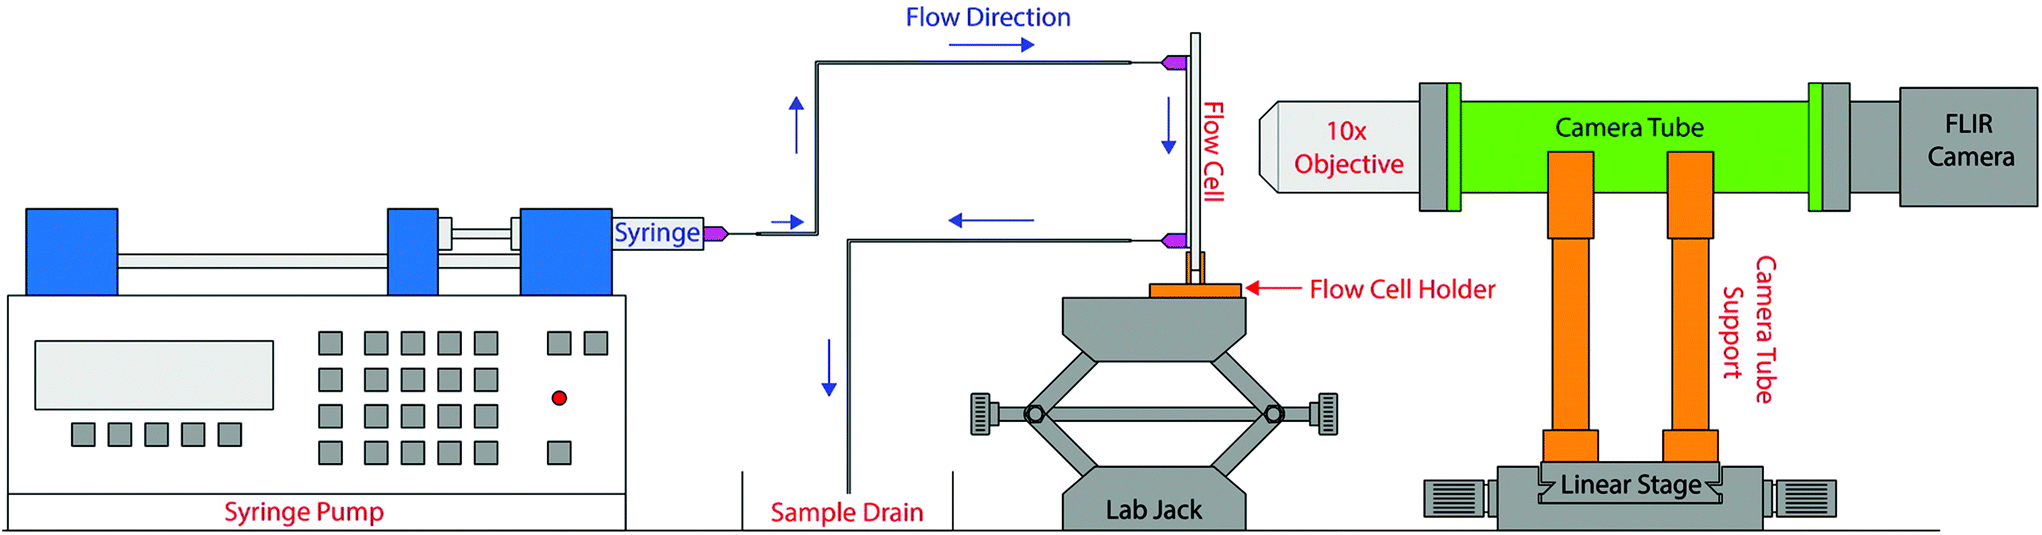 | ||
| Fig. 1 A schematic representation of the 3D-printed imaging platform (3DPIP) set-up used in our experiments. | ||
The custom lens tube (O.D. 30.47 mm; 86.2 mm long) was designed to accommodate two threaded 30 mm cage plates (part number CP33, Thorlabs, Newton, NJ) on both ends. These cage plates were used to mount a 10× objective lens (part number PL10X-INF-V300, AmScope, Irvine, CA) and the Blackfly camera. The camera tube was supported by two support structures (91.44 mm tall) which were fixed on a linear stage (part number TSX-1, Newport, Irvine, CA) using 6 mm screws. The flow cell holder was designed to hold the flow cell vertically using a half rectangle-shaped slot. The flow cell holder's base was screwed into a linear stage to keep the flow cell stable and enable translation during the experiment. For the purposes of the experiments described here, we placed the 3DPIP on an optical table, which served as a stable, level surface for experiments. However, these components can easily be placed on an optical breadboard for portability.
Optical components
The optical components include a 10× objective lens, the Blackfly camera, and a white LED table lamp (part number 8541999294, Luxjet, Shenzhen, China). The 10× objective lens was mounted to the tube with a 30 mm cage plate using a threaded adapter (part number SM1A3, Thorlabs, Newton, NJ). The Blackfly camera was mounted to the opposite end of the lens tube with another 30 mm cage plate and threaded adapter (part number SM1A39, Thorlabs, Newton, NJ). The lens tube assembly was mounted on two supports as shown in Fig. 1 and affixed to a linear translation stage to allow for image focusing. The flow cell holder was affixed to another linear translation stage and a lab jack to allow for more degrees of freedom when focusing on particles in the sample. While the linear translation stages and the lab jack were not 3D-printed for this experiment, files for printing such elements are readily available for free at Thingiverse.com.23,24 The light source was clamped to a nearby ring stand and could be powered either through a USB cable or a 120 V adapter. Future iterations of the 3DPIP will focus on developing a fully 3D printed enclosure to improve portability.Fluorescence microscopy
Additional lighting and filter components were added to make the 3DPIP capable of fluorescence imaging in static microscopy mode. In this static imaging configuration shown in Fig. 1, stationary fluorescent particles sandwiched between a glass slide and cover glass can be imaged. A single blue LED (Ltvystore Blue 12 V DC prewired LED) was used to excite the fluorescent sample. The LED was powered by a 9 V battery (AmazonBasics 9 V alkaline battery) placed inside a battery holder case (LMPVPATH 9 V battery case) with a slide switch to avoid any high-power drain of the LED. This LED was mounted on a tool stand (HFS magnetic base metal test indicator holder) to direct the LED light towards the fluorescent sample. The fluorescence emission from the sample passes through a yellow plastic absorption filter (Edmund Optics 47-616, 500 nm × 25 mm OD2 longpass filter) placed behind the objective lens to remove the scattered excitation light and provide a dark-field background required for fluorescent imaging. The fluorescent images can be capture by the Blackfly camera and further digitally processed as required. Additionally, this fluorescence microscopy setup allows the illumination light source (LEDs) and the plastic absorption filter to be easily modified to accommodate a wide range of fluorophores, which results in 3DPIP capable of imaging fluorescent samples with different excitation/emission wavelengths.Fabrication of the flow cell
The flow cell used in the experiments was fabricated using 1 mm square capillary tubes (part number 8100, VitroCom, Mountain Lakes, NJ). The capillary tubes were cut into 50 mm length and glued to a 50 mm × 75 mm glass slide (part number 12-550C, Fisher Scientific, Waltham, MA) with the capillary tube centered on the slide as shown in Fig. 1. Both the capillary tube and the glass slide were cleaned with an alcohol wipe prior to gluing these items together. Two 18-gauge syringe needles (part number 901-18-100, CML Supply, Lexington, KY) were glued to either end of the capillary tube to act as injection and outlet ports for the sample. The adhesive used for the flow cell fabrication was 5-minute epoxy (part number 4YKT2, Grainger, Lake Forest, IL). After gluing all the components together, the flow cell was left undisturbed for 24 hours to allows the epoxy to cure at room temperature.3DPIP cost analysis
Obtaining accurate cost estimates for most POC devices is often challenging because different methodologies are often applied to determine this information.25 In order to minimize ambiguity in our cost analysis, the prices of the laboratory equipment listed in the preceding sections of this article are listed in Table 1. The price of 3D components is estimated by multiplying the cost of ABS stock (∼33′ per gram) times the mass of the printed structures. The cost per experiment is estimated to be ∼$1 for consumables, which excludes the cost of sample preparation. In total, the estimated cost of the 3DPIP is approximately $1395 US dollars, including the additional components required for fluorescence imaging capabilities. This cost estimate indicates that the 3DPIP is an order of magnitude less expensive than a research grade particle counter or fluorescence microscope. This cost analysis does not include the cost of a laptop, which is needed to capture video from the Blackfly camera. The flow cell can be reused after following proper sterilization protocol.26 The items listed in Table 1 show the cost of individual parts and supplies that can be obtained in the United States without institutional discounts. Researchers may utilize this list to identify similar items available in their regions to replicate this platform.| Item | Cost |
|---|---|
| Device cost | |
| FLIR Blackfly S camera | $520 |
| 10× objective lens | $64.80 |
| Advance 1200 syringe pump | $694.99 |
| White LED table lamp | $15.99 |
| Camera tube | $0.71 |
| Camera tube supports | $0.75 |
| Cage plates and threaded adapters | $71.98 |
| Flow cell holder | $0.34 |
| Flow cell | $0.78 |
| Magnetic base tool stand | $21.45 |
| Blue LED | $0.20 |
| 9 V battery | $1.37 |
| Battery case | $1.79 |
| Total device cost | $1395.15 |
| Per-use costs | |
| Syringe | $0.23 |
| Syringe needle | $0.17 |
| Centrifuge tube | $0.61 |
| Total costs per-use | $1.01 |
Polystyrene sample preparation
Initial experiments were performed using 10 μm diameter polystyrene beads (part number Polystyrene 118, Phosphorex, Hopkinton, MA) with a reported concentration of 10 mg mL−1. A stock sample of particles was prepared by adding 4.6 μL of polystyrene beads directly from the manufacturer's bottle to 4 mL of deionized (DI) water sourced from an ARIES High Purity Water System with a 0.2 μm filter (Aries Filterworks, Camden, NJ). The sample was kept in a 15 mL centrifuge tube until further use. Based on the reported concentration, this sample was expected to contain an approximate particle concentration of 21![[thin space (1/6-em)]](https://www.rsc.org/images/entities/char_2009.gif) 000 particles per mL. The concentration of this sample, along with all other samples prepared for our experiments, was validated using a Beckman-Coulter Z2 particle counter.
000 particles per mL. The concentration of this sample, along with all other samples prepared for our experiments, was validated using a Beckman-Coulter Z2 particle counter.
The stock solution of 21000 particles per mL was diluted down by taking one part stock and adding to two parts DI water to produce a concentration of 7000 particles per mL. This process was repeated with the 7000 particles per mL sample to create a 2333 particles per mL sample, followed by a 778 particles per mL sample using the 2333 particles per mL sample. Each of these concentrations were tested in triplicate at a flow rate of 1 mL h−1. The operating limits of the system were also tested by examining each one of the samples in triplicate with three additional flow rates (5 mL h−1, 9 mL h−1, 13 mL h−1). The sample was placed on a vortex mixer for 45 seconds prior to the start of each experiment. Each sample was then drawn into a 10 mL syringe (Becton-Dickinson, Franklin Lakes, NJ) and pumped into the flow cell using a syringe pump (Advance 1200, CellPoint Scientific, Gaithersburg, MD).
Bacteria sample preparation
Gram negative bacteria Citrobacter freundii (ATCC 8090) were used to evaluate the 3DPIP's particle counting capabilities in a clinical setting. Bacteria stored at −80 °C were revived twice in Tryptic Soy Broth (TSB, Hardy Diagnostics, Santa Maria, CA) and incubated at 35 °C for 24 h. Next, the bacteria were streaked on non-selective culture media Tryptic Soy Agar (TSA, Hardy Diagnostics, Santa Maria, CA) and incubated at 35 °C for another 24 h. Isolated colonies were selected from the TSA media and suspended in sterile phosphate buffered saline (1× PBS, pH 7.4, Alfa Aesar, Tewksbury, MA). The bacterial suspension was adjusted according to the 0.5 McFarland standard solution turbidity, resulting in an initial concentration of approximately 1.5 × 10⁸ CFU per mL (colony forming units per milliliter). Then, 2 μL of BactoView™ fluorescent staining solution (Biotium, Fremont, CA) was added to 1 mL of the bacteria suspension and incubated at 37 °C for 30 min. Next, the stained bacteria suspension was centrifuged at 3073g-force for 5 min and the stained bacteria cells were resuspended in 1× PBS. Serial dilutions were performed and evaluated using the 3DPIP.Particle imaging parameters
The samples that passed through the flow cell were imaged through a 10× objective lens. Video of this process was recorded with the Blackfly camera using FlyCapture SDK software, which is freely available through FLIR's website.27 Video was captured for a period of 300 seconds at a rate of 14 frames per second. The pixel resolution for this system depends on the objective lens used in the experiments. Using a stage micrometer, the resolution was found to be 2.5 μm per pixel for a 10× objective lens and 0.63 μm per pixel for a 40× objective lens. These values represent the smallest resolvable object in the field. Thus, a wide variety of particles sizes can be resolved by changing the objective lens used in the experimental set up.A particle tracking code, written in MATLAB (MathWorks, Natick, MA) and based on well-established algorithms,28 was used to process the video and identify particle centers. The tracking algorithm was used to count the number of particles, N, imaged during the video duration. The concentration (c) for each sample was then calculated using the flow rate (Q) and total experimental time (texp), using the following equation, c = N/Qtexp. An open source particle image velocimetry software package, PIVLab,29,30 was also used to calculate particle velocities for the different flow rates examined in this study. These analyses highlight one of the key advantages of the present system, which is the possibility to use software to calculate fluid sample properties (e.g., particle velocities and intensity) that may not be directly accessible using conventional particle counting instruments.
3. Results and discussion
The initial set of experiments consisted of measurements using four different expected concentrations (21000 particles per mL, 7000 particles per mL, 2333 particles per mL, and 778 particles per mL). We performed measurements on each of these concentrations using the 3DPIP with a flow rate of 1 mL h−1. The results, summarized in Fig. 2, show that our platform measured a concentration that was ∼5 times less than initially expected (based on supplier information). We repeated our experiments using a commercial particle counter (Beckman-Coulter Z2 particle counter) and obtained concentrations that were similar to those measured by the 3DPIP. The consistency of these results suggests that, rather than arising from an artifact of sample preparation, the concentration from our particle stock is closer to 2 mg mL−1 instead of 10 mg mL−1. This means that the concentrations we measured on the 3DPIP were 4432 particles per mL, 1663 particles per mL, 492 particles per mL and 124 particles per mL. The lowest concentration measured by the 3DPIP is comparable to the ∼100 particles per mL limit of detection reported for optical particle counters in the literature.31 These results also show that the 3DPIP has a smaller standard deviation in comparison to the commercial particle counter, indicating these measurements are highly precise. The spread in the data collected on the commercial particle exhibit a wider distribution at concentrations above ∼500 particles per mL. Below this limit, the spread of the data drops to approximately 20 particles per mL or less for both the 3DPIP and the commercial particle counter.
 | ||
| Fig. 2 The actual sample concentrations (particles per mL) measured using the 3DPIP (red circles) and a commercial particle counter (black triangles). The inset shows the standard deviation for both instruments (n = 3). | ||
The impact of the flow rate on the accuracy of the measurements was also examined. The results of these experiments, shown in Fig. 3, illustrate that samples run through the 3DPIP almost always exhibit higher counts than the expected concentrations (4432 particles per mL, 1663 particles per mL, 492 particles per mL and 124 particles per mL) based upon our results from Fig. 2. The 5 mL h−1 experiments exhibit the lowest average percent error (∼6.3%) when compared to the expected values. The other flow rates examined here, 9 mL h−1 and 13 mL h−1, exhibited higher average percent error values of 14.1% and 27.1%, respectively. As a general trend, the increase in error correlates with the increase in flow rate. Given the narrow standard deviation observed in these samples and the systematic correlation between error and flow rate, it is believed that this error is not caused by sample preparation. If this was the case, then larger variations should be expected between samples. Another possibility is that the flow rates reported by the syringe pump are not accurate. This possibility is explored in the next section. A third possibility is related to image blurring effect. This effect is an image artifact that arises from a mismatch between the rate at which images are captured and the rate at which a particle travels across the frame.32 Light scattering caused by the transport of particles at higher flow rates might cause temporary bright spots to appear in the frame. These bright spots could potentially register as unique particles, which artificially increases the count. These effects could be mitigated by using a camera with a higher frame rate capability and improved flow cell lighting, both of which could increase the cost of the 3DPIP.
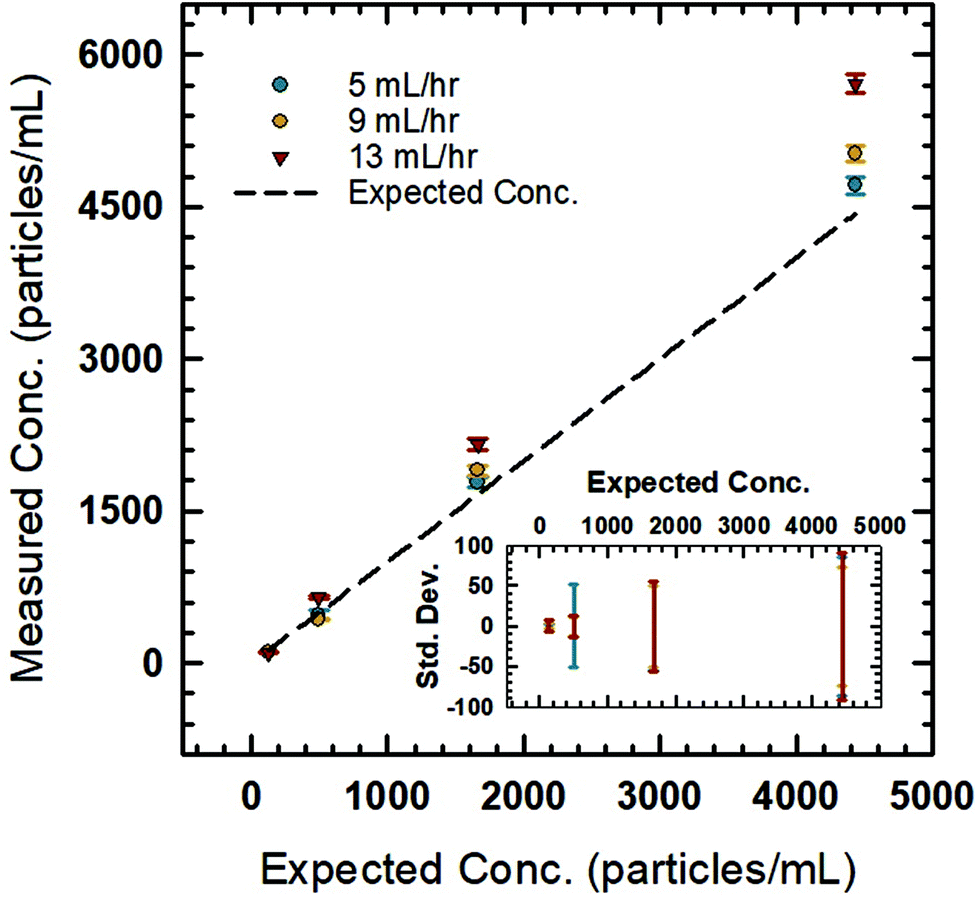 | ||
| Fig. 3 Concentration of samples measured using the 3DPIP compared to the expected concentration measured in Fig. 2 for three different flow rates. Inset shows the standard deviation of the measurements (n = 3). | ||
Particle image velocimetry
Particle image velocimetry (PIV) was used to examine the possibility that fluctuations in sample flow rate was responsible for the error observed at elevated flow rates. The data collected at a concentration of 3000 particles per mL for flow rates of 1 mL h−1, 5 mL h−1, 9 mL h−1 and 13 mL h−1 were used for this analysis. An open-source PIV software package29,30 was used to calculate the average velocity at each flow rate. Fig. 4 shows that sample analyzed at 1 mL h−1 exhibits the smallest variation in measured average velocity, while the other three flow rates exhibit larger variations. In the ESI,† a developed model is presented showing the relationship between average particle velocity and flow rate, using eqn (1).| up,avg = kQ/A − us | (1) |
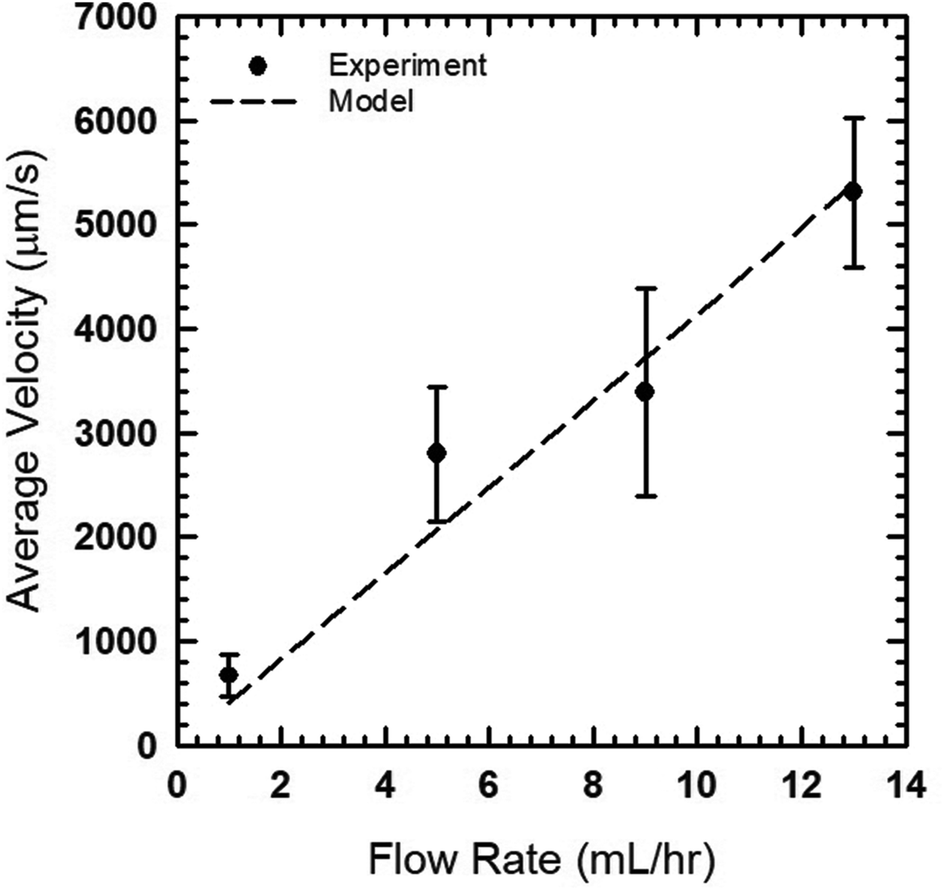 | ||
| Fig. 4 The average particle velocity as a function of flow rate measured using PIV. | ||
Interestingly, there is a similarity between the factor k = 1.49 obtained in our experiments and the value of 1.79 derived for the maximum velocity expression. This observation could suggest that particles preferentially migrate towards the center of the flow cell, an effect known as shear-induced migration.34 Under this interpretation, the particles will migrate towards the center of channel where the shear stress is minimal. As the flow rate is increased, the number of collisions between particles due to hydrodynamic interactions should also increase.35 The expected increase in collisions at higher flow rates could explain the increase in error that observed in the data collected the here.
Another possible explanation arises from the depth of correlation of the imaging platform. The depth of correlation is a measure of how deep an optical region can be observed through an objective lens during a PIV experiment. The depth of correlation can be estimated by eqn (2),36,37
 | (2) |
θ)−1, where NA = nsinθ. The variable, NA, is the numerical aperture of the objective and n is the index of refraction of the fluid. Assuming a value of λo = 550 nm for white light, the correlation of depth was estimated as approximately 168 μm for our system. Thus, these PIV measurements represent the average velocity at a central location within the capillary. Since, the focus of the 3DPIP is not changed during experiments, this means that the volume of fluid being interrogated is limited to a depth of 168 μm. Imaging the same exact region of interest between experiments is challenging. This issue could lead to variations between experiments, which coupled with increasing frequency of collisions between particles as a function of flow rate can be another possible explanation for the increase in error. Observing a limited volume within the flow cell could also explain why such narrow particle concentration distributions were observed in Fig. 2 compared to the commercial particle counter.
Bacteria sample results
Bacteria samples were also tested to demonstrate the clinical testing capabilities of the 3DPIP. Four different bacteria concentrations were tested with the 3DPIP: 103, 104, 105 and 106 CFU per mL. For each concentration, we took 2 μL of bacteria stock solution and placed it in between two 50 mm by 75 mm glass slides. The glass slides were then mounted to the flow cell holder as shown in Fig. S3 in ESI.† The bacteria population distribution in different parts of the glass slide was observed using a 40× objective and it was found that the bacteria were evenly distributed. Further, bacteria distribution images were captured using normal microscope mode and fluorescent mode as shown in Fig. 5. The bacteria shown in Fig. 5 range in size from 1 to 5 microns, which demonstrates that the 3DPIP can image different sized particles. The details of bacteria count results are provided in ESI.† According to the observed results, approximately 10 ± 1.0, 40 ± 1.0, 150 ± 4.5, and 250 ± 9.0 bacteria cells per image were found for the 103, 104, 105, and 106 CFU per mL samples, respectively. The bacteria samples had both live and dead bacteria along with viable but non-culturable bacteria (VNBC) that were all stained by the fluorescent die, consequently yielding much higher number of cells than the numbers counted by plate count using the culture media.39,40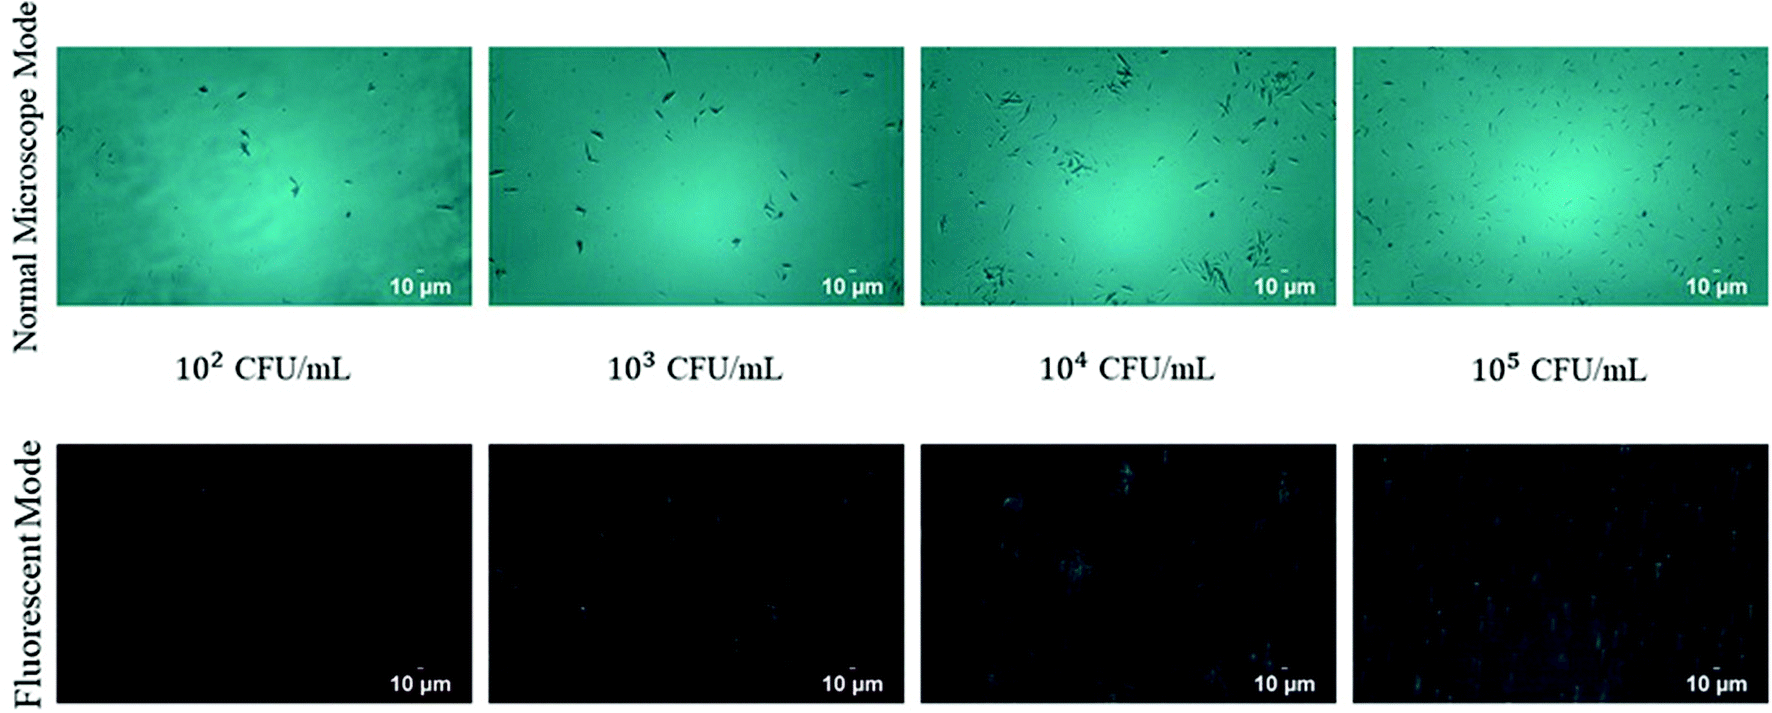 | ||
| Fig. 5 Bacteria images captured using normal microscope mode and fluorescent mode with the 3DPIP. | ||
Bacteria sample results validation
The bacteria sample count results were validated by counting 10 μm polystyrene bead samples on an Olympus IX70 microscope by using the same measurement technique used to count bacteria samples on the 3DPIP. The polystyrene bead concentrations used for the validation were the same ones used for the Coulter counter experiments (i.e., 111, 333, 1000 and 3000 particles per mL). Like with the bacteria counting experiments, samples were dried on a glass slide prior to counting. However, there were two key differences between the validation experiments and the bacteria counting experiments: (1) 200 μL of the sample was dried on a glass slide instead of 2 μL used for bacteria samples, and (2) an average of 15 sample images was taken instead of 3 images. Despite these two differences, the core particle counting method remains the same. The details of particle count results are provided in ESI.† Further, particle distribution images were captured using the lab microscope and 3DPIP are shown in Fig. 6. The particle count results for both 3DPIP and Olympus IX70 were found in good agreement with the coulter counter results from Fig. 2, which further validates our bacteria count results. | ||
| Fig. 6 Particle images captured using the 3DPIP (top row) and an Olympus IX70 (bottom row). | ||
4. Conclusion
A compact and cost-effective particle counter prototype that can count polystyrene particles and bacteria was demonstrated. The prototype consists largely of 3D printed parts, a 10× microscope objective and a machine vision camera connected to a laptop for data collection. Captured images from experiments can be analyzed with a MATLAB code to get particle count.The performance of this prototype was evaluated by counting polystyrene beads diluted in deionized water at different concentrations (3000 particles per mL, 1000 particles per mL, 333 particles per mL, and 111 particles per mL). These experimental results were then compared with a commercial particle counter (Beckman-Coulter Z2) which showed a good correlation. An additional set of experiments was performed to test the performance of the prototype at different flow rates (5 mL h−1, 9 mL h−1 and 13 mL h−1). The results indicated that particle count error tends to increase with the flow rate and samples with 333 mL−1 and 111 mL−1 concentration frequently show undercount due to the increased dilution.
The possibility of using the 3DPIP as a fluorescence microscope with a few modifications was also demonstrated. Additionally, bacteria samples were tested to show the clinical testing capabilities of the 3DPIP. A small volume of each sample was sandwiched between a glass slide and cover slide then observed under normal microscope and fluorescent mode using 3DPIP. The bacteria cells were found evenly distributed over the glass slide which was further used to calculate the number of bacteria cells per mL of the sample. The number of bacteria cells per image was counted manually and then used to determine total number of cells spread over the glass slide. Approximately 10, 40, 150, and 250 bacteria cells per image were found for 103, 104, 105 and 106 cells per mL samples, respectively. In fact, these values are considerably higher than the bacteria plate count results. However, the fluorescent die used here stains both live and dead bacteria as well as viable non-culturable (VBNC) cells present in the sample. Hence, this difference was expected considering that the plate counting technique only counts viable bacteria, which are capable of forming colonies (i.e., colony forming units, CFU per mL instead of total cells per mL).
The developed device offers many advantages due to cost-effectiveness and can be incorporated into a carrying case that is 3D printed or fashioned from aluminum or other materials for improved portability. This 3D-printed portable particle counter prototype costs around $1370 US dollars in materials and equipment (provided that the user already has a laptop computer) which is significantly lower than the cost of a commercial Beckman Coulter counter ($16700 US dollars) or a flow cytometer (∼$50000 US dollars). With its simple label-free sample preparation, our prototype could be used in resource-limited field settings. Additionally, our system offers an option to perform particle image velocimetry which is not available with Beckman Coulter counter. Particle velocities can be calculated using track data obtained from particle counter code, using manual observation and PIVlab software. This PIV data can be used to obtain forces acting on particles and might further be useful in clinical applications like deformability-based cell sorting41 or performing assays based on measuring the mechanical properties of biomaterials.42 The future work on this topic will focus on improving the portability of our platform and expanding its diagnostic capabilities.
Conflicts of interest
There are no conflicts of interest to declare.Acknowledgements
JJJ acknowledges financial support from the National Science Foundation (award number 1560138) through the Multiscale Sensing Actuation and Imaging (MoSAIc) research experience for undergraduates program in the Department of Mechanical Engineering at Iowa State University. CLG and CCP acknowledge funding support from the National Science Foundation under award numbers CBET-1756999 and 1706994. The authors also acknowledge the National Institute of Food and Agriculture, US Department of Agriculture, award number 2019-05855.References
- D. M. Morens, G. K. Folkers and A. S. Fauci, The Challenge of Emerging and Re-Emerging Infectious Diseases, Nature, 2004, 430(6996), 242–249, DOI:10.1038/nature02759.
- H. M. Shapiro, Practical Flow Cytometry, John Wiley & Sons, 2005 Search PubMed.
- A. L. Givan, Flow Cytometry First Principles, Wiley-Liss, New York, 2nd edn, 2001 Search PubMed.
- A. Rajawat and S. Tripathi, Disease Diagnostics Using Hydrodynamic Flow Focusing in Microfluidic Devices: Beyond Flow Cytometry, Biomed. Eng. Lett., 2020, 10(2), 241–257, DOI:10.1007/s13534-019-00144-6.
- M. E. Piyasena and S. W. Graves, The Intersection of Flow Cytometry with Microfluidics and Microfabrication, Lab Chip, 2014, 14(6), 1044–1059, 10.1039/C3LC51152A.
- B. S. Edwards, J. Zhu, J. Chen, M. B. Carter, D. M. Thal, J. J. G. Tesmer, S. W. Graves and L. A. Sklar, Cluster Cytometry for High-Capacity Bioanalysis, Cytometry, Part A, 2012, 81(5), 419–429, DOI:10.1002/cyto.a.22039.
- C. M. Pitsillides, J. M. Runnels, J. A. Spencer, L. Zhi, M. X. Wu and C. P. Lin, Cell Labeling Approaches for Fluorescence-Based in Vivo Flow Cytometry, Cytometry, Part A, 2011, 79(10), 758–765, DOI:10.1002/cyto.a.21125.
- H. Zhu, S. Mavandadi, A. F. Coskun, O. Yaglidere and A. Ozcan, Optofluidic Fluorescent Imaging Cytometry on a Cell Phone, Anal. Chem., 2011, 83(17), 6641–6647, DOI:10.1021/ac201587a.
- H. Zhu and A. Ozcan, Wide-Field Fluorescent Microscopy and Fluorescent Imaging Flow Cytometry on a Cell-Phone, J. Visualized Exp., 2013,(74), e50451, DOI:10.3791/50451.
- S. M. Hampson, W. Rowe, S. D. R. Christie and M. Platt, 3D Printed Microfluidic Device with Integrated Optical Sensing for Particle Analysis, Sens. Actuators, B, 2018, 256, 1030–1037, DOI:10.1016/j.snb.2017.10.041.
- K. Kadimisetty, A. P. Spak, K. S. Bhalerao, M. Sharafeldin, I. M. Mosa, N. H. Lee and J. F. Rusling, Automated 4-Sample Protein Immunoassays Using 3D-Printed Microfluidics, Anal. Methods, 2018, 10(32), 4000–4006, 10.1039/C8AY01271G.
- G. Papadakis, A. K. Pantazis, M. Ntogka, K. Parasyris, G.-I. Theodosi, G. Kaprou and E. Gizeli, 3D-Printed Point-of-Care Platform for Genetic Testing of Infectious Diseases Directly in Human Samples Using Acoustic Sensors and a Smartphone, ACS Sens., 2019, 4(5), 1329–1336, DOI:10.1021/acssensors.9b00264.
- K. Kadimisetty, J. Song, A. M. Doto, Y. Hwang, J. Peng, M. G. Mauk, F. D. Bushman, R. Gross, J. N. Jarvis and C. Liu, Fully 3D Printed Integrated Reactor Array for Point-of-Care Molecular Diagnostics, Biosens. Bioelectron., 2018, 109, 156–163, DOI:10.1016/j.bios.2018.03.009.
- S. M. Knowlton, I. Sencan, Y. Aytar, J. Khoory, M. M. Heeney, I. C. Ghiran and S. Tasoglu, Sickle Cell Detection Using a Smartphone, Sci. Rep., 2015, 5(1), 15022, DOI:10.1038/srep15022.
- B. Yenilmez, S. Knowlton and S. Tasoglu, Self-Contained Handheld Magnetic Platform for Point of Care Cytometry in Biological Samples, Adv. Mater. Technol., 2016, 1(9), 1600144, DOI:10.1002/admt.201600144.
- M. Zarei, Advances in Point-of-Care Technologies for Molecular Diagnostics, Biosens. Bioelectron., 2017, 98, 494–506, DOI:10.1016/j.bios.2017.07.024.
- M. Yang, Y. Liu and X. Jiang, Barcoded Point-of-Care Bioassays, Chem. Soc. Rev., 2019, 48(3), 850–884, 10.1039/C8CS00303C.
- P. M. Lelliott, M. Momota, M. S. J. Lee, E. Kuroda, N. Iijima, K. J. Ishii and C. Coban, Rapid Quantification of NETs In Vitro and in Whole Blood Samples by Imaging Flow Cytometry, Cytometry, Part A, 2019, 95(5), 565–578, DOI:10.1002/cyto.a.23767.
- T. Blasi, H. Hennig, H. D. Summers, F. J. Theis, J. Cerveira, J. O. Patterson, D. Davies, A. Filby, A. E. Carpenter and P. Rees, Label-Free Cell Cycle Analysis for High-Throughput Imaging Flow Cytometry, Nat. Commun., 2016, 7(1), 10256, DOI:10.1038/ncomms10256.
- A. Filby and J. P. Houston, Imaging Cytometry: Automated Morphology and Feature Extraction, Cytometry, Part A, 2017, 91(9), 851–853, DOI:10.1002/cyto.a.23200.
- A. Skandarajah, C. D. Reber, N. A. Switz and D. A. Fletcher, Quantitative Imaging with a Mobile Phone Microscope, PLoS One, 2014, 9(5), e96906, DOI:10.1371/journal.pone.0096906.
- D. Xu, X. Huang, J. Guo and X. Ma, Automatic Smartphone-Based Microfluidic Biosensor System at the Point of Care, Biosens. Bioelectron., 2018, 110, 78–88, DOI:10.1016/j.bios.2018.03.018.
- Thingiverse.com. DIY Linear Translational Stage – Micrometer resolution by Musti https://www.thingiverse.com/thing:144838 (accessed Mar 24, 2020).
- Thingiverse.com. Platform Jack [Fully Assembled, No Supports] by Intentional3D https://www.thingiverse.com/thing:925556 (accessed Mar 24, 2020).
- J. C. Contreras-Naranjo, H.-J. Wu and V. M. Ugaz, Microfluidics for Exosome Isolation and Analysis: Enabling Liquid Biopsy for Personalized Medicine, Lab Chip, 2017, 17(21), 3558–3577, 10.1039/C7LC00592J.
- How to Clean Laboratory Glassware, https://www.sigmaaldrich.com/technical-documents/articles/labware/cleaning-glassware.html (accessed Mar 24, 2020).
- FlyCapture SDK | FLIR Systems, https://www.flir.com/products/flycapture-sdk/ (accessed Mar 24, 2020).
- J. C. Crocker and D. G. Grier, Methods of Digital Video Microscopy for Colloidal Studies, J. Colloid Interface Sci., 1996, 179(1), 298–310, DOI:10.1006/jcis.1996.0217.
- W. Thielicke and E. Stamhuis, PIVlab – Towards User-Friendly, Affordable and Accurate Digital Particle Image Velocimetry in MATLAB, J. Open Res. Software, 2014, 2(1), e30, DOI:10.5334/jors.bl.
- W. Thielicke, The Flapping Flight of Birds: Analysis and Application, [S.n.], 2014 Search PubMed.
- J. Burkart, G. Steiner, G. Reischl, H. Moshammer, M. Neuberger and R. Hitzenberger, Characterizing the Performance of Two Optical Particle Counters (Grimm OPC1.108 and OPC1.109) under Urban Aerosol Conditions, J. Aerosol Sci., 2010, 41(10), 953–962, DOI:10.1016/j.jaerosci.2010.07.007.
- J. Vermot, S. E. Fraser and M. Liebling, Fast Fluorescence Microscopy for Imaging the Dynamics of Embryonic Development, HFSP J., 2008, 2(3), 143–155, DOI:10.2976/1.2907579.
- M. Spiga and G. L. Morino, A Symmetric Solution for Velocity Profile in Laminar Flow through Rectangular Ducts, Int. Commun. Heat Mass Transfer, 1994, 21(4), 469–475, DOI:10.1016/0735-1933(94)90046-9.
- M. Frank, D. Anderson, E. R. Weeks and J. F. Morris, Particle Migration in Pressure-Driven Flow of a Brownian Suspension, J. Fluid Mech., 2003, 493, 363–378 CrossRef.
- R. J. Phillips, R. C. Armstrong, R. A. Brown, A. L. Graham and J. R. Abbott, A Constitutive Equation for Concentrated Suspensions That Accounts for Shear–induced Particle Migration, Phys. Fluids A, 1992, 4(1), 30–40, DOI:10.1063/1.858498.
- M. G. Olsen and R. J. Adrian, Brownian Motion and Correlation in Particle Image Velocimetry, Opt. Laser Technol., 2000, 32(7), 621–627, DOI:10.1016/S0030-3992(00)00119-5.
- M. G. Olsen and R. J. Adrian, Out-of-Focus Effects on Particle Image Visibility and Correlation in Microscopic Particle Image Velocimetry, Exp. Fluids, 2000, 29(1), S166–S174, DOI:10.1007/s003480070018.
- M. R. Bown, J. M. MacInnes and R. W. K. Allen, Micro-PIV Simulation and Measurement in Complex Microchannel Geometries, Meas. Sci. Technol., 2005, 16(3), 619–626, DOI:10.1088/0957-0233/16/3/002.
- Bacteriological Analytical Manual (BAM), https://www.fda.gov/food/laboratory-methods-food/bacteriological-analytical-manual-bam (accessed May 24, 2021).
- J. D. Oliver, Recent Findings on the Viable but Nonculturable State in Pathogenic Bacteria, FEMS Microbiol. Rev., 2010, 34(4), 415–425, DOI:10.1111/j.1574-6976.2009.00200.x.
- E. Islamzada, K. Matthews, Q. Guo, A. T. Santoso, S. P. Duffy, M. D. Scott and H. Ma, Deformability Based Sorting of Stored Red Blood Cells Reveals Donor-Dependent Aging Curves, Lab Chip, 2020, 20(2), 226–235, 10.1039/C9LC01058K.
- K. Joyner, D. Song, R. F. Hawkins, R. D. Silcott and G. A. Duncan, A Rational Approach to Form Disulfide Linked Mucin Hydrogels, Soft Matter, 2019, 15(47), 9632–9639, 10.1039/C9SM01715A.
Footnote |
| † Electronic supplementary information (ESI) available. See DOI: 10.1039/d1an00778e |
| This journal is © The Royal Society of Chemistry 2021 |