
 Open Access Article
 This Open Access Article is licensed under a Creative Commons Attribution-Non Commercial 3.0 Unported Licence
A multiplexed, automated immuno-matrix assisted laser desorption/ionization mass spectrometry assay for simultaneous and precise quantitation of PTEN and p110α in cell lines and tumor tissues†
Bjoern C.
Froehlich
ab,
Robert
Popp
a,
Constance A.
Sobsey
c,
Sahar
Ibrahim
c,
Andre
LeBlanc
c,
Yassene
Mohammed
ade,
Marguerite
Buchanan
f,
Adriana
Aguilar-Mahecha
f,
Oliver
Pötz
gh,
Michael X.
Chen
 i,
Alan
Spatz
f,
Mark
Basik
f,
Gerald
Batist
fj,
René P.
Zahedi
ce and
Christoph H.
Borchers
*abcej
i,
Alan
Spatz
f,
Mark
Basik
f,
Gerald
Batist
fj,
René P.
Zahedi
ce and
Christoph H.
Borchers
*abcej
aUniversity of Victoria – Genome BC Proteomics Centre, University of Victoria, Victoria, British Columbia V8Z 7X8, Canada
bDepartment of Biochemistry and Microbiology, University of Victoria, Victoria, British Columbia V8P 5C2, Canada
cSegal Cancer Proteomics Centre, Lady Davis Institute, Jewish General Hospital, McGill University, Montreal, QC H3T1E2, Canada
dCenter for Proteomics and Metabolomics, Leiden University Medical Center, Leiden, The Netherlands
eCenter for Computational and Data-Intensive Science and Engineering, Skolkovo Institute of Science and Technology, Moscow 121205, Russia
fSegal Cancer Centre, Lady Davis Institute, Jewish General Hospital, McGill University, Montreal, QC H3T1E2, Canada
gNMI Natural and Medical Sciences Institute at the University of Tuebingen, Reutlingen 72770, Germany
hSIGNATOPE GmbH, Reutlingen 72770, Germany
iDepartment of Pathology and Laboratory Medicine, Faculty of Medicine, University of British Columbia, Vancouver, Canada
jGerald Bronfman Department of Oncology, Jewish General Hospital, McGill University, Montreal, QC H4A3T2, Canada. E-mail: christoph.borchers@mcgill.ca; Tel: +514-340-8222 x7886
First published on 21st September 2021
Abstract
The PI3-kinase/AKT/mTOR pathway plays a central role in cancer signaling. While p110α is the catalytic α-subunit of PI3-kinase and a major drug target, PTEN is the main negative regulator of the PI3-kinase/AKT/mTOR pathway. PTEN is often down-regulated in cancer, and there are conflicting data on PTEN's role as breast cancer biomarker. PTEN and p110α protein expression in tumors is commonly analyzed by immunohistochemistry, which suffers from poor multiplexing capacity, poor standardization, and antibody crossreactivity, and which provides only semi-quantitative data. Here, we present an automated, and standardized immuno-matrix-assisted laser desorption/ionization mass spectrometry (iMALDI) assay that allows precise and multiplexed quantitation of PTEN and p110α concentrations, without the limitations of immunohistochemistry. Our iMALDI assay only requires a low-cost benchtop MALDI-TOF mass spectrometer, which simplifies clinical translation. We validated our assay's precision and accuracy, with simultaneous enrichment of both target proteins not significantly affecting the precision and accuracy of the quantitation when compared to the PTEN- and p110α-singleplex iMALDI assays (<15% difference). The multiplexed assay's linear range is from 0.6–20 fmol with accuracies of 90–112% for both target proteins, and the assay is free of matrix-related interferences. The inter-day reproducibility over 5-days was high, with an overall CV of 9%. PTEN and p110α protein concentrations can be quantified down to 1.4 fmol and 0.6 fmol per 10 μg of total tumor protein, respectively, in various tumor tissue samples, including fresh-frozen breast tumors and colorectal cancer liver metastases, and patient-derived xenograft (PDX) tumors.
1. Introduction
Targeted therapies that selectively inhibit key proteins in oncogenic signaling networks have emerged as new and promising method to treat cancer patients.1 It has been shown for different combinations of drugs and cancers, that this type of targeted treatment is more effective in tumors that have specific molecular signatures, and that the availability of specific biomarkers can greatly enhance patients’ overall survival.2,3 Cancer biomarkers that are currently being used in the clinic for patient stratification include specific genomic markers, such as BRAF mutations in melanoma or KRAS mutational status in colorectal cancer, as well as protein markers whose expression levels are typically assessed by immunohistochemistry, such as PD-L1 in lung cancer.4–6 For certain cancers and drugs, however, it has become evident that the current practice of patient stratification can still lead to unexpectedly low response rates. One reason for these low response-rates is that changes on the genome and transcriptome level do not necessarily correlate with the proteome and vice versa.7,8 Thus, genomic biomarkers do not readily reflect the activity and/or expression of a drug's target protein or pathway.9–12 Moreover, the expression of protein biomarkers is typically assessed by immunohistochemistry (IHC),13–15 which is poorly standardized, strongly depends on antibody-specificity, suffers from interference from post-translational modifications, and provides only subjective and semi-quantitative data (e.g. “amplified” vs. “normal”).14,16,17 There is therefore an urgent need for improved and standardized methods that enable the precise measurement of protein biomarkers as surrogates of oncogenic pathway activity which can either complement genomic biomarkers or assist in IHC-based patient stratification.The PI3K/AKT/mTOR pathway controls cell proliferation, survival, and apoptosis, and is one of the most frequently altered pathways in cancer, including breast and colorectal cancer. The PI3K/AKT/mTOR pathway is, therefore, a major drug target. Up to 40 different inhibitors are currently being investigated in pre-clinical and clinical trials, and several inhibitors have already received FDA approval.18–22 Some of these, however, show unexpectedly low response rates.2,20,23
The PI3K catalytic subunit p110α and the phosphatase and tensin homolog (PTEN), which is the main negative regulator of the PI3K/AKT/mTOR pathway, are frequently mutated and dysregulated in many cancers, and are considered as strong indicators of PI3K pathway activity.7,24–30 The precise and standardized quantitation of these proteins in individual tumors should, therefore, help to improve patient stratification for treatments that target the PI3K/AKT/mTOR pathway, and thus help to overcome the problem of low response rates.
Targeted mass spectrometry (MS) using stable isotope labeled standard (SIS) peptides is a robust technology that enables the precise and standardized measurement of protein concentrations without facing the limitations of IHC. The measurement of actual protein concentrations in tumors using a standardized platform enables the comparison of results that were obtained in different laboratories and at different times, thus allowing the generation of reference ranges and facilitating the correlation of biomarker concentrations with clinical outcomes, which is virtually impossible for IHC. Targeted MS is usually performed using liquid chromatography coupled with multiple or parallel reaction monitoring (LC-MRM or LC-PRM) to achieve high sensitivity, reproducibility, and selectivity. LC-based approaches, however, suffer from comparatively long analysis times (commonly 15–60 minutes per sample) and require relatively expensive and sophisticated instrumentation.
In contrast, protein quantitation using immuno-matrix-assisted laser-desorption ionization (iMALDI) time-of flight (TOF) mass spectrometry is a powerful alternative methodology that combines antibody-based peptide enrichment with quantitation by MALDI-TOF MS to achieve high selectivity, sensitivity, and precision. Moreover, MALDI requires only a few seconds of analysis-time on bench-top MALDI-TOF instruments such as the Bruker Microflex, which is an FDA-approved instrument that is already present in many clinical laboratories for microbial identification. In iMALDI, endogenous proteins are first enzymatically digested to release the endogenous proteotypic peptide (END) that is specifically targeted by the anti-peptide antibody. Then, a defined amount of the SIS analogue of this peptide is spiked into the sample, and both the END and SIS peptides are simultaneously enriched using the anti-peptide antibody coupled to magnetic beads, followed by direct analysis using MALDI-TOF MS. We have previously demonstrated that quantifying cancer signaling pathway proteins by iMALDI requires as little as 10 μg of total protein per measurement, which is in-line with the severely limited amounts of tissue that can be obtained for many clinical samples.31
Here, we demonstrate for the first time that iMALDI assays can be multiplexed using both simultaneous and sequential enrichment of target peptides. Multiplexing does not only increase the throughput of iMALDI assays, but it also allows the quantitation of several members of the PI3K pathway without the need to consume more sample material.
2. Materials and methods
All major iMALDI liquid handling steps were conducted using a BRAVO liquid handling system (Agilent Technologies), as described previously.32iMALDI method validation (linearity, accuracy, precision, interference) is described in the ESI.†
2.1 Reagents
Reagents were purchased from Sigma Aldrich (St Louis, MO) unless specified otherwise. LC-MS grade water and LC-MS grade acetonitrile were purchased from Thermo Fisher (Waltham, MA). NAT, SIS (R + 10 Da), and double-SIS (dSIS) (R + 10 Da, L + 7 Da) standards of the PTEN peptide 148AQEALDFYGEVR159 and the p110α peptide 503EAGFSYSHAGLSNR516 were synthesized by the University of Victoria Genome BC Proteomics Centre (PTEN NAT, SIS) and by SynPeptide, Shanghai/China (PTEN dSIS, p110α NAT, SIS, dSIS), respectively. Peptide purities and concentrations were determined by capillary zone electrophoresis and amino acid analysis, respectively.33,34Anti-AQEALDFYGEVR (PTEN) and anti-EAGFSYSHAGLSNR (p110α) rabbit polyclonal antibodies were obtained from Signatope (Reutlingen, Germany). Protein G Dynabeads were obtained from Invitrogen (Carlsbad, CA, USA). Trypsin (TLCK treated) was purchased from Worthington (Lakewood, NJ, USA). A Bravo 96 LT liquid handling robot (Agilent Technologies), equipped with a tip wash station and a plate shaker, was used for assay automation. Samples were analysed using a Microflex LRT MALDI-TOF MS (Bruker Daltonics, Bremen, Germany). μFocus MALDI target plates were purchased from Hudson Surface Technologies (Suwon, S. Korea).
2.2 iMALDI workflow
![[thin space (1/6-em)]](https://www.rsc.org/images/entities/char_2009.gif) :75 acetonitrile:(PBS + 0.015% (w:w) CHAPS (PBSC)) and 3× PBSC buffer, using 1:10 bead-slurry:buffer (v:v). After the final wash, the beads were reconstituted in PBSC, followed by addition of 0.2 μg anti-peptide antibodies per 30 μg beads and incubation for 1 h at room temperature while rotating. Immediately prior to use, the antibody-coupled beads were washed with 3× PBSC and reconstituted in PBSC to a concentration of 0.01 μg antibody per μL.
:2 (w:w) protein:trypsin, followed by quenching using Nα-Tosyl-L-lysine chloromethyl ketone hydrochloride (TLCK). The target peptides were enriched using 0.2 μg antibody coupled to 30 μg Protein G Dynabeads per replicate and 1 h incubation at room temperature. Then, the antigen–antibody–bead complexes were washed 1× with PBS + 0.015% CHAPS (PBSC) and 3× with 5 mM ammonium bicarbonate. The beads were then spotted onto a MALDI target plate. After the spots were dry, HCCA matrix (3 mg mL−1 α-cyano-4-hydroxycinnamic acid, 7 mM ammonium citrate (dibasic) in 70% acetonitrile (ACN), 0.1% trifluoroacetic acid (Thermo Fisher)) was spotted on top. After drying, the spots were washed 3× with 7 mM ammonium citrate and analyzed using a Bruker Microflex LRT in both linear positive (LP) and reflectron positive (RP) ion mode. Liquid handling steps were automated using an Agilent Bravo 96 LT.
:75 acetonitrile:(PBS + 0.015% (w:w) CHAPS (PBSC)) and 3× PBSC buffer, using 1:10 bead-slurry:buffer (v:v). After the final wash, the beads were reconstituted in PBSC, followed by addition of 0.2 μg anti-peptide antibodies per 30 μg beads and incubation for 1 h at room temperature while rotating. Immediately prior to use, the antibody-coupled beads were washed with 3× PBSC and reconstituted in PBSC to a concentration of 0.01 μg antibody per μL.
:2 (w:w) protein:trypsin, followed by quenching using Nα-Tosyl-L-lysine chloromethyl ketone hydrochloride (TLCK). The target peptides were enriched using 0.2 μg antibody coupled to 30 μg Protein G Dynabeads per replicate and 1 h incubation at room temperature. Then, the antigen–antibody–bead complexes were washed 1× with PBS + 0.015% CHAPS (PBSC) and 3× with 5 mM ammonium bicarbonate. The beads were then spotted onto a MALDI target plate. After the spots were dry, HCCA matrix (3 mg mL−1 α-cyano-4-hydroxycinnamic acid, 7 mM ammonium citrate (dibasic) in 70% acetonitrile (ACN), 0.1% trifluoroacetic acid (Thermo Fisher)) was spotted on top. After drying, the spots were washed 3× with 7 mM ammonium citrate and analyzed using a Bruker Microflex LRT in both linear positive (LP) and reflectron positive (RP) ion mode. Liquid handling steps were automated using an Agilent Bravo 96 LT.
2.3 Preparation of cell and tissue samples
E. coli BL21 DE3 cells were grown overnight in lysogeny broth (10 g L−1 Tryptone, 10 g L−1 NaCl, 5 g L−1 yeast extract) at 37 °C. Cells were pelleted and resuspended in PBS (pH 7.4). Protein extraction was performed using T-PER buffer (Thermo Fisher).MDA-MB 231 cell lysates were prepared as previously described.31 Briefly, cells were grown overnight at 37 °C and 5% CO2, followed by overnight starvation in 0.25% fetal bovine serum and harvesting at 80% confluency.
Cells were pelleted, and protein extraction was performed using T-PER buffer (4 °C, Thermo Fisher) containing 1× halt protease and 1× halt phosphatase inhibitor (Thermo Fisher), supported by sonication. Protein concentration was determined using a BCA assay (Thermo Fisher).
E. coli, MDA-MB 231, and tissue lysates were diluted to a concentration of 0.1 μg protein per μL using cold TRIS supplemented with 0.015% CHAPS (TRIS + C). Each sample was divided into 100 μL aliquots (with 10 μg total protein, each).
All patients provided informed consent, breast cancer tissues were collected as part of the Jewish General Hospital (JGH) breast biobank (protocol 05–06), and gastric tumor and colorectal cancer liver metastasis samples were collected as part of the JGH central biobank (protocol #10-153). Protocols were reviewed and approved by the local JGH REB committee. PDXs from the gastric cancer tumor were generated as previously reported,35 all experiments were performed in accordance with the protocol approved by the Lady Davis Institute/McGill University animal care committee.
2.4 Evaluation of iMALDI multiplexing strategies
Sequential enrichment was performed by coupling Protein G Dynabeads to either anti-AQEALDFYGEVR (PTEN) or anti-EAGFSYSHAGLSNR (p110α) antibodies, and then using these antibody–bead complexes to separately enrich the target peptides from different sample aliquots. For each sample, 30 μg of coupled beads were used, and the samples were incubated while shaking at 1000 rpm for 1 h at room temperature. Beads were washed as described above. Before the first wash step, the supernatant was transferred to a fresh 1.1 mL U-bottom deep well plate, and 30 μg of beads coupled to the second antibody were added (i.e. if anti-PTEN antibodies were used in the first enrichment, anti-p110α antibodies were added during the second enrichment), for the second immuno-enrichment. The antigen–antibody–bead complexes were washed and spotted on a MALDI plate.For simultaneous enrichment (PTEN/p110α), anti-PTEN and anti-p110α coupled beads were mixed in a 1:1 ratio prior to enrichment. Thirty μg of the bead mixture (containing 15 μg anti-PTEN and anti-p110α antibody coupled beads each) were added to each sample. After a 1 h incubation at room temperature while shaking at 1000 rpm, the antigen–antibody–bead complexes (containing both target peptides) were washed and spotted on a MALDI plate as described above.
3. Results and discussion
3.1 Multiplexed analysis of PTEN and p110α using iMALDI is feasible
Previously, we have systematically optimized and evaluated the workflow for iMALDI assays, including antibody-coupling to different bead types, optimization of the tryptic digestion, and comparing different calibration and quantitation strategies.32The multiplexing of iMALDI assays allows the precise quantification of different protein targets in a single sample without the need for additional sample material. This is particularly relevant for clinical samples, including needle biopsy samples or formalin-fixed paraffin-embedded (FFPE) tissue cores and slides, where the available sample amounts are often severely limited, while the demand for measuring biomarker panels for patient stratification is high.
We, therefore, evaluated two different strategies of multiplexing iMALDI assays and compared these to the classical singleplex enrichment with regard to efficacy and robustness: simultaneous enrichment and sequential enrichment of both target peptides (Fig. 1A). While simultaneous enrichment is a faster and more straightforward workflow, sequential enrichment is preferred in cases where either the antibodies used interfere with each other or the different END and SIS peptides have very similar molecular masses and may result in overlapping peaks in MALDI-TOF MS.
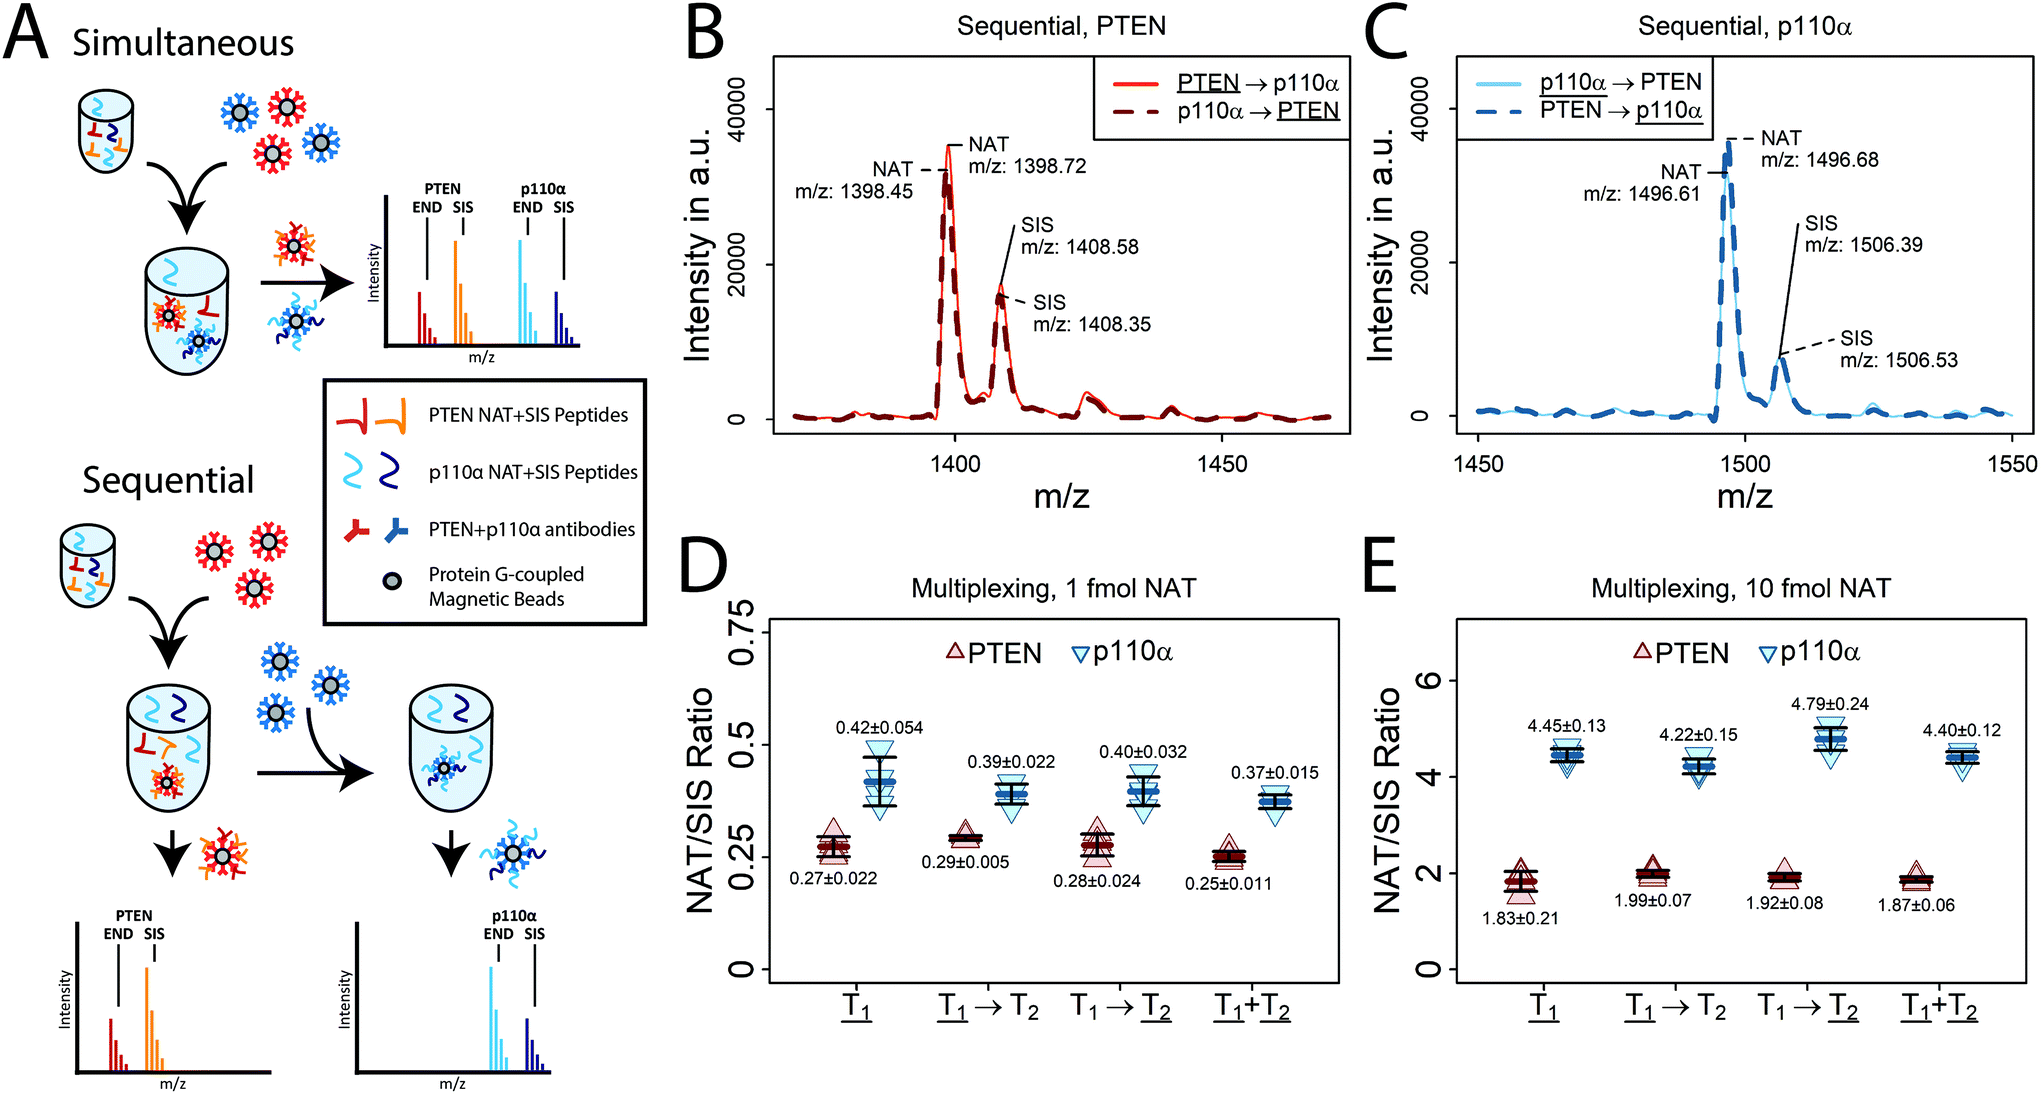 | ||
Fig. 1 Multiplexed PTEN/p110α iMALDI assay. (A) E. coli digest was spiked with either 1 fmol or 10 fmol PTEN and p110α NAT peptides and 2.5 fmol of the corresponding SIS peptides, followed by PTEN and p110α enrichment, either sequentially or simultaneously. Both multiplexing strategies were compared to the PTEN and p110α singleplex iMALDI assays. AKT2 dSIS peptide (THF+10PQFSYSASIR+10E) was spiked into the MALDI matrix (1 fmol per spot) as an external standard (n = 4 per condition). (B + C) Representative MALDI TOF MS spectra of 10 fmol PTEN NAT and p110α NAT after sequential enrichment as either first (T1) or second target (T2) (D + E) Comparison of PTEN and p110α peptide enrichment performed as singleplex (![[T with combining low line]](https://www.rsc.org/images/entities/b_char_0054_0332.gif) 1), sequential enrichment with PTEN/p110α enriched either as first (1 before T2) or second (T1 before 2) target, or simultaneous enrichment of both peptides (1+ 2). NAT/SIS ratios were calculated for both the (D) 1 fmol and (E) 10 fmol NAT spike-in samples, showing no significant differences in accuracy and precision between all strategies. 1), sequential enrichment with PTEN/p110α enriched either as first (1 before T2) or second (T1 before 2) target, or simultaneous enrichment of both peptides (1+ 2). NAT/SIS ratios were calculated for both the (D) 1 fmol and (E) 10 fmol NAT spike-in samples, showing no significant differences in accuracy and precision between all strategies. | ||
The two multiplexing methods were compared using E. coli digest (10 μg total protein per replicate) that was spiked with either 1 fmol or 10 fmol NAT, and 2.5 fmol SIS peptides for PTEN and p110α (n = 4 for each tested NAT concentration and multiplexing strategy). For both PTEN and p110α, the NAT/SIS ratios showed good agreement between the multiplexed and singleplex assays, with mean NAT/SISmultiplex and NAT/SISsingleplex ratios of 0.99 (1 fmol NAT) and 0.95 (10 fmol NAT) for PTEN, as well as 0.92 (1 fmol NAT) and 1.00 (10 fmol NAT) for p110α. High precision was also achieved using the multiplexed assays (CVMean_PTEN = 4%, CVMean_p110α = 5%), which was comparable to the singleplexed assays (CVMean_PTEN = 10%, CVMean_p110α = 8%) (Fig. 1D and E; ESI Table S1†).
Peptide recoveries of the 1 fmol NAT spike-in, as determined from the peak-intensity ratios of enriched NAT and AKT2 dSIS peptides, were 25–30% lower using simultaneous enrichment compared to sequential enrichment (with the target peptide being enriched first), though this difference was not significant (p > 0.01) (ESI Fig. S1;† ESI Table S2†). Using sequential enrichment, the order of enrichment did not lead to significant differences, for either PTEN (Fig. 1B) or p110α (Fig. 1C).
These results indicate that multiplexed PTEN/p110α iMALDI is feasible without compromising assay accuracy or precision. All of the subsequent steps in the validation and application of the multiplexed PTEN/p110α iMALDI assay were performed using simultaneous enrichment because of its more straightforward and simple workflow, compared to sequential enrichment.
3.2 Validation of our multiplexed PTEN and p110α iMALDI assay
After confirming that reduction and alkylation of Cys residues, a central part of our AKT1 and AKT2 iMALDI assays, could be omitted for PTEN and p110α (ESI Fig. S2,† ESI Table S3†), we validated our simultaneous multiplexed PTEN/p110α iMALDI assay's precision and accuracy (referring to the surrogate peptide).31,36To assess linearity of our assay, we prepared a calibration curve using MDA-MB-231 digest (10 μg total protein per replicate), which was spiked with constant amounts of PTEN and p110α SIS (2.5 fmol per replicate) and varying amounts of PTEN dSIS and p110α dSIS (PTEN + p110α dSIS) (ranging from 0–50 fmol per replicate). The samples were analysed in both linear positive (LP) and reflectron positive (RP) ion modes (Fig. 2A and B; ESI Fig. S3A, S3B; ESI Tables S4 and S5†). Because of the heteroscedasticity of the calibration data, weighted linear regression (WLS) is preferred over ordinary least squares regression (OLS) in mass-spectrometry based assays.37
 | ||
| Fig. 2 Method validation of the multiplexed PTEN + p110α iMALDI assay. All data shown was recorded in the linear positive ion mode. 10 μg of MDA-MB-231 digest were spiked with varying amounts of PTEN + p110α dSIS peptides and 2.5 fmol PTEN and p110α SIS as normalizer. (A) Calibration curve (n = 3): The linear range is from 0.6–20 fmol and (B) all means within that range were within a ±15% error margin of the regression. (C) To determine accuracy, PTEN + p110α dSIS amounts were determined based on dSIS/SIS ratios and compared to the theoretical spike-ins. (n = 4). (D) For interference testing, 10 μg MDA-MB-231 lysate (total protein) was spiked with 15 fmol of recombinant PTEN and p110α/p85α, respectively, and diluted 2-, 4-, and 8-fold prior to tryptic digestion. | ||
In the LP mode, the linear range of the assay was from 0.6 to 20 fmol on-spot, with R2 values of 0.99 and CVs consistently below 15% for both PTEN and p110α (Fig. 2A and B). The lower-limit of quantitation (LLOQ) was 0.7 fmol of peptide on-spot for both targets, as previously determined, with CVs of <20%, thus meeting the FDA requirements for bioanalytical method validation (ESI Fig. S4A†).32,36 The sensitivity of our iMALDI assay is comparable to immuno-enrichment based LC-MS assays. For example, our recently developed immuno-MRM assay for PTEN quantitation in cancer cells achieved LLOQs of 1 fmol on-column.38 In the RP mode, the linear range of the assay was from 1.25 to 50 fmol on-spot with R2 values of 0.98 (PTEN) and 0.99 (p110α), and CVs of <20% (for >0.6 fmol peptide on-spot) (ESI Fig. S3B and S4B†). Based on our previous experience, we did not expect any target protein concentrations above 20 fmol per 10 μg total lysate protein, so we used the linear range of the assay in LP mode as the working range for our assay.38 This is also advantageous for further adoption of this technology by clinical laboratories, since not all MALDI-MS instruments used in clinics have a reflectron mode.
To evaluate the accuracy of our multiplexed PTEN/p110α iMALDI assay, we used 10 μg of a MDA-MB-231 cell lysate that had been spiked with (i) 2, 10, or 18 fmol of PTEN dSIS plus p110α dSIS, corresponding to 10%, 50%, and 90% of the linear range in LP (designated as low, medium, and high levels, respectively), and (ii) 2.5 fmol of PTEN SIS and p110α SIS. PTEN and p110α dSIS amounts were determined based on dSIS/SIS ratios and were compared to the theoretical spike-in amounts (Fig. 2C; ESI Fig. S3C;† ESI Tables S6 and S7†). Calibration curves were prepared in BSA digest as the surrogate matrix. In the LP mode, high accuracies were achieved for both PTEN (102%, 100%, and 90% for low, medium, and high levels, respectively) and p110α (112%, 105%, 97% for low, medium, and high levels, respectively), all of which were well within the FDA's cut-off of ±20% for immunoassays, with CVs of 2 to 6%.36 Comparably high accuracies were achieved in the RP mode for both target peptides (PTEN: 99%, 109%, and 112%; and p110α: 105%, 107%, and 108%, for low, medium, and high levels, respectively), with CVs ranging from 2 to 7%.
These results demonstrate that our multiplexed PTEN/p110α iMALDI assay provides high accuracy and precision across its entire working range.
To test for dilutional linearity from the matrix, recombinant PTEN and p110α/p85α protein were spiked into MDA-MB-231 cell lysate to give a final concentration of 1.5 fmol recombinant protein per μg of total lysate protein. The sample was diluted 2-, 4-, and 8-fold with PBS + 0.015% CHAPS buffer (PBSC), followed by tryptic digestion and mutliplexed iMALDI analysis. To evaluate the potential impact of trypsin, we kept the total amount of trypsin constant, thus successively decreasing the protein:trypsin ratio (w:w) from 1:2 to 1:16, and performed a linear regression analysis on the serially diluted samples (Fig. 2D; ESI Fig. S3D;† ESI Tables S8 and S9†), as interfering peaks from trypsin would lead to non-linear signal responses. For both PTEN and p110α, high linear coefficients of determination were found across the dilution series (R2 of 0.996 and 0.995 for PTEN and p110α, respectively). A comparison of MALDI-TOF spectra of non-diluted and 8-fold diluted samples showed a highly similar non-specific background, confirming that there is minimal interference from both the matrix and trypsin (ESI Fig. S6†).
These results demonstrate that our multiplexed PTEN/p110α iMALDI assay is free from interferences caused by trypsin and confirm that it is robust even when different protein:trypsin ratios are used. Importantly, our data also demonstrate dilutional linearity: samples can still be reliably analysed even after an 8-fold dilution, with CVs ranging from 2 to 7%. Thus, even though the linear range of the assay is comparatively narrow (0.6–20 fmol), it is still applicable to samples with higher PTEN and/or p110α concentrations or higher amounts of starting material.
To test the intra- and inter-day precision of our multiplexed PTEN/p110α iMALDI assay, three pools of MDA-MB-231 cell lysate were prepared. The pools were then spiked with 2, 10, or 18 fmol of PTEN + p110α dSIS per 10 μg of total protein, respectively, corresponding to the low, medium, and high levels of the assay's linear range. Each pool (low, medium, high) was divided into 5 aliquots of 10 μg, which were stored at −80 °C. For five consecutive days, one fresh aliquot of each pool was analysed using our multiplexed iMALDI assay. To assess precision, intra- and inter-day CVs and total CVs were calculated according to ESI eqn (1) (Fig. 3; ESI Fig. S5;† ESI Tables S10–S13†).
 | ||
| Fig. 3 Inter- and intra-day precision of the multiplexed PTEN/p110α iMALDI assay. Three pools of MDA-MB-231 lysate were spiked with 2, 10, or 18 fmol of PTEN + p110α dSIS, corresponding to 10%, 50%, and 90% of the assay's linear range (low, medium, and high levels, respectively). One fresh aliquot from each pool was analyzed each day for five consecutive days in triplicate. Data was recorded in the linear positive ion mode. (A + C) The deviation from the 5-day mean for low, medium, and high samples is given for (A) PTEN and (C) p110α. (B + D) Intra-day CVs and 5-day inter-day CVs for low, medium, and high-level samples. An outlier (amount quantified >3rd quartile5-day ‘low’ results + 3× Interquartile Range5-day ‘low’ results) was excluded from the ‘low’ sample on Day 4. | ||
For PTEN the average intra-day CVs were 3%, 5%, and 5%, while the inter-day CVs were 6%, 10%, and 9% for low, medium, and high levels, respectively (Fig. 3A). For p110α, the average intra-day CVs were 4%, 6%, and 4%, while the inter-day CVs were 4%, 10%, and 7% for low, medium, and high levels, respectively (Fig. 3B).
These data indicate that our multiplexed PTEN/p110α iMALDI assay is highly reproducible throughout its linear range, with mean total CVs over all experiments and days of 9.5% for PTEN and 8.4% for p110α in the LP mode, and similarly low CVs (14.7% and 12.4%) in the RP mode.
3.3 Multiplexed quantitation of PTEN and p110α in tissue samples
Having validated our multiplexed iMALDI assay, we then evaluated the performance of the assay for the quantitation of endogenous PTEN and p110α in tumor tissue samples. The assay was used to analyze fresh-frozen (FF) tissue samples from a mouse patient-derived xenograft (PDX) model, which underwent three consecutive drug trials, two of which were reported previously.35 The samples used in this study originated from the third drug trial, where trastuzumab-resistant gastric tumors were transplanted into 12 mice, which were either treated with trastuzumab (Tra) at 5 mg kg−1 intraperitoneal once a week, everolimus (Ev) at 5 mg kg−1 daily gavage, both trastuzumab and everolimus (Tra-Ev) at the same concentrations and schedule, or served as untreated controls (Ctrl). The tumors showed PIK3CA mutations (c317G > T), but no PTEN deletions.Trastuzumab is a monoclonal antibody that targets the HER2 receptor, while Everolimus is an mTOR inhibitor that can be used in locally advanced or metastasized gastrointestinal cancers. The combination of Trastuzumab and Everolimus is a potential combinatorial treatment for patients who are HER2-positive but have aberrant PI3K/AKT/mTOR-pathway activation, which is associated with resistance to Trastuzumab therapy.39 The Tra-Ev group showed a partial response to the treatment, with two animals showing stable disease and one animal showing a partial response based on RECIST guidelines.40 The other groups showed progressive disease. In all samples (except for one out of three animals in the control group), we were able to quantify both proteins from only 10 μg of total protein extract with high reproducibility (the median CV across duplicates was <6%) (Fig. 4A and B; ESI Tables S14 and S15†). While PI3K expression levels were stable across the different samples, showing no significant differences (Ctrl: 0.4 ± 0.5 fmol per 10 μg; Tra: 0.8 ± 0.2 fmol per 10 μg; Ev: 0.9 ± 0.2 fmol per 10 μg; Tra-Ev: 0.9 ± 0.2 fmol per 10 μg), the PTEN expression levels appeared to be up-regulated upon treatment in 2 out of the 3 treatment groups (Ctrl: 2.0 ± 2.0 fmol per 10 μg; Tra: 3.6 ± 0.5 fmol per 10 μg; Ev: 4.6 ± 1.0 fmol per 10 μg; Tra-Ev: 4.2 ± 0.5 fmol per 10 μg), although these differences were not statistically significant due to the high variability in the control group. This dose-dependant upregulation of PTEN expression upon treatment with Everolimus has previously been reported for A549 cells, while PI3K levels have been reported as being reduced upon Everolimus treatment.41,42
 | ||
| Fig. 4 Multiplexed quantitation of PTEN and p110α in human tissue samples. (A) Endogenous PTEN and p110α were quantified in fresh-frozen (FF) tissue samples which were part of a mouse-PDX drug study. Trastuzumab resistant gastric tumors were transplanted into 12 mice and were either treated with Trastuzumab, Everolimus, or Trastuzumab + Everolimus (Tra-Ev), or not treated (control). (B) Mass spectrum of a control group sample showing PTEN and p110α END peaks as well as SIS + dSIS standard. (C) Endogenous PTEN and p110α concentrations in various FF breast tumor (B) and colorectal cancer liver metastasis (L) tissue samples (10 μg total protein per replicate). (D) MALDI TOF spectrum of sample L #4 showing the endogenous PTEN and p110α target peptides as well as the SIS and dSIS standards with low non-specific background. | ||
We further analyzed fresh-frozen tissue samples of four colorectal cancer liver metastases and five breast cancer tumors using exactly the same workflow, and we again were able to quantify both proteins in all samples with high reproducibility (the median CV across 3 technical replicates was ≤10%), using only 10 μg of total protein extract. While PI3K shows a surprisingly stable protein expression level across the two tumor tissues – from 0.6 to 1.2 fmol per 10 μg of total protein in both colorectal cancer liver metastases (mCRC, 0.9 ± 0.3 fmol per 10 μg) and breast tumors (0.8 ± 0.4 fmol per 10 μg) – the protein expression levels of PTEN showed a higher variability (mCRC: 2.0 ± 1.2 fmol per 10 μg; breast tissue: 2.0 ± 1.0 fmol per 10 μg).
We compared our ‘absolute’ PTEN and PI3K protein levels to the ProteinAtlas database, which shows higher RNA expression levels for PTEN than for PI3K in both breast cancer (9.4 vs. 3.9 Fragments Per Kilobase Million (FKPM) in >1000 breast cancer samples) and colorectal cancer (6.1 vs. 1.9 FKPM in >590 colorectal cancer samples).43–45 Notably, although the number of analyzed samples in the ProteinAtlas database is much higher than in this study, the difference between colorectal cancer and breast cancer RNA and protein expression levels may reflect the known low correlation between the transcriptome and the proteome, and thus may underscore the need for precise protein assays to quantify relevant cancer genes on the protein level, where cancer drugs act.7,8
In addition, these results clearly demonstrate the selectivity of the antibody enrichment, even from complex samples. We generally observe a very low background with only few peaks apart from the target analytes and their SIS in the acquired mass spectra (ESI Fig. S7†).
In summary, our results show that our validated multiplexed PTEN/p110α iMALDI assay is fit-for-purpose for high-throughput analysis of tumor samples. In addition, our data show surprisingly robust expression levels of PTEN from fresh-frozen PDX samples and from breast tumors and colorectal cancer liver metastases.
4. Conclusions
We developed and validated an automated, rapid (same-day results), and multiplexed iMALDI assay for quantifying PTEN and p110α. Our assay requires as little as 0.2 μg of antibody per sample and the MS readout requires only a low-cost benchtop MALDI-TOF MS which is already present in many clinical laboratories. We validated the linearity of our assay, and found it to be linear from 0.6 fmol to 20 fmol on-spot, with an LLOQ of 0.7 fmol for both protein targets. The accuracy was 90–102% for PTEN and 97–112% for p110α, and the intra- and inter-day precision was below 15%.36Using this assay, we were able to quantify endogenous PTEN and p110α in cancer cell lines as well fresh-frozen tumor tissue samples, including a PDX model of trastuzumab-resistant gastric tumor. We were able to detect small changes in the expression levels of PTEN upon treatment with Everolimus and Everolimus + Trastuzumab, which are in agreement with data in the literature, and the differences between PI3K and PTEN protein expression levels were in good agreement with transcriptomic data for breast cancer and colorectal cancer, while concurrently underlining the discrepancy between transcriptome readouts and absolute protein expression levels.
While the multiplexed iMALDI assay presented here focuses on the PI3K pathway, iMALDI methods can be modified/expanded to cover other pathways by including additional anti-peptide antibody enrichment steps for other protein targets. There is, however, a limit on how many proteins can be multiplexed using iMALDI, based on the amounts of antibody-coupled beads that can be loaded on the MALDI plate. In our hands, bead amounts exceeding 30 μg lead to quenched signals and thus poor quantitative recovery. This drawback can potentially be solved by choosing different bead types and MALDI plate spot sizes.32 Moreover, the linear range of MALDI MS typically covers no more than two orders of magnitude, which in our experience, however, is sufficient to cover the fold-changes that occur in biological samples. Notably, the high specificity of anti-peptide immuno-enrichment minimizes potential interferences, despite the lack of an additional step to reduce sample complexity as in LC-MS.
Conflicts of interest
CHB is the Chief Scientific Officer of MRM Proteomics, Inc. RPZ is the Chief Executive Officer of MRM Proteomics Inc. The other authors declare no competing financial interests.Acknowledgements
The authors are grateful to Genome Canada and Genome British Columbia for financial support through the Genomics Innovation Network (project codes 204PRO for operations and 214PRO for technology development), and 264PRO. We are also grateful for financial support from Genome Canada, Genome British Columbia, and Genome Quebec through the Genomics Applications Partnership Program (GAPP: 183AKT), from Genome Canada and Genome Quebec through the Genomics Applications Partnership Program (GAPP: PD-L1), and from the Terry Fox Research Institute. The authors are also grateful for support from the Quebec Cancer Consortium, Ministère de l’Économie et de l'Innovation, Quebec. CHB is also grateful for support from the Leading Edge Endowment Fund (University of Victoria), for support from the Segal McGill Chair in Molecular Oncology at McGill University (Montreal, Quebec, Canada), and for support from the Warren Y. Soper Charitable Trust and the Alvin Segal Family Foundation to the Jewish General Hospital (Montreal, Quebec, Canada). The study was also supported by the MegaGrant of the Ministry of Science and Higher Education of the Russian Federation (Agreement with Skolkovo Institute of Science and Technology, No. 075-10-2019-083). The JGH Breast Biobank is supported by FRQS Réseau Recherche Cancer and Quebec Breast Cancer Foundation. The authors are grateful to Dr John Burke for providing the recombinant p110α/p85α protein.This work was done under the auspices of a Memorandum of Understanding between the University of Victoria, McGill University, and the U.S. National Cancer Institute's International Cancer Proteogenome Consortium (ICPC). ICPC encourages international cooperation among institutions and nations in proteogenomic cancer research in which proteogenomic datasets are made available to the public. This work was also done in collaboration with the U.S. National Cancer Institute's Clinical Proteomic Tumor Analysis Consortium (CPTAC).
References
- K. Dhingra, Ann. Oncol., 2015, 26, 2347–2350 CrossRef CAS PubMed.
- P. B. Chapman, A. Hauschild, C. Robert, J. B. Haanen, P. Ascierto, J. Larkin, R. Dummer, C. Garbe, A. Testori, M. Maio, D. Hogg, P. Lorigan, C. Lebbe, T. Jouary, D. Schadendorf, A. Ribas, S. J. O'Day, J. A. Sosman, J. M. Kirkwood, A. M. M. Eggermont, B. Dreno, K. Nolop, J. Li, B. Nelson, J. Hou, R. J. Lee, K. T. Flaherty and G. A. McArthur, N. Engl. J. Med., 2011, 364, 2507–2516 CrossRef CAS PubMed.
- F. A. Sinicrope, K. Okamoto, P. M. Kasi and H. Kawakami, Clin. Gastroenterol. Hepatol., 2016, 14, 651–658 CrossRef CAS PubMed.
- L. Cheng, A. Lopez-Beltran, F. Massari, G. T. MacLennan and R. Montironi, Mod. Pathol., 2018, 31, 24–38 CrossRef CAS PubMed.
- A. Lièvre, J.-B. Bachet, D. Le Corre, V. Boige, B. Landi, J.-F. Emile, J.-F. Côté, G. Tomasic, C. Penna, M. Ducreux, P. Rougier, F. Penault-Llorca and P. Laurent-Puig, Cancer Res., 2006, 66, 3992–3995 CrossRef PubMed.
- H. Yu, T. A. Boyle, C. Zhou, D. L. Rimm and F. R. Hirsch, J. Thorac. Oncol., 2016, 11, 964–975 CrossRef PubMed.
- J. D. Lapek, P. Greninger, R. Morris, A. Amzallag, I. Pruteanu-Malinici, C. H. Benes and W. Haas, Nat. Biotechnol., 2017, 35, 983–989 CrossRef CAS PubMed.
- L. Li, Y. Wei, C. To, C.-Q. Zhu, J. Tong, N.-A. Pham, P. Taylor, V. Ignatchenko, A. Ignatchenko, W. Zhang, D. Wang, N. Yanagawa, M. Li, M. Pintilie, G. Liu, L. Muthuswamy, F. A. Shepherd, M. S. Tsao, T. Kislinger and M. F. Moran, Nat. Commun., 2014, 5, 5469 CrossRef CAS PubMed.
- M. Chen and J. L. Manley, Nat. Rev. Mol. Cell Biol., 2009, 10, 741–754 CrossRef CAS PubMed.
- N. C. Correia, A. Gírio, I. Antunes, L. R. Martins and J. T. Barata, Eur. J. Cancer, 2014, 50, 216–225 CrossRef CAS PubMed.
- M. A. Dawson and T. Kouzarides, Cell, 2012, 150, 12–27 CrossRef CAS PubMed.
- X. Wan, X. Ding, S. Chen, H. Song, H. Jiang, Y. Fang, P. Li and J. Guo, Tumor Biol., 2015, 36, 521–532 CrossRef CAS PubMed.
- A. de Gramont, S. Watson, L. M. Ellis, J. Rodón, J. Tabernero, A. de Gramont and S. R. Hamilton, Nat. Rev. Clin. Oncol., 2015, 12, 197–212 CrossRef PubMed.
- L. L. De Matos, D. C. Trufelli, M. G. L. De Matos and M. A. Da Silva Pinhal, Biomarker Insights, 2010, 5, 9–20 CrossRef PubMed.
- J. Mateo, G. Ganji, C. Lemech, H. A. Burris, S.-W. Han, K. Swales, S. Decordova, M. P. DeYoung, D. A. Smith, S. Kalyana-Sundaram, J. Wu, M. Motwani, R. Kumar, J. M. Tolson, S. Y. Rha, H. C. Chung, J. P. Eder, S. Sharma, Y.-J. Bang, J. R. Infante, L. Yan, J. S. de Bono and H.-T. Arkenau, Clin. Cancer Res., 2017, 23, 5981–5992 CrossRef CAS PubMed.
- G. O'Hurley, E. Sjöstedt, A. Rahman, B. Li, C. Kampf, F. Pontén, W. M. Gallagher and C. Lindskog, Mol. Oncol., 2014, 8, 783–798 CrossRef PubMed.
- C. A. Morales-Betanzos, H. Lee, P. I. Gonzalez Ericsson, J. M. Balko, D. B. Johnson, L. J. Zimmerman and D. C. Liebler, Mol. Cell. Proteomics, 2017, 16, 1705–1717 CrossRef CAS PubMed.
- J. Baselga, M. Campone, M. Piccart, H. A. Burris, H. S. Rugo, T. Sahmoud, S. Noguchi, M. Gnant, K. I. Pritchard, F. Lebrun, J. T. Beck, Y. Ito, D. Yardley, I. Deleu, A. Perez, T. Bachelot, L. Vittori, Z. Xu, P. Mukhopadhyay, D. Lebwohl and G. N. Hortobagyi, N. Engl. J. Med., 2012, 366, 520–529 CrossRef CAS PubMed.
- R. R. Furman, J. P. Sharman, S. E. Coutre, B. D. Cheson, J. M. Pagel, P. Hillmen, J. C. Barrientos, A. D. Zelenetz, T. J. Kipps, I. Flinn, P. Ghia, H. Eradat, T. Ervin, N. Lamanna, B. Coiffier, A. R. Pettitt, S. Ma, S. Stilgenbauer, P. Cramer, M. Aiello, D. M. Johnson, L. L. Miller, D. Li, T. M. Jahn, R. D. Dansey, M. Hallek and S. M. O'Brien, N. Engl. J. Med., 2014, 370, 997–1007 CrossRef CAS PubMed.
- F. Janku, T. A. Yap and F. Meric-Bernstam, Nat. Rev. Clin. Oncol., 2018, 15, 273–291 CrossRef CAS PubMed.
- R. J. Motzer, B. Escudier, S. Oudard, T. E. Hutson, C. Porta, S. Bracarda, V. Grünwald, J. A. Thompson, R. A. Figlin, N. Hollaender, G. Urbanowitz, W. J. Berg, A. Kay, D. Lebwohl and A. Ravaud, Lancet, 2008, 372, 8 CrossRef.
- G. Hudes, J. Dutcher, E. Staroslawska, I. Bodrogi, I. G. H. Schmidt-Wolf, T. O'Toole and L. Moore, N. Engl. J. Med., 2007, 11 Search PubMed.
- U. Banerji, E. J. Dean, J. A. Pérez-Fidalgo, G. Batist, P. L. Bedard, B. You, S. N. Westin, P. Kabos, M. D. Garrett, M. Tall, H. Ambrose, J. C. Barrett, T. H. Carr, S. Y. A. Cheung, C. Corcoran, M. Cullberg, B. R. Davies, E. C. de Bruin, P. Elvin, A. Foxley, P. Lawrence, J. P. O. Lindemann, R. Maudsley, M. Pass, V. Rowlands, P. Rugman, G. Schiavon, J. Yates and J. H. M. Schellens, Clin. Cancer Res., 2018, 24, 2050–2059 CrossRef CAS PubMed.
- K. E. Bachman, P. Argani, Y. Samuels, N. Silliman, J. Ptak, S. Szabo, H. Konishi, B. Karakas, B. G. Blair, C. Lin, B. A. Peters, V. E. Velculescu and B. H. Park, Cancer Biol. Ther., 2004, 3, 772–775 CrossRef CAS PubMed.
- S. A. Danielsen, P. W. Eide, A. Nesbakken, T. Guren, E. Leithe and R. A. Lothe, Biochim. Biophys. Acta, Rev. Cancer, 2015, 1855, 104–121 CrossRef CAS PubMed.
- J. Huang, L. Zhang, J. Greshock, T. A. Colligon, Y. Wang, R. Ward, D. Katsaros, H. Lassus, R. Butzow, A. K. Godwin, J. R. Testa, K. L. Nathanson, P. A. Gimotty, G. Coukos, B. L. Weber and Y. Degenhardt, Genes, Chromosomes Cancer, 2011, 50, 606–618 CrossRef CAS PubMed.
- J. S. Lee, H. W. Lee, E. H. Lee, M. Park, J. S. Lee, M.-S. Kim, T. G. Kim, H.-Y. Nam, S. W. Hwang and J. H. Park, Int. J. Clin. Exp. Pathol., 2018, 1554–1561 Search PubMed.
- S. Li, Y. Shen, M. Wang, J. Yang, M. Lv, P. Li, Z. Chen and J. Yang, Oncotarget, 2017, 8, 32043–32054 CrossRef PubMed.
- A. Sartore-Bianchi, M. Martini, F. Molinari, S. Veronese, M. Nichelatti, S. Artale, F. Di Nicolantonio, P. Saletti, S. De Dosso, L. Mazzucchelli, M. Frattini, S. Siena and A. Bardelli, Cancer Res., 2009, 69, 1851–1857 CrossRef CAS PubMed.
- C. Stamatkin, K. L. Ratermann, C. W. Overley and E. P. Black, Cancer Biol. Ther., 2015, 16, 1341–1352 CrossRef CAS PubMed.
- R. Popp, H. Li, A. LeBlanc, Y. Mohammed, A. Aguilar-Mahecha, A. G. Chambers, C. Lan, O. Poetz, M. Basik, G. Batist and C. H. Borchers, Anal. Chem., 2017, 89, 10592–10600 CrossRef CAS PubMed.
- B. C. Froehlich, R. Popp, C. A. Sobsey, S. Ibrahim, A. M. LeBlanc, Y. Mohammed, A. Aguilar-Mahecha, O. Poetz, M. X. Chen, A. Spatz, M. Basik, G. Batist, R. P. Zahedi and C. H. Borchers, PROTEOMICS: Clin. Appl., 2020, 2000034 CAS.
- M. A. Kuzyk, C. E. Parker, D. Domanski and C. H. Borchers, Methods Mol. Biol., 2013, 1023, 53–82 CrossRef CAS PubMed.
- A. J. Percy, A. G. Chambers, C. E. Parker and C. H. Borchers, Methods Mol. Biol., 2013, 1000, 167–189 CrossRef CAS PubMed.
- A. Aguilar-Mahecha, S. Joseph, L. Cavallone, M. Buchanan, U. Krzemien, G. Batist and M. Basik, Front. Oncol., 2019, 9, 698 CrossRef PubMed.
- Food and Drug Administration, Bioanalytical Method Validation Guidance for Industry, 2018, p. 44 Search PubMed.
- H. Gu, G. Liu, J. Wang, A.-F. Aubry and M. E. Arnold, Anal. Chem., 2014, 86, 8959–8966 CrossRef CAS PubMed.
- S. Ibrahim, B. C. Froehlich, A. Aguilar-Mahecha, R. Aloyz, O. Poetz, M. Basik, G. Batist, R. P. Zahedi and C. H. Borchers, Anal. Chem., 2020, 92, 12407–12414 CrossRef CAS PubMed.
- K. Berns, H. M. Horlings, B. T. Hennessy, M. Madiredjo, E. M. Hijmans, K. Beelen, S. C. Linn, A. M. Gonzalez-Angulo, K. Stemke-Hale, M. Hauptmann, R. L. Beijersbergen, G. B. Mills, M. J. van de Vijver and R. Bernards, Cancer Cell, 2007, 12, 395–402 CrossRef CAS PubMed.
- E. A. Eisenhauer, P. Therasse, J. Bogaerts, L. H. Schwartz, D. Sargent, R. Ford, J. Dancey, S. Arbuck, S. Gwyther, M. Mooney, L. Rubinstein, L. Shankar, L. Dodd, R. Kaplan, D. Lacombe and J. Verweij, Eur. J. Cancer, 2009, 45, 228–247 CrossRef CAS PubMed.
- X. Xiang, L. Zhuang, H. Chen, X. Yang, H. Li, G. Li and J. Yu, Oncol. Lett., 2019, 18, 5269–5276 CAS.
- L. Du, X. Li, L. Zhen, W. Chen, L. Mu, Y. Zhang and A. Song, Mol. Med. Rep., 2018, 17, 7163–7169 CAS.
- M. Uhlen, C. Zhang, S. Lee, E. Sjöstedt, L. Fagerberg, G. Bidkhori, R. Benfeitas, M. Arif, Z. Liu, F. Edfors, K. Sanli, K. von Feilitzen, P. Oksvold, E. Lundberg, S. Hober, P. Nilsson, J. Mattsson, J. M. Schwenk, H. Brunnström, B. Glimelius, T. Sjöblom, P.-H. Edqvist, D. Djureinovic, P. Micke, C. Lindskog, A. Mardinoglu and F. Ponten, Science, 2017, 357, eaan2507 CrossRef PubMed.
- Expression of PIK3CA in cancer - Summary - The Human Protein Atlas, https://www.proteinatlas.org/ENSG00000121879-PIK3CA/pathology, (accessed July 20, 2020).
- Expression of PTEN in cancer - Summary - The Human Protein Atlas, https://www.proteinatlas.org/ENSG00000171862-PTEN/pathology, (accessed July 20, 2020).
Footnote |
| † Electronic supplementary information (ESI) available. See DOI: 10.1039/d1an00165e |
| This journal is © The Royal Society of Chemistry 2021 |