
 Open Access Article
 This Open Access Article is licensed under a Creative Commons Attribution-Non Commercial 3.0 Unported Licence
ATR-FTIR spectroscopy and spectroscopic imaging to investigate the behaviour of proteins subjected to freeze–thaw cycles in droplets, wells, and under flow†
Hannah
Tiernan
ab,
Bernadette
Byrne
 *b and
Sergei G.
Kazarian
*a
*b and
Sergei G.
Kazarian
*a
aDepartment of Chemical Engineering, Imperial College London, South Kensington Campus, SW7 2AZ, London, UK. E-mail: s.kazarian@imperial.ac.uk
bDepartment of Life Sciences, Imperial College London, South Kensington Campus, SW7 2AZ, London, UK. E-mail: b.byrne@imperial.ac.uk
First published on 8th March 2021
Abstract
Biopharmaceuticals are used to treat a range of diseases from arthritis to cancer, however, since the advent of these highly specific, effective drugs, there have been challenges involved in their production. The most common biopharmaceuticals, monoclonal antibodies (mAbs), are vulnerable to aggregation and precipitation during processing. Freeze thaw cycles (FTCs), which can be required for storage and transportation, can lead to a substantial loss of product, and contributes to the high cost of antibody production. It is therefore necessary to monitor aggregation levels at susceptible points in the production pathway, such as during purification and transportation, thus contributing to a fuller understanding of mAb aggregation and providing a basis for rational optimisation of the production process. This paper uses attenuated total reflection Fourier transform infrared (ATR-FTIR) spectroscopy and spectroscopic imaging to investigate the effect of these potentially detrimental FTCs on protein secondary structure in both static wells and under flowing conditions, using lysozyme as a model protein. The results revealed that the amount of protein close to the surface of the ATR crystal, and hence level of aggregates, increased with increasing FTCs. This was observed both within wells and under flow conditions, using conventional ATR-FTIR spectroscopy and ATR-FTIR spectroscopic imaging. Interestingly, we also observed changes in the Amide I band shape indicating an increase in β-sheet contribution, and therefore an increase in aggregates, with increasing number of FTCs. These results show for the first time how ATR-FTIR spectroscopy can be successfully applied to study the effect of FTC cycles on protein samples. This could have numerous broader applications, such as in biopharmaceutical production and rapid diagnostic testing.
1. Introduction
The global market for biopharmaceuticals is estimated to be worth over $275 billion in 2020, and is still growing at a rate of 12% annually.1 Monoclonal antibodies (mAbs) are used to treat a range of diseases such as arthritis, diabetes, and some neurodegenerative diseases and cancers.2,3 MAbs are utilised extensively due to their exceptional ability to identify and bind to cell surface targets with high specificity.4 However, when compared to traditional small molecule pharmaceuticals, mAbs are less stable due to the complexity of their structure and function. This instability leads to problems of mAb aggregation in production and delivery.5Aggregation is more prevalent at certain points in the production pathway where the protein is placed under extreme stress. Typically this occurs at points of high oxidative,6 thermal,7 and mechanical stress,8 under repetitive FTCs,7 and at interface agitation.9 Intentional freezing of protein product can occur at multiple points in the production pathway, for example, lyophilisation,10 storage,11 and during transportation. Transportation related stresses can include agitation, shaking, and/or foaming.12 Freezing is used to ensure stability and quality of biopharmaceutical product due to the slowdown of reaction rates which would lead to product related degradants. Freezing also enables batch processing, reduces the risk of microbial growth, increases shelf life, and eliminates the risk of agitation during transportation. The stability of biopharmaceuticals is therefore reinforced by freezing, as both chemical and physical degradation can be reduced. Freezing can ultimately be used to maximise protein stability throughout the supply chain.
However, there are several challenges associated with ensuring FTCs do not compromise drug quality. The rate of freezing and thawing has a significant impact on stability. Fast freezing rates can for example lead to smaller ice-crystal formation, exposing proteins to a larger ice-liquid interface, increasing aggregation, and therefore negatively impacting biological activity.13,14 Slower freezing rates can result in cryoconcentration, in which proteins and excipients form concentration gradients near the freeze front and get excluded from the ice-liquid interface. This could initiate pH shifts and phase separation, causing protein structural damage, and affecting protein thermodynamic stability leading to unfolding and aggregation.15,16 Using size exclusion chromatography (SEC) and micro flow imaging, previous research has shown that slower thawing led to higher protein aggregation, which was exacerbated by fast freezing and increasing the number of FTCs from 1 to 3. Interestingly, they also found these effects were similar on large (6.2 L), and small (30 mL and 100 mL) scale systems.17
Currently, mass spectrometry (MS), nuclear magnetic resonance (NMR), and high-pressure liquid chromatography (HPLC) are employed in industry to investigate the aggregation of mAbs and their stability under stress conditions. However, these techniques have stringent sample pre-requisites. Fourier transform infrared (FTIR) spectroscopy is a label-free, non-destructive technique. It is currently used in industry to monitor essential processing points in biopharmaceutical manufacturing, and to characterise biopharmaceuticals. ATR-FTIR spectroscopy is utilised for monitoring monoclonal antibody purification18 and the structural stability of biopharmaceuticals including Bevacizumab®,19 Humatrope®,20 and Humalog®.21 This technique is also utilised to monitor monoclonal antibody purification,18 to characterise glycosylation,22 and to monitor mAb IgG3 cell culture process dynamics in real time.23 Amide I (∼1650 cm−1) and Amide II (∼1545 cm−1) spectral bands are used for most analyses of proteins, as they enable the identification of the secondary structure of biopharmaceuticals.24–28
ATR-FTIR spectroscopy is a well-known technique, but ATR-FTIR spectroscopic imaging is less widely used. Instead of collecting an averaged single spectrum, ATR-FTIR spectroscopic imaging (when used with a 64 × 64 focal plane array (FPA) detector), collects 4096 separate spectra and compiles them into a single image. Spectral chemical images obtained are interactive and offer the ability to evaluate different measured areas, therefore increasing the high throughput capability and efficiency of the spectral measurement. ATR-FTIR spectroscopic imaging has many benefits; it is non-destructive, requires minimal sample preparation, and can be used to study complex and heterogeneous samples and solutions under flow, as recently reviewed.29 Small scale flow models can be integrated into the macro spectroscopic set-up, ideal for investigating the impact of freezing and thawing on protein stability. Ewing et al. combined FTIR spectroscopic imaging with flow devices to investigate the effect of flow on ibuprofen dissolution,30 while Chan et al. used it to study live mammalian cells with high spatial resolution.31 Other recent research has shown the distribution of protein (specifically IgG) is not uniform within 6 μm in the z direction from the ATR crystal in wells,32 and Boulet-Audet et al. have demonstrated the application of ATR-FTIR spectroscopic imaging to high-throughput thermal stability assays.33
Here we implemented ATR-FTIR spectroscopy and spectroscopic imaging to explore the impact of FTCs on the stability and aggregation of proteins using lysozyme solutions as test material. Lysozyme solution was used as it displays similar changes under stress conditions as alternate proteins such as IgG monoclonal antibodies.34 The results show a relationship between FTC number and both aggregation status of the protein and changes in the secondary structure. The findings of this study also demonstrate the power of ATR-FTIR spectroscopy and spectroscopic imaging for the detailed analysis of protein solutions under flow. This research could pave the way for future research in this area for example, exploring the effects of instant and slow thawing effects.
2. Materials and methods
2.1 Sample preparation
Lysozyme from chicken egg white in lyophilized powder (protein ≥90%, ≥40![[thin space (1/6-em)]](https://www.rsc.org/images/entities/char_2009.gif) 000 units per mg protein (Merck, Germany)) was made up into a 30 mg ml−1 solution in water. Samples were freshly prepared and underwent FTCs within 12 hours. All experiments were completed within one week of initial sample preparation.
000 units per mg protein (Merck, Germany)) was made up into a 30 mg ml−1 solution in water. Samples were freshly prepared and underwent FTCs within 12 hours. All experiments were completed within one week of initial sample preparation.
2.2 FTIR spectroscopy and spectroscopic imaging
FTIR spectral measurements were collected using an Alpha II spectrometer (Bruker, U.K.), spectra were acquired in continuous scan mode, by coadding 64 scans at 4 cm−1 resolution and were collected over a range of 900 to 3900 cm−1. Macro ATR-FTIR spectroscopic images were obtained using a Tensor 27 spectrometer (Bruker, U.K.) coupled to an IMAC large sample compartment (Bruker, U.K.). This macro ATR-FTIR spectroscopic imaging setup comprised a cooled MCT focal plane array (FPA) detector, displaying 64 × 64 elements and collecting 4098 spectra simultaneously, and a Specac single reflection ATR attachment. Spectra were acquired in continuous scan mode, by coadding 64 scans at 8 cm−1 resolution and collected over a range of 900 to 3900 cm−1.The Specac attachment consists of single reflection optics at a fixed angle of incidence, with a ZnSe internal reflection element (IRE). PDMS wells or flowing channel devices were placed and secured on the ZnSe surface using an in-built attachment top clamp or Perspex sheeting secured with screws to the top-plate of the attachment. Lysozyme solution was flowed through these channels using a syringe inlet pump (Harvard Apparatus) at set flow rates of 10 μl min−1 and 20 μl min−1.
2.3 Experimental procedure
The 300 μl, 30 mg ml−1, lysozyme samples were subjected to FTCs on a schedule of room temperature (∼23 °C) for 2 h, and −80 °C for 0.5 h for 1, 2, 3, 4 or 5 cycles. The individual FTC samples were pipetted onto the ATR diamond crystal of the Alpha II immediately after the FTCs were completed, and static measurements collected after 0, 5, 10, 15 and 20 minutes on the ATR surface. Between each measurement the ZnSe crystal was cleaned with pure water and ethanol. For imaging, PDMS wells and channels were created by 3D printing master devices, and then casting PDMS devices (Fig. 4(B)). Protein solutions were either pipetted into wells or flowed through the PDMS channels so the solution was in contact with the surface of the ATR ZnSe crystal, again this occurred immediately after the FTCs were completed. For flow experiments, a flow rate of 10 μl min−1, for 10 min, or 20 μl min−1 for 10 min was used. Therefore, a total of 100 μl for 10 μl min−1 and 200 μl for 20 μl min−1 of each sample was used to flow for each experiment, and spectral images were collected after 10 minutes. The ZnSe crystal remained at room temperature to remove any superfluous factors which could contribute to aggregation of protein samples.2.4 Data analysis
Spectra were processed using OPUS (Bruker Technologies), and subsequent data analysis operations were performed by MATLAB (MathWorks, Natick, MA) and/or Origin (OriginLab, Northampton, MA). For imaging, the spectra of pixels indicated (Fig. 3(C) and 4(A)) were extracted and averaged in order to represent protein distribution throughout the indicated area. This equated to around 576 pixels or a 48 × 12 pixel rectangle for flow images. Images were obtained by plotting the integrated absorbance of the Amide I band, between 1700 and 1600 cm−1. The subtraction of spectral bands of liquid water was carried out, and data was baseline corrected to allow effective comparison.3. Results and discussion
3.1 ATR-FTIR spectroscopy of protein samples subjected FTCs
Following a specified number of FTCs, the infrared spectra obtained for the individual 30 mg ml−1 lysozyme samples were analysed using primarily the Amide I band, but also the Amide II band. For acquisition of ATR-FTIR spectra, a background spectrum was collected before each sample deposition, 4 μl sample was pipetted onto the diamond ATR crystal surface, and an FTIR spectrum of liquid water and water vapour was subtracted from protein spectra, with three repeats carried out for each experiment. Spectral measurements were collected at 0, 5, 10, 15 and 20 min after initial deposition, and were Savitzky–Golay 9 point smoothed (Fig. 1(A)). The Amide I absorbance was measured from a baseline of 0. The spectra show that increasing the number of FTCs results in increased protein deposition on the ATR crystal indicative of higher levels of aggregation, as illustrated by increased Amide I and Amide II absorbances (Fig. 1(A and B)). Amide I peaks do not definitively show specific structural contributions, therefore second derivative analysis of the Amide I band (Fig. 1(C)) was used to demonstrate the difference between spectral measurements after 0 and 20 min on the surface of the crystal, revealing increased Amide I absorbance after 20 min but very similar peak positions as with the 0 min sample. Fig. 1(D), shows the second derivate spectra after 1 and 5 FTCs of the same sample, here the peak positions have changed with an increasing number of FTCs, indicating a change in the protein structure. The most significant of which is a shift from 1654 to 1649, in the Amide I band region (1600–1700 cm−1) which indicates an increase in aggregation.28 The protein spectra subjected to 5 FTCs also has observable shoulders, particularly at 1658, 1650, 1645 and 1636 cm−1, indicating the changes in structural contributions of β-sheet to the overall Amide I band, for example, a movement of band maxima from 1654 to 1650 indicates a decrease in α-helical content and an increase in β-sheet content.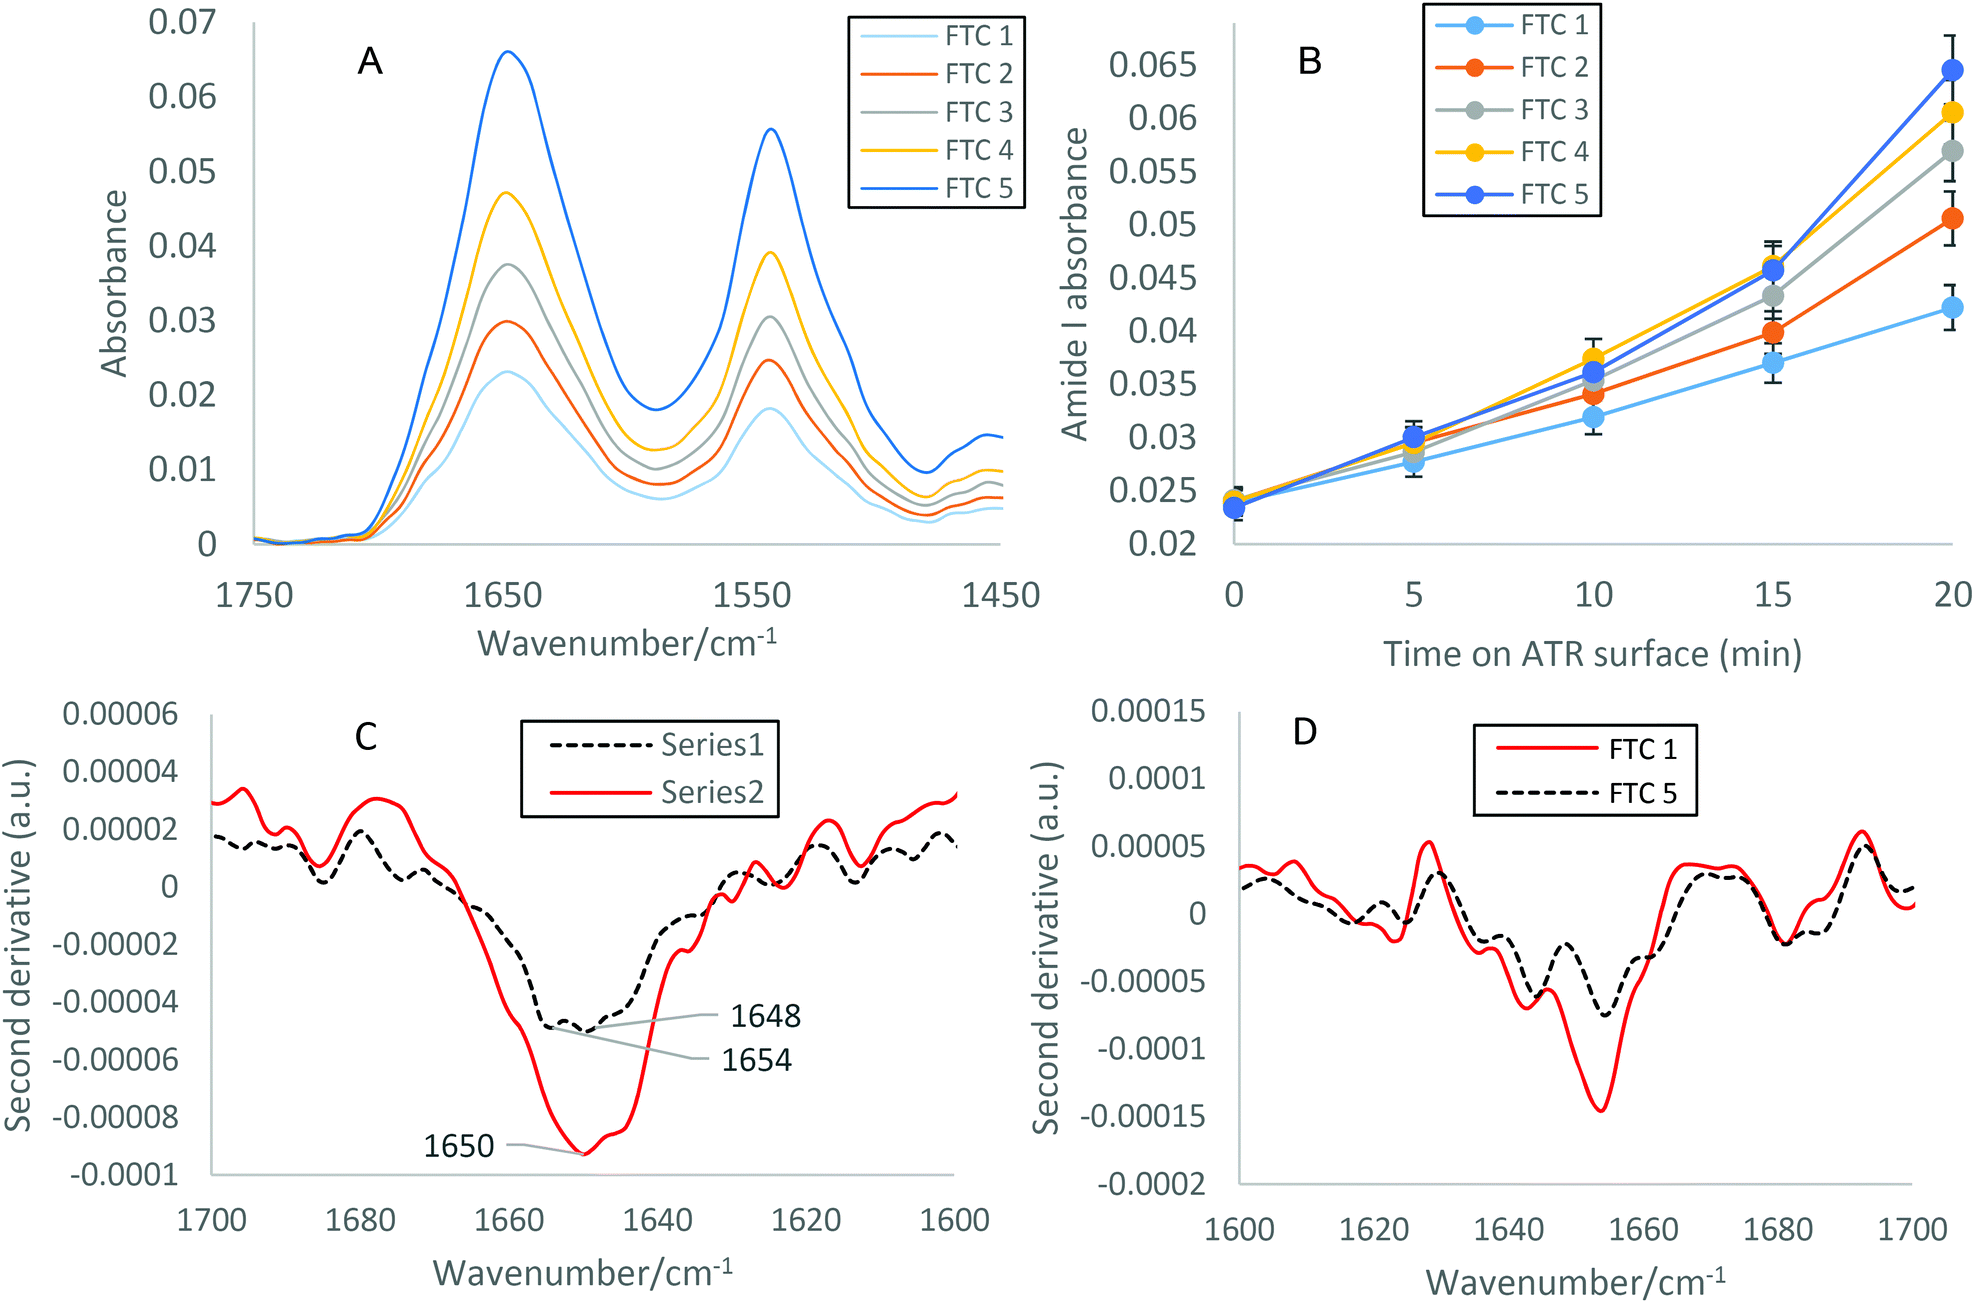 | ||
| Fig. 1 (A) FTIR 9 point smoothed (Savitzky–Golay) difference spectra of 30 mg ml−1 lysozyme at FTCs 1 (light blue), 2 (orange), 3 (grey), 4 (yellow) and 5 (dark blue) after 20 min on the ATR crystal surface. (B) Amide I absorbances of time interval measurements (0–20 min) of 30 mg ml−1 lysozyme on the surface of ATR crystal according to the key. (C) second derivative plot of 30 mg ml−1 lysozyme spectra after 0 (black hashed) and 20 (red) mins on surface of ATR crystal and (D) after 1 FTC (black hashed), and 5 FTCs (red). | ||
As previously described, second derivative peak analysis was carried out to elucidate structural contributions to each Amide I band. Fig. 2 shows the result of peak fitting of the spectra obtained for FTC 1–5 after 15 min on the surface of the ATR crystal using second derivative minima. Each spectrum corresponds to an individual sample of varying FTCs (A corresponds to FTC 1, and B to FTC 2 and so on). In Fig. 2(B–E) particularly, there is an increase in β-sheet (peak around 1635 cm−1) compared to α-helix (peak around 1618 cm−1). This supports the finding that there is a quantitative increase in aggregation with increasing FTCs. Fig. 2(F) displays the α-helical absorbance subtracted from the β-sheet absorbance at each FTC to demonstrate the general trend of a widening gap between the two. Fig. 2(A) shows data from the FTC1 sample and reveals a smaller difference between α-helix and β-sheet absorbance, and a lower overall absorbance of Amide I band, perhaps due to the decreased presence of protein overall on the surface of the diamond IRE. From FTC1–5 there is a trend of increasing difference between β-sheet and α-helix Amide I contribution peaks, demonstrating increased β-sheet contribution, and hence an increase in protein aggregates as the number of FTCs increases. Table 1 summarises α-helical and β-sheet peak positions and absorbance. The final column also displays the β-sheet – α-helical value at each FTC as shown in Fig. 2(F).
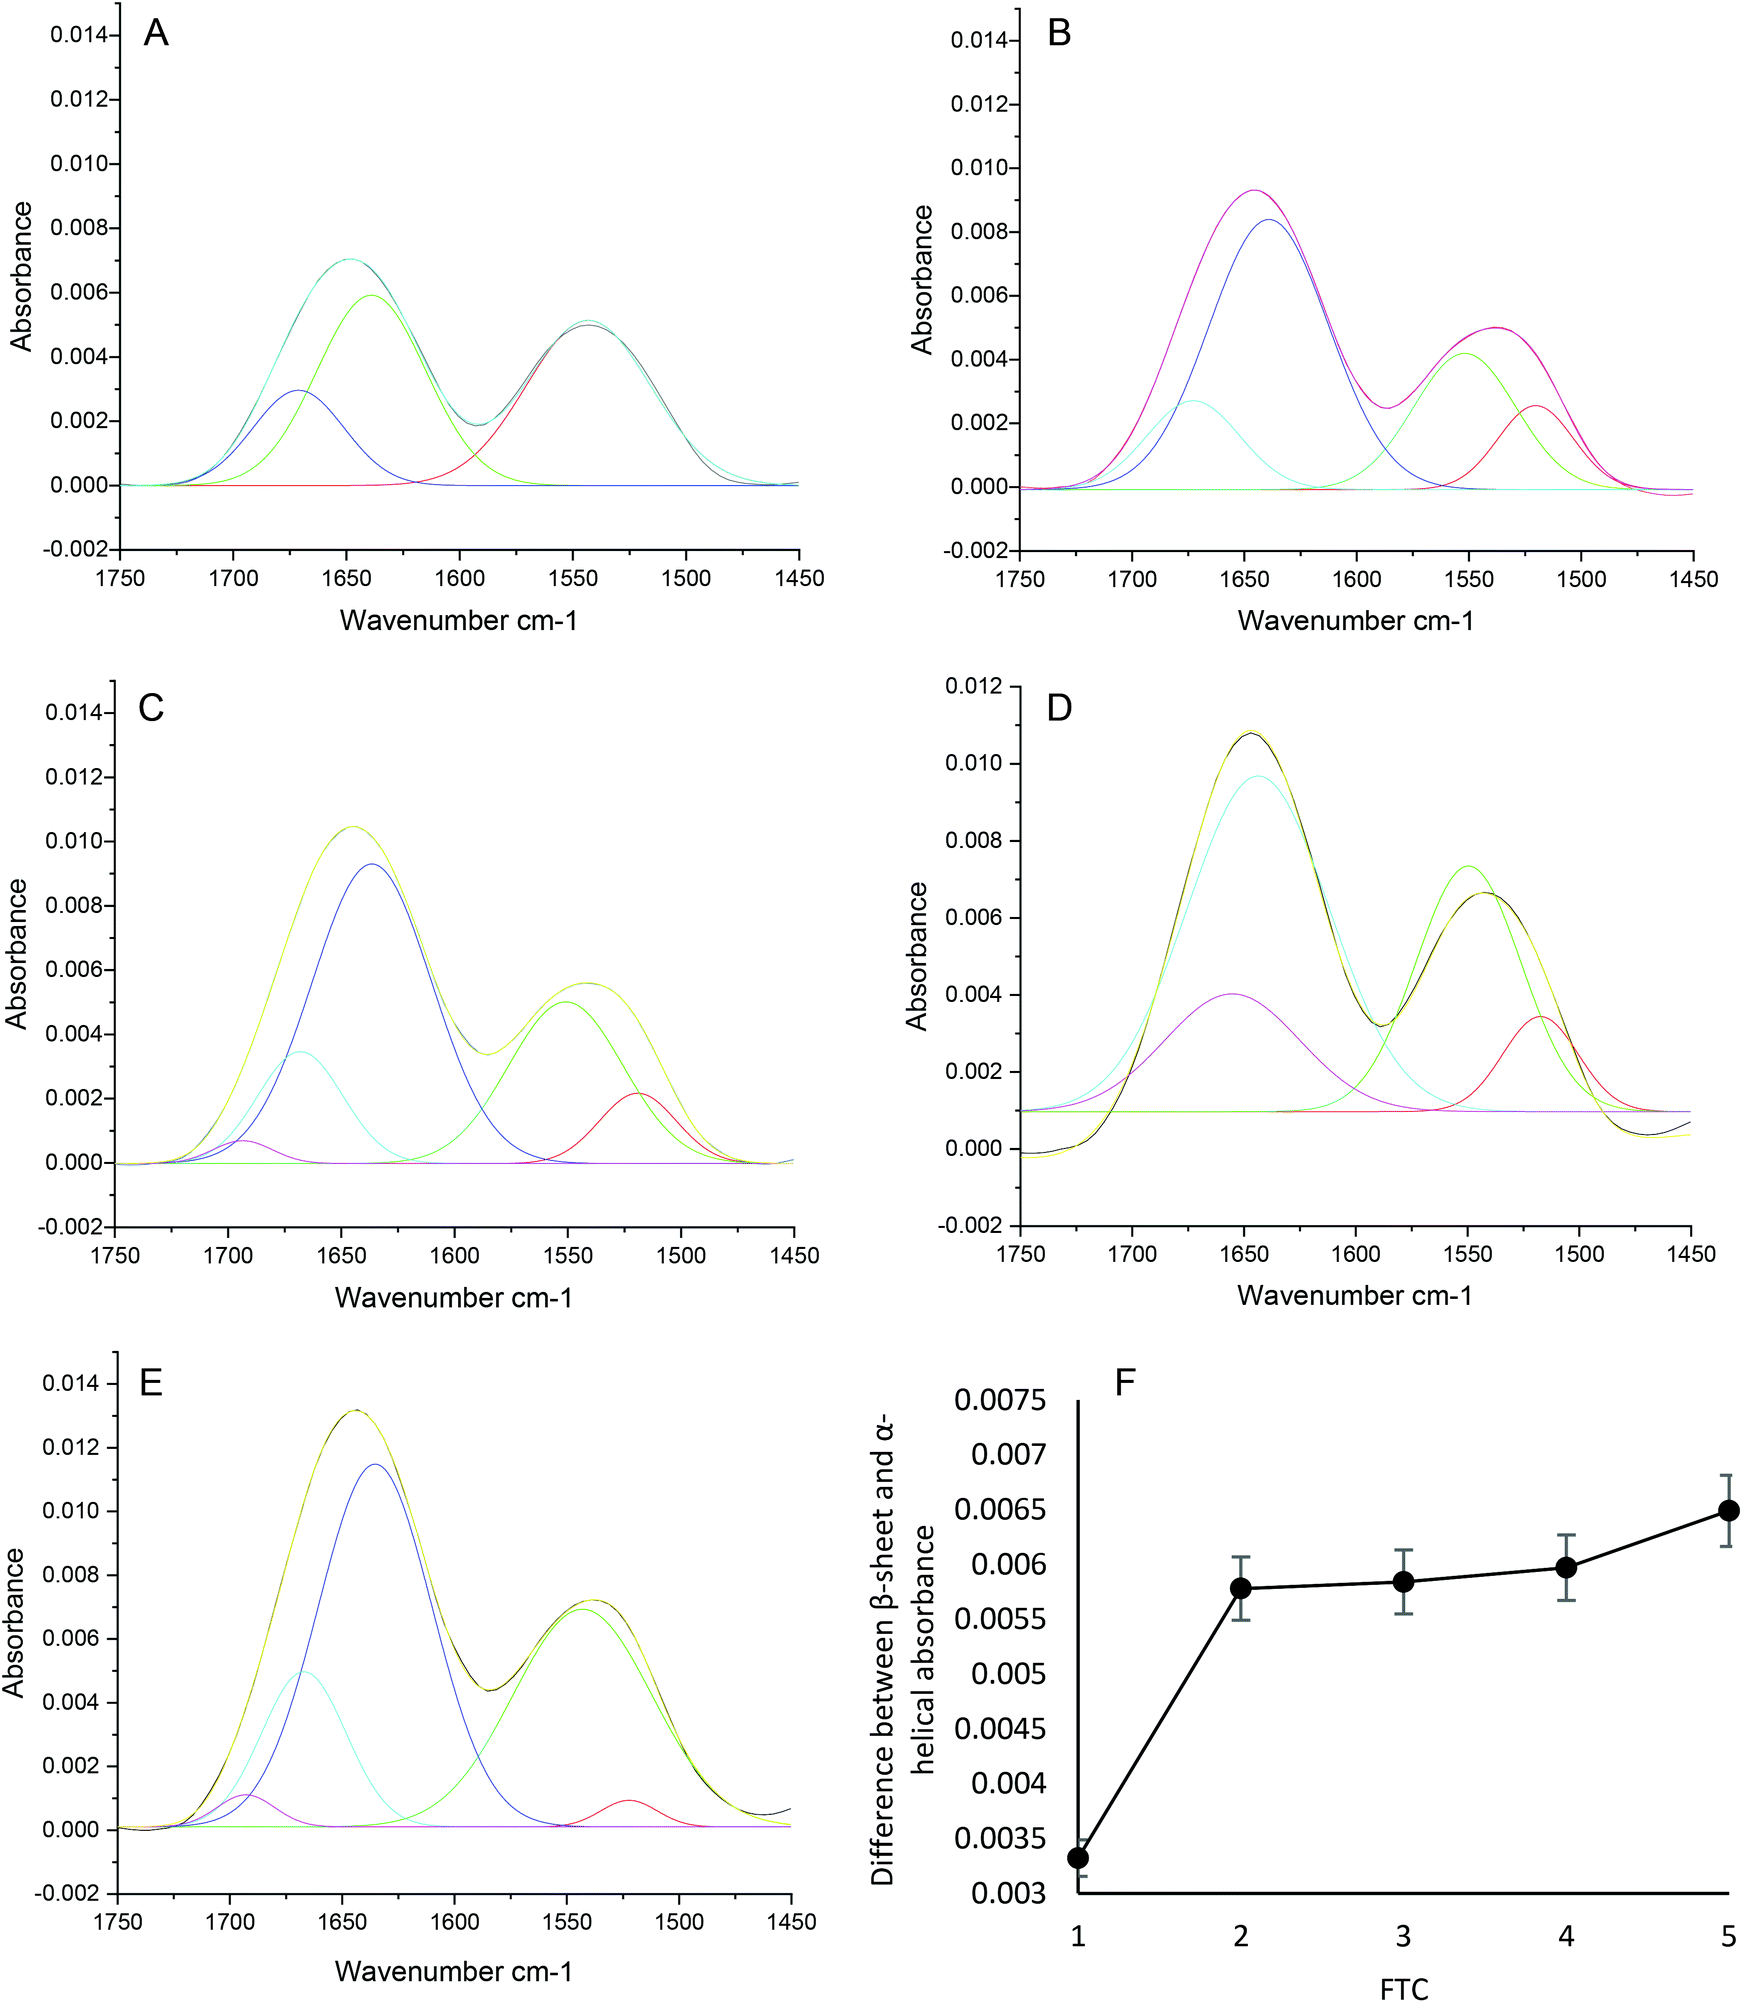 | ||
| Fig. 2 Spectra collected using conventional ATR-FTIR spectroscopy. Amide I and II spectral peak fitting using second derivative analysis (shown in Fig. 1) of 30 mg ml−1 lysozyme spectra at FTCs 1 (A), 2 (B), 3 (C), 4 (D) 5 (E) after 15 min on the surface of the ATR crystal, and (F) a plot showing the β – α subtraction for FTC A-E. | ||
| Sample | α-Helical peak position/cm−1 | α-Helical absorbance | β-Sheet peak position/cm−1 | B-sheet absorbance | β – α subtraction |
|---|---|---|---|---|---|
| FTC1 | 1671.63 | 0.00260 | 1638 | 0.00592 | 0.00332 |
| FTC2 | 1672.69 | 0.00261 | 1638 | 0.00839 | 0.00578 |
| FTC3 | 1668.82 | 0.00346 | 1635 | 0.00930 | 0.00584 |
| FTC4 | 1656.52 | 0.00403 | 1643 | 0.00968 | 0.00597 |
| FTC5 | 1668.12 | 0.00500 | 1635 | 0.01149 | 0.00649 |
3.2 ATR-FTIR spectroscopic imaging of protein solutions subjected to FTCs in static wells
ATR-FTIR spectroscopic imaging using wells and PDMS cells were used to further investigate the impact of FTCs on protein aggregation. Protein samples were pipetted into PDMS wells (Fig. 3(C)), on the surface of the ATR crystal, sealed using a top plate to reduce evaporation, and measurements were taken after 0, 5 and 10 minutes. Spectra within wells were extracted and averaged (Fig. 3(A)), and the Amide I absorbance was plotted (Fig. 3(B)). The spectra in Fig. 3(A) demonstrate a consistent increase in Amide I absorbance with increasing FTCs, and the Amide I absorbance is shown to be similar after both 5 and 10 minutes on the ATR crystal surface (Fig. 3(B)). As shown in the spectra a large increase in absorbance occurs between FTC 2 and 3, and again between 4 and 5, however the same overall trend of increasing absorbance with increasing FTC is seen throughout.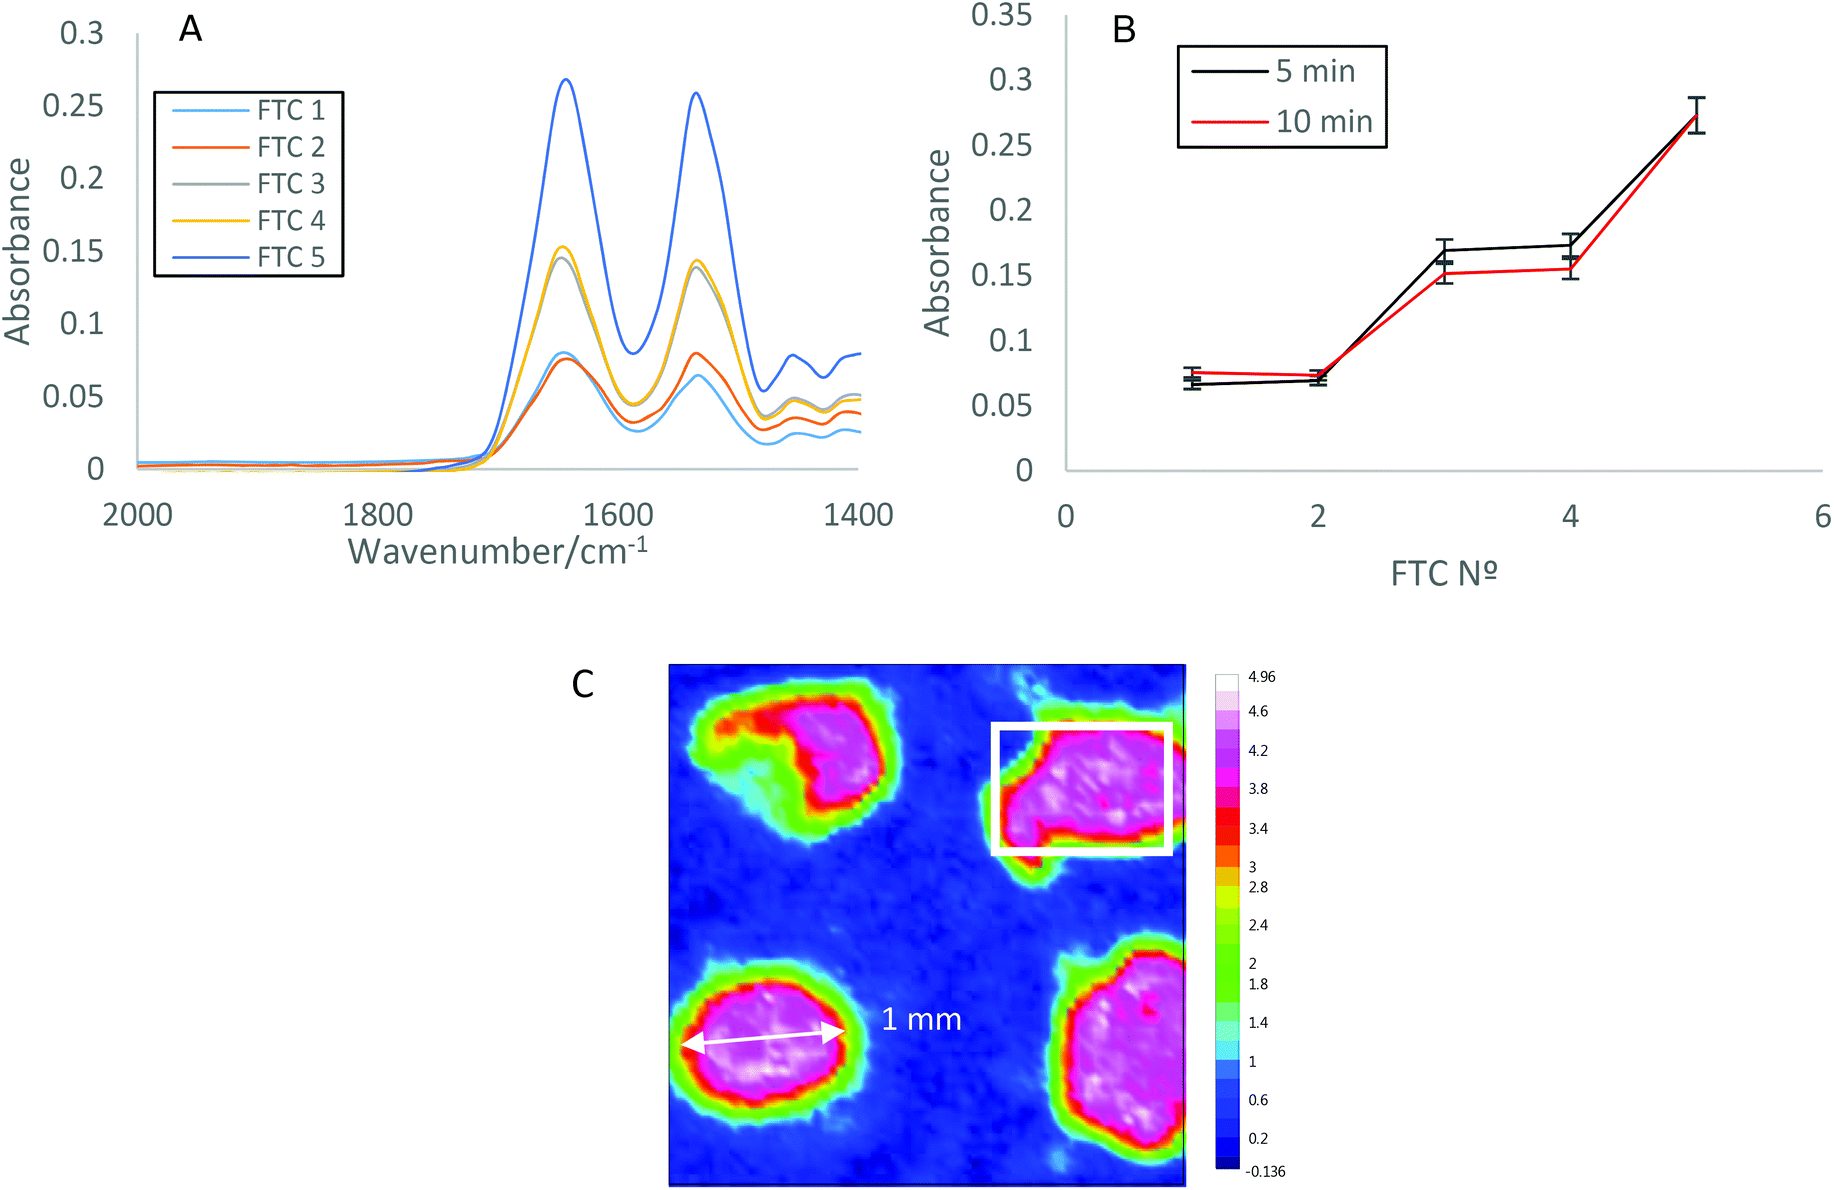 | ||
| Fig. 3 (A) Amide I and II bands of 30 mg ml−1 lysozyme after 10 min on ZnSe ATR crystal surface, all spectra were extracted from within the wells (1 mm in diameter), and averaged as follows FTC 1 (light blue), 2 (orange), 3 (grey), 4 (yellow) and 5 (dark blue) (B) Amide I absorbance of 30 mg ml−1 lysozyme on the surface of ZnSe ATR crystal at freeze thaw cycles after 5 (black) and 10 (red) minutes (C) integrated absorbance of the Amide I band (1600–1700 cm−1) showing four wells filled with 30 mg ml−1 lysozyme solution subjected to FTCs 1–4, with the white box highlighting the spectral area extracted for further analysis. | ||
The ATR-FTIR spectroscopic imaging of four wells show a correlation with the conventional ATR-FTIR spectroscopic results (section 3.1). Increasing FTCs lead to an increase in protein aggregation, detectable using both conventional ATR-FTIR spectroscopy and spectroscopic imaging.
3.3 ATR-FTIR spectroscopic imaging of protein solutions subjected to FTCs under flow
Lysozyme solutions at 30 mg ml−1 (see section 2.1), were flowed through PDMS channels at 10 μl min−1 for 10 minutes leading to a total flowed volume of 100 μl (Fig. 4(C and D)), and at 20 μl min−1 for 10 minutes leading to a total of 200 μl (Fig. 4(E and F)). Fig. 4(A) shows the integrated absorbance of the Amide I band (1600–1700 cm−1) of solutions of lysozyme in water flowing through the channels. The image shows that the protein solution is well contained within the channels, with no leakage occurring under flow.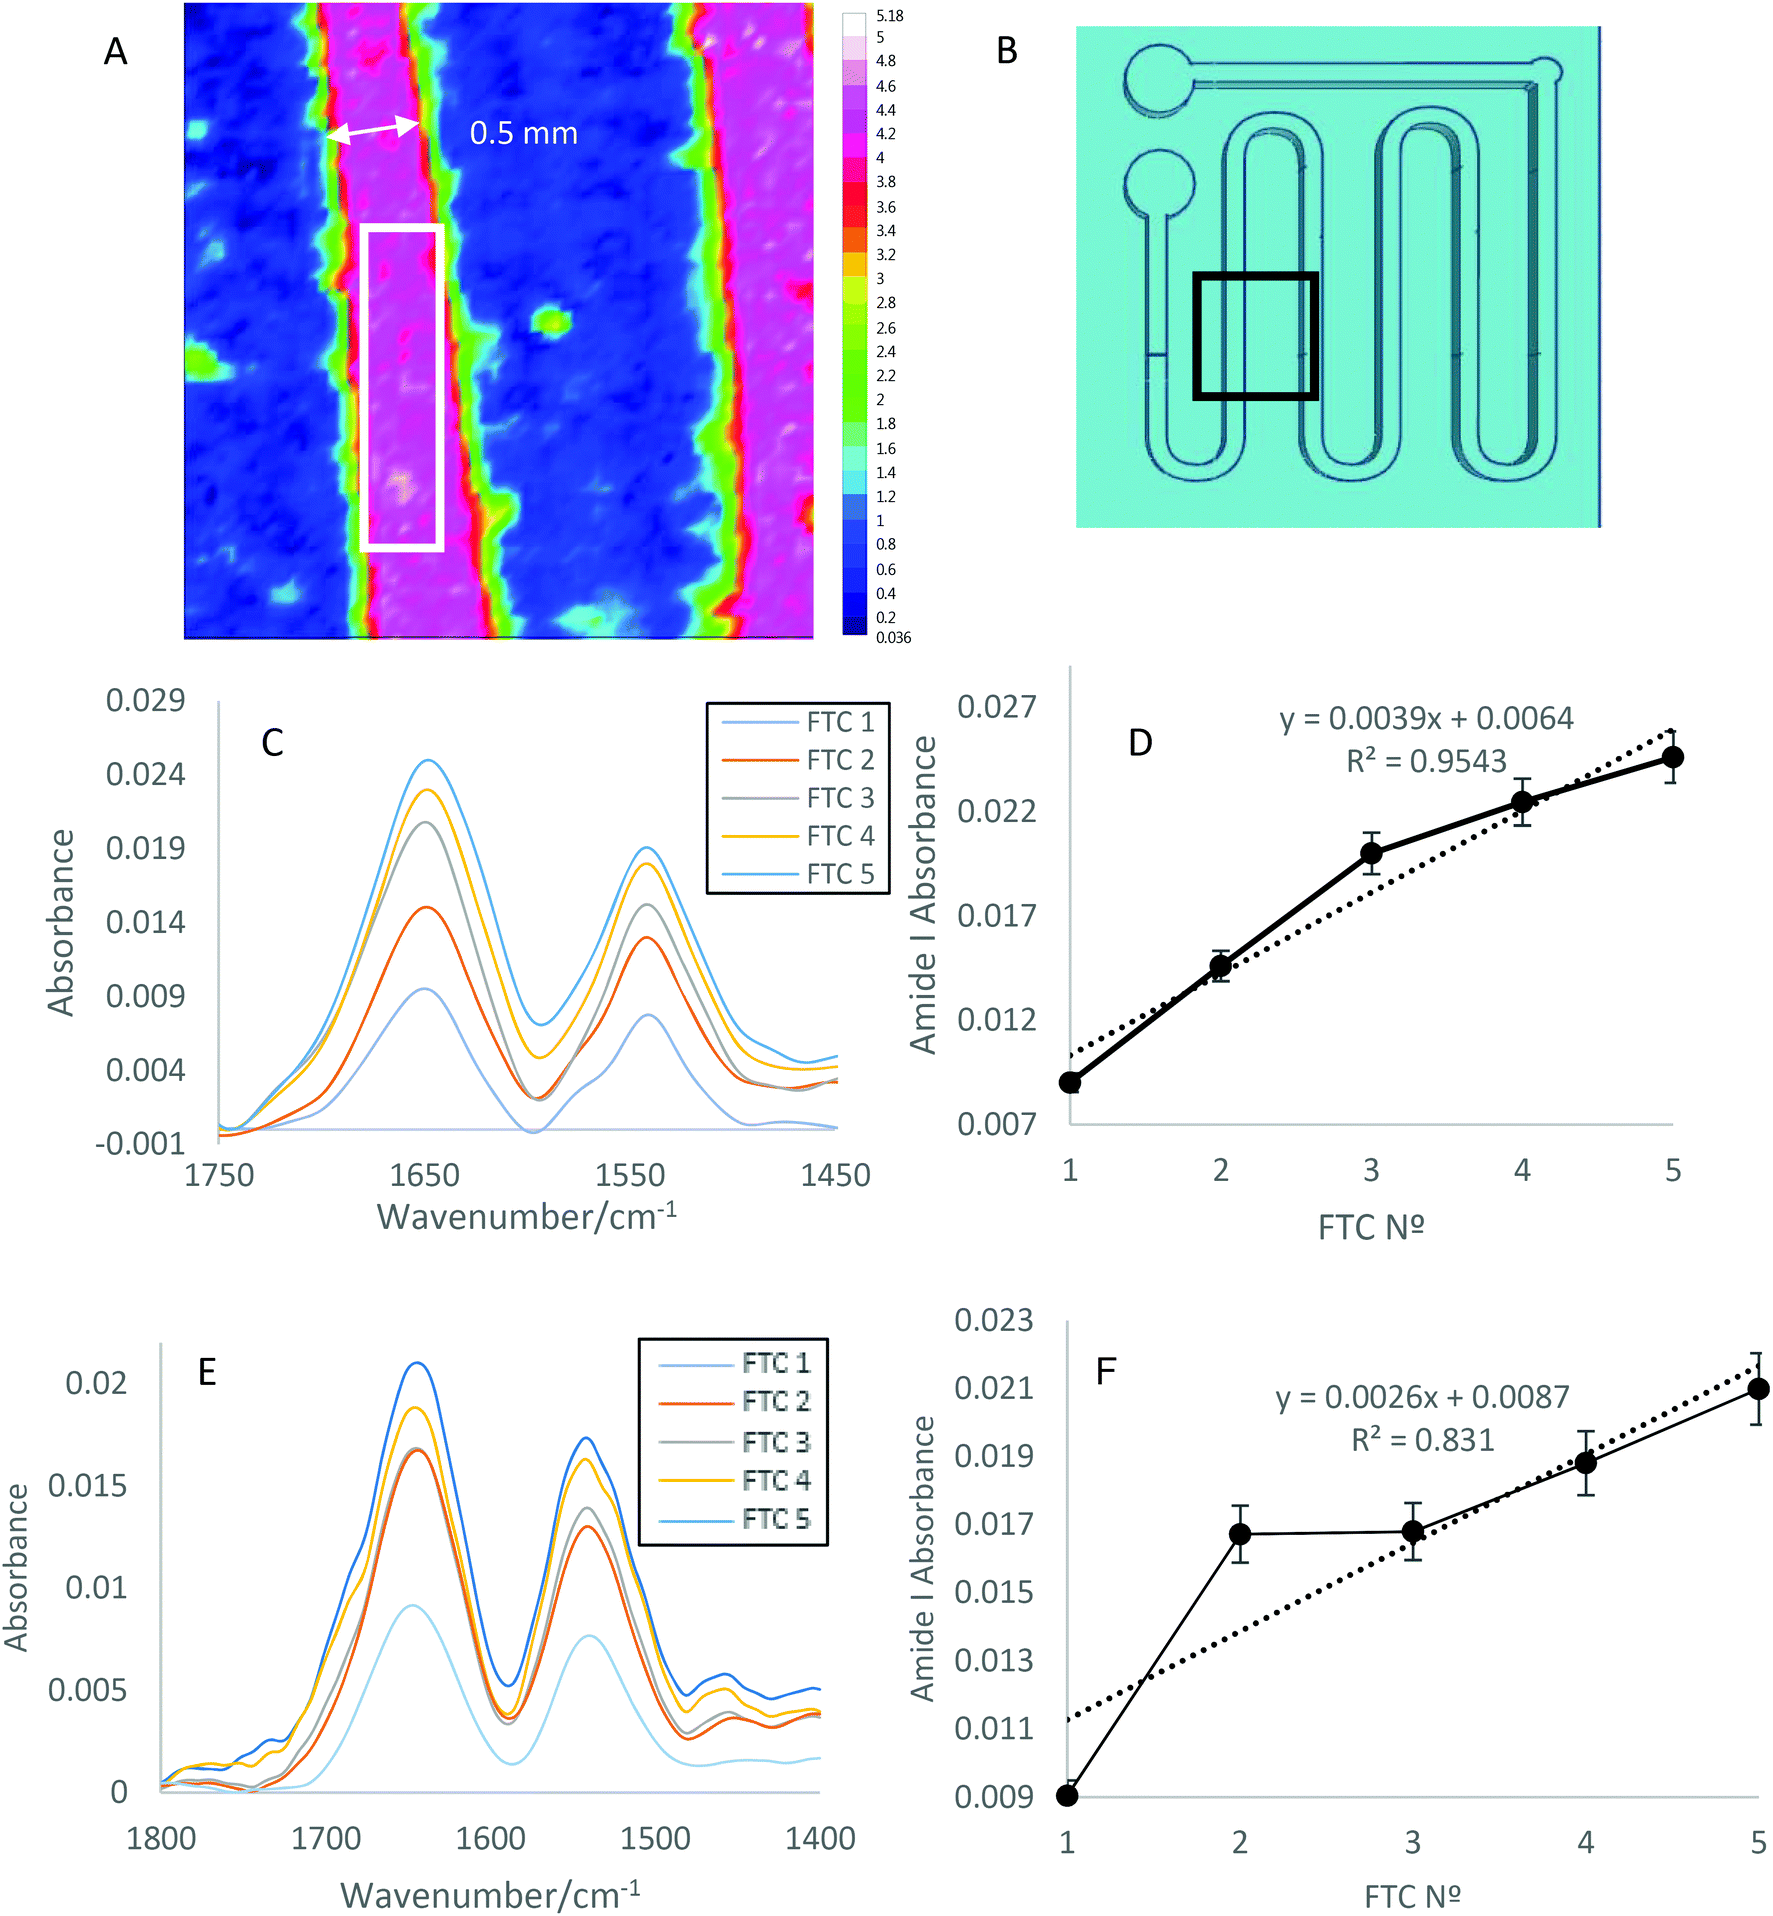 | ||
| Fig. 4 (A) Integrated absorbance of Amide I band (1600 to 1700 cm−1) demonstrating protein flowing through a PDMS channel (0.5 mm in width) attached to the surface of a ZnSe ATR crystal, with the extracted and averaged spectral area indicated by the white box. (B) 3D printed master of the channels, with the imaged area shown by the black box. (C) 9 point Savitzky–Golay smoothed, extracted and averaged spectra at 10 μl min−1 flow rate, showing Amide I and II band of FTCs 1 (light blue), 2, (orange), 3 (grey), 4 (orange) and 5 (dark blue). (D) Amide I absorbance of flowing 30 mg ml−1 lysozyme at FTCs 1–5 at 10 μl min−1 flow rate. (E) Extracted and averaged spectra at 20 μl min−1 flow rate, showing Amide I and II bands of FTCs 1 (light blue), 2, (orange), 3 (grey), 4 (orange) and 5 (dark blue). (F) Amide I absorbance obtained by flowing 30 mg ml−1 lysozyme from FTCs 1–5 at 20 μl min−1 flow rate. | ||
The difference between the maximum absorbance scale in Fig. 4(C) and (E) spectra could be due to the increased flow rate resulting in larger quantities of aggregates passing over the surface of the ATR crystal and thus leading to a higher amount of total deposited protein. The trend shown in section 3.1 and 3.2 is replicated under flow, as shown in Fig. 4C–E. Here the increasing amounts of protein and aggregation with increasing FTC is seen when using 30 mg ml−1 lysozyme under both 10 μl min−1 and 20 μl min−1 flow rates.
Further analysis (Fig. 5) was carried out to determine the structural contributions of β-sheet to the Amide I band. Fig. 5(A) shows the biggest difference in spectra around 1628 cm−1, defined by Barth35 as being a β-sheet contribution to the Amide I band, indicating an increased presence of aggregates. This increases in line with results obtained in section 3.1 and 3.2, as the FTC increases, so the presence of aggregates, and therefore β-sheet increases. Fig. 5(B) shows a larger change in Amide I band shape, demonstrated by an increase in absorbance at 1693 cm−1 with increasing FTCs. This wavenumber is also defined by Barth35 as indicating the presence of β-sheets. This larger alteration in Amide I band shape could be due to the increased volume of lysozyme (200 μl) flowing over the ATR crystal causing increased deposition of aggregates. The fact that the β-sheet content increases with increasing FTCs indicates that aggregation increases with increasing number of FTCs. These findings demonstrate that it is also possible to measure small changes in the structure of proteins under flow.
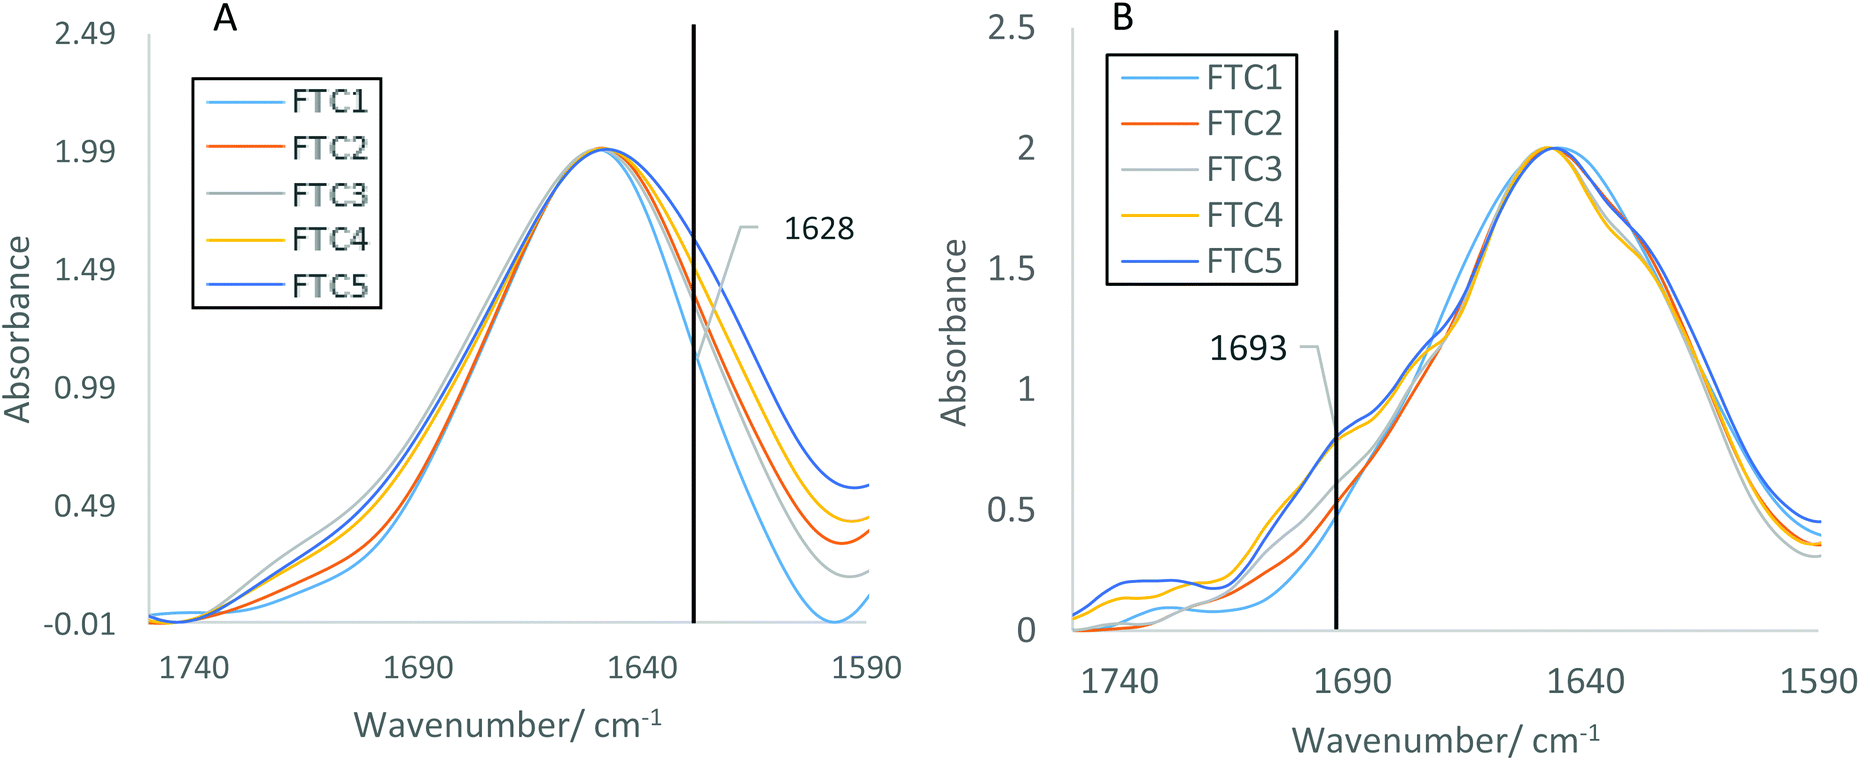 | ||
| Fig. 5 Amide I band shown of FTC 1–5 of averaged and extracted 30 mg ml−1 lysozyme spectra under (A) 10 μl min−1 and (B) 20 μl min−1 flow rate. Spectra were normalised for comparison and Savitzky–Golay smoothed to 9 points. Differences in spectra are shown by the black vertical line as the most obvious area of spectral change. At 1628 cm−1, the absorbance increases with increasing FTCs. | ||
Previous research has demonstrated the use of spectroscopic imaging to take a snapshot of solutions under flow.36 We have provided additional evidence that proteins under flow can also be analysed using this technique. Importantly, the findings from this analysis agree with both the results obtained from traditional ATR-FTIR spectroscopy and static ATR-FTIR spectroscopic imaging measurements (Fig. 1–5). The same trends were shown of an increasing Amide I absorbance with increasing FTCs (Fig. 4(D and F)). This particular area of research is relevant in both batch and continuous process monitoring of biopharmaceutical formulations in industry.
4. Conclusions
Here we have for the first time demonstrated the effective use of ATR-FTIR spectroscopy and spectroscopic imaging to monitor the effects of FTC cycles on a 30 mg ml−1 model lysozyme protein. This was carried out over 5 different FTCs, under static conditions, and two different flow rates; 10 and 20 μl min−1. Lysozyme displays similar changes under stress conditions to proteins such as IgG, therefore, we hypothesise that similar trends would be observed with monoclonal antibody samples. We consistently found an increase in β-sheet structural contribution with increasing FTCs using single channel FTIR spectroscopy, and FTIR spectroscopic imaging in wells and under flow, indicating an increase in protein aggregates on and close to the ATR crystal surface.This research could be used in industrial applications, for example in-line or off-line measurements in production before, during, or after FTCs to monitor biopharmaceutical stability through automated secondary structure analysis. It is essential to monitor these changes to prevent loss of product quality and delivery of substandard drugs to patients. We have shown through the use of ATR-FTIR spectroscopy and spectroscopic imaging, that the number of FTCs should be limited to reduce aggregate levels. Future research could focus on using these techniques to investigate aggregation at different points within the channel, to enhance understanding of aggregate distribution. In conclusion, these results provide a novel insight into the use of conventional ATR-FTIR spectroscopy and ATR-FTIR spectroscopic imaging for monitoring the effects of FTCs on protein stability. A consistent increase in protein presence and β-sheet contribution was seen, indicating increased aggregation with increasing FTCs.
Author contributions
All authors contributed to experimental design. HT carried out all the experiments and data analysis supervised by SGK and BB. HT wrote the manuscript with contributions from SGK and BB. All authors have given approval to the final version of the manuscript.Conflicts of interest
The authors declare no competing financial interest.Acknowledgements
We would like to thank BBSRC (Grant BB/M011178/1) and Bristol Myers Squibb for provision of a CASE studentship to Ms H. Tiernan.References
- K. J. Morrow, Jr. and E. S. Langer, A Biopharma Year In Review—And A Look Ahead To 2020 (Biosimilardevelopment.com).
- C. Domingo, Drugs, 2017, 77, 1769–1787 CrossRef CAS PubMed.
- A. M. Scot, J. P. Allison and J. D. Wolchok, Cancer Immun., 2012, 12, 14 Search PubMed.
- A. A. Shukla, L. S. Wolfe, S. S. Mostafa and C. Norman, Bioeng. Transl. Med., 2017, 2, 58–69 CrossRef PubMed.
- D. A. Gutmann, E. Mizohata, S. Newstead, S. Ferrandon, V. Postis, X. Xia, P. J. Henderson, H. W. v. Veen and B. Byrne, Protein Sci., 2007, 16, 1422–1428 CrossRef CAS PubMed.
- Y. F. K. Dyck, D. Rehm, J. F. Joseph, K. Winkler, V. Sandig, W. Jabs and M. K. Parr, Bioengineering, 2019, 6, 62 CrossRef CAS PubMed.
- A. Hawe, J. C. Kasper, W. Friess and W. Jiskoot, Eur. J. Pharm. Sci., 2009, 38, 79–87 CrossRef CAS PubMed.
- S. Kiese, A. Papppenberger, W. Friess and H. C. Mahler, J. Pharm. Sci., 2008, 97, 4347–4366 CrossRef CAS PubMed.
- L. A. Kueltzo, W. Wang, T. W. Randolph and J. F. Carpenter, J. Pharm. Sci., 2008, 97, 1801–1812 CrossRef CAS PubMed.
- B. H. Peters, L. Staels, J. Rantanen, F. Molnar, T. De Beer, V. P. Lehto and J. Ketolainen, Eur. J. Pharm. Sci., 2016, 95, 72–81 CrossRef CAS PubMed.
- A. Hauptmann, G. Hoelzl and T. Loerting, AAPS PharmSciTech, 2019, 20, 72 CrossRef CAS PubMed.
- P. Kolhe and A. Badkar, Biotechnol. Prog., 2011, 27, 494–504 CrossRef CAS PubMed.
- B. Kelley, mAbs, 2009, 1, 443–452 CrossRef PubMed.
- B. S. Chang, B. S. Kendrick and J. F. Carpenter, J. Pharm. Sci., 1996, 85, 1325–1330 CrossRef CAS PubMed.
- N. Rathore and R. S. Rajan, Biotechnol. Prog., 2008, 24, 504–514 CrossRef CAS PubMed.
- B. S. Bhatnagar, R. H. Bogner and M. J. Pikal, Pharm. Dev. Technol., 2007, 12, 505–523 CrossRef CAS PubMed.
- K. G. Desai, W. A. Pruett, P. J. Martin, J. D. Colandene and D. P. Nesta, Journal, 2017, 30, 30–36 Search PubMed.
- M. Boulet-Audet, S. G. Kazarian and B. Byrne, Sci. Rep., 2016, 6, 30526 CrossRef CAS PubMed.
- F. Sousa, B. Sarmento and M. T. Neves-Petersen, Eur. J. Pharm. Sci., 2017, 105, 127–136 CrossRef CAS PubMed.
- J. Cruz-Angeles, L. M. Martinez and M. Videa, Biopolymers, 2015, 103, 574–584 CrossRef CAS PubMed.
- S. Delbeck, H. M. Heise, W. Petrich and Z. Huang, presented in part at the Biomedical Vibrational Spectroscopy 2020: Advances in Research and Industry, 2020 Search PubMed.
- A. Derenne, K. M. Derfoufi, B. Cowper, C. Delporte and E. Goormaghtigh, Anal. Chim. Acta, 2020, 1112, 62–71 CrossRef CAS PubMed.
- H. Wu, E. Read, M. White, B. Chavez, K. Brorson, C. Agarabi and M. Khan, Front. Chem. Sci. Eng., 2015, 9, 386–406 CrossRef CAS.
- H. Yang, S. Yang, J. Kong, A. Dong and S. Yu, Nat. Protoc., 2015, 10, 382–396 CrossRef CAS PubMed.
- G. Guler, M. M. Vorob'ev, V. Vogel and W. Mantele, Spectrochim. Acta, Part A, 2016, 161, 8–18 CrossRef PubMed.
- A. P. Fellows, M. T. L. Casford and P. B. Davies, Appl. Spectrosc., 2020, 74, 597–615 CrossRef CAS PubMed.
- J. Kong and S. Yu, Acta Biochim. Biophys. Sin., 2007, 39, 549–559 CrossRef CAS PubMed.
- A. Dong, P. Huang and W. S. Caughey, Biochemistry, 1990, 29, 3303–3308 CrossRef CAS PubMed.
- H. Tiernan, B. Byrne and S. G. Kazarian, Spectrochim. Acta, Part A, 2020, 241, 118636 CrossRef CAS PubMed.
- A. V. Ewing, G. S. Clarke and S. G. Kazarian, Biomicrofluidics, 2016, 10, 024125 CrossRef PubMed.
- K. L. A. Chan, A. Altharawi, P. Fale, C. L. Song, S. G. Kazarian, G. Cinque, V. Untereiner and G. D. Sockalingum, Appl. Spectrosc., 2020, 74, 544–552 CrossRef CAS PubMed.
- H. Tiernan, B. Byrne and S. G. Kazarian, Anal. Chem., 2020, 92, 4760–4764 CrossRef CAS PubMed.
- M. Boulet-Audet, B. Byrne and S. G. Kazarian, Anal. Chem., 2014, 86, 9786–9793 CrossRef CAS PubMed.
- S. Gerontas, M. S. Shapiro and D. G. Bracewell, J. Chromatogr. A, 2013, 1284, 44–52 CrossRef CAS PubMed.
- A. Barth, Biochim. Biophys. Acta, 2007, 1767, 1073–1101 CrossRef CAS PubMed.
- K. L. A. Chan and S. G. Kazarian, Anal. Chem., 2012, 84, 4052–4056 CrossRef CAS PubMed.
Footnote |
| † Electronic supplementary information (ESI) available. See DOI: 10.1039/d1an00087j |
| This journal is © The Royal Society of Chemistry 2021 |