
 Open Access Article
 This Open Access Article is licensed under a
 Creative Commons Attribution 3.0 Unported Licence
ANFO vapour detection with conducting polymer percolation network sensors and GC/MS
Merel J.
Lefferts
 a,
Lisa H.
Humphreys
b,
Nathalie
Mai
b,
Krishnan
Murugappan†
a,
Ben I.
Armitage
a,
Jean-François
Pons
b and
Martin R.
Castell
a
a,
Lisa H.
Humphreys
b,
Nathalie
Mai
b,
Krishnan
Murugappan†
a,
Ben I.
Armitage
a,
Jean-François
Pons
b and
Martin R.
Castell
a
aDepartment of Materials, University of Oxford, Parks Road, Oxford, OX1 3PH, UK. E-mail: merel.lefferts@materials.ox.ac.uk
bCentre for Defence Chemistry, Cranfield University, Defence Academy of the United Kingdom, Shrivenham, SN6 8LA, UK
First published on 15th February 2021
Abstract
Ammonium nitrate mixed with fuel oil (ANFO) is commonly used in improvised explosive devices (IEDs). The development of ANFO vapour sensors that are small, inexpensive, and easy to use will enable widespread IED detection in the context of security and humanitarian demining. Because of concealment and the low vapour pressures of most explosive materials, achieving sufficiently high sensitivity and low limits of detection are some of the main challenges of explosives vapour detection. Here ANFO chemiresistive vapour sensors based on polypyrrole (PPy) percolation networks are presented and compared to gas chromatography-mass spectroscopy (GC/MS) results for ANFO. Improved sensitivities are achieved by using a polymer percolation network instead of a thin film for the gas sensors. Vapour concentrations are detected of 13–180 ppb of ammonia emitted by a variety of different ammonium nitrate-containing fertilisers and fertiliser-diesel mixtures.
Introduction
The detection of improvised explosive devices (IEDs) plays an important role in both security and humanitarian applications. Especially in developing countries where unexploded devices remain concealed due to past or current conflicts, cheap and reliable humanitarian demining remains a challenge. The most commonly used types of IEDs are based on easily accessible materials, such as ammonium nitrate/fuel oil (ANFO) mixtures and perchlorates.1 Vapour sensing of ammonium nitrate/fuel oil (ANFO) is especially challenging because the fertilisers commonly used as the ammonium nitrate (AN) component are not volatile, although their decomposition products are,2,3 whereas fuel oils such as diesel are omnipresent and can cause a high false positive rate.It is perhaps surprising that despite modern technologies sniffer dogs are still considered the gold standard in vapour sensing. However, depending on the working environment, it is not always practical or ethical to use sniffer dogs. Other traditional methods used in humanitarian demining, such as the use of metal detectors, ground penetrating radar, and acoustic sensors are not always effective because of the large range of materials, shapes, and sizes of the containers used for IEDs, and the frequent absence of metal components.4 Vapour sensing methods based on for example mass spectroscopy,5 ultraviolet Raman spectroscopy,6 and nuclear quadrupole resonance,7 often require relatively large pieces of equipment and are therefore not practical for use in the field. Conducting polymer (CP) based chemiresistive sensors provide a potential solution because they can be used for stand-off detection, use relatively cheap materials, are operated at room temperature, allow for easy data processing, and are small.8,9 Polymer-based sensors have been investigated for a range of materials, including NO2,10,11 NH3,12–14 and nitro aromatic explosives.15 One recent example uses small scale fluorescence based detectors for ANFO and ammonium nitrate/nitro methane (ANNM) detection.16
Although CP-based chemiresistive vapour sensors are promising, achieving the sensitivities and limits of detection required for the detection of ANFO-based IEDs is challenging. Here we address that challenge by using sensors based on a percolation network of CPs, instead of a more traditional CP thin film design. Previous work, using polypyrrole (PPy) percolation networks between interdigitated Au electrodes with a 100 μm separation on a flexible PET substrate for NH3 detection, has shown that with this approach the sensitivity is significantly improved.17 Sensors based on a percolation network of CPs operate in the steep part of the percolation curve, where a small number of interactions between the analyte gas and the CP lead to a large resistance change, resulting in a high sensitivity. Additionally, compared to the sensors described in ref. 17, changing the substrate from PET to glass demonstrates the potential for sensor incorporation into silicon-based technologies, and decreasing the electrode separation increases the efficiency of the sensor fabrication process because of the earlier onset of the percolation region. Furthermore, detecting unknown vapour concentrations emitted by solid or liquid samples, as opposed to known concentrations of pure gases from a cylinder, is an important step towards real world application of CP based sensors. Here we demonstrate ppb level sensing of ANFO vapour using percolation networks of PPy between Pt interdigitated electrodes on a glass substrate.
The sensor responses are compared to gas chromatography-mass spectrometry (GC/MC) results for the same analyte materials. GC/MS is an analytical technique frequently utilised to identify and quantify the individual volatile components within a material or mixture. First, the components of the mixture are separated based on their chemical properties and affinity for the stationary phase. Next, the components are broken down into ionised fragments which are then separated based on their mass-to-charge ratio.18 It is a technique regularly employed by forensic scientists, to identify unknowns in fire and explosive investigations,19,20 for drugs detection,21 for environmental analysis to assess levels of NOx in the atmosphere or pollutants in ecosystems,22 as well as NH3 detection.23,24
Methods
Conducting polymer percolation network sensors
To create the sensors, commercially available Pt interdigitated electrodes (IDEs) with a 5 μm electrode separation on glass substrates (Micrux, Spain) were used after cleaning with concentrated nitric acid (HNO3, 90%) followed by sonication in ethanol (C2H6OH, 99.8%), methanol (CH3OH, 99.9%), and acetone (C3H6O, 99.8%). All solvents were purchased from Sigma-Aldrich (UK). Polypyrrole (PPy) was grown on the IDEs using electrochemical polymerisation from a solution of 0.01 M pyrrole (Sigma-Aldrich) and 0.1 M lithium perchlorate (LiClO4, Sigma-Aldrich) in acetonitrile (C2H3N, Sigma-Aldrich). The two connection pads of the IDEs were connected and together used as the working electrode. A Pt coil (BASi, USA) was used as the counter electrode and an Ag/AgCl (CH Instruments, USA) reference electrode was used. An Autolab PGSTAT204 potentiostat (Metrohm, Switzerland) and a PC with Nova 1.11 software were used to control and monitor the electrochemical polymerisation.25 Using chronoamperometry, the potential between the working electrode and the reference electrode was kept at 1.0 V for 50 s, typically resulting in sensors with a starting resistance between 3 kΩ and 25 kΩ, which we know from previous work with Au IDEs on flexible PET substrates corresponds to the percolation region for PPy percolation networks.17 After PPy growth the sensors were p-doped using chronoamperometry, by holding them at 1.0 V in a monomerless 0.1 M LiClO4 solution in acetonitrile for 60 s.The sensors were exposed to NO2 and NH3 (both from 10 ppm in N2 cylinders, BOC) as well as 7 different fertilisers with and without diesel (Sigma-Aldrich). The fertilisers were Nutribooster, EXTRAN, CAN27, SULPHAN, AXAN, Prilled N (YaraBela), and recrystallised Nutribooster (prepared at Cranfield University) (Table 1). The ANFO samples consisted of ∼0.94 g crushed fertiliser and 0.06 mL diesel because this is the ratio most commonly used in IEDs.26,27 For safety reasons, the sample size was limited to 1 g for all fertiliser and ANFO samples, fertilisers and fuel oils were stored separately, and after use samples were kept in an excess of water for disposal. N2 (BOC) was used to carry the vapours emitted by the solid and liquid samples into the sensor testing chamber and to further dilute the NO2 and NH3 (BOC).
| Fertiliser name | Total nitrogen content (%) | Nitrate-N (%) | Ammoniacal-N (%) | SO3 (%) | |
|---|---|---|---|---|---|
| A | Nutribooster | 25 | 12.5 | 12.5 | 5 |
| B | EXTRAN | 33.5 | 16.9 | 16.6 | 0 |
| C | CAN27 | 27 | 13.5 | 13.5 | 0 |
| D | SULPHAN | 24 | 12 | 12 | 15 |
| E | AXAN | 27 | 13.5 | 13.5 | 9 |
| F | Prilled N | 33.5 | 16.9 | 16.6 | 0 |
| G | Recrystallised nutribooster | 25 | 12.5 | 12.5 | Unknown |
The sensors were tested in a custom-made sensor testing chamber at atmospheric pressure and room temperature (Fig. 1). The total flow rate was kept constant at 500 sccm using mass flow controllers (Alicat). The sensing chamber has 2 gas inlets and 1 gas outlet. Gas inlet A is used for gasses and mixtures of gasses from cylinders; N2, NO2, and NH3 in this case. Inlet B has a t-shaped glass attachment that can hold liquid and solid samples such as the fertiliser, ANFO, and diesel samples. An N2 flow through the t-shaped attachment, over the top of the sample holder, is used to carry vapours emitted by the solid or liquid sample into the sensor testing chamber through gas inlet B. Between exposures to analyte vapours gas inlet B is closed and the N2 flow is switched to gas inlet A. This makes it possible to clean the t-shaped attachment and change the solid or liquid sample between exposures without disrupting the continuous N2 flow through the sensor testing chamber. To monitor the changes in the resistance of the sensor during exposure to the analytes, 1 V was applied to the sensor and the current was measured.
 | ||
| Fig. 1 Schematic of the sensing chamber showing the position of the sensor, electrical feedthrough for resistance measurements, gas outlet, gas inlet A, and gas inlet B with the t-shaped attachment for solid and liquid samples; an ANFO sample in this example. | ||
GC/MS
For the GC/MS measurements an Agilent gas chromatograph model 7890B equipped with a CTC PAL RSI autosampler system and connected to an Agilent 5977A mass spectrometer based on a quadrupole analyser was used. The headspace analyses were then performed with a Rtx-Volatile amines capillary column (60 m × 0.32 mm ID × 0 μm film thickness, Restek). The GC and MS conditions for AN and ANFO are described in Table 2. The mass spectrometer data were acquired in full scan mode set monitoring m/z range from 10 to 100 Da, at 70 eV MS ionization energy. Subsequently, the ammonia area peak was measured in selective ion monitoring mode to increase the sensitivity by monitoring the target ion at m/z 17 and the quantitation was obtained with an external standard method. The chromatographic conditions were managed via Chemstation software while the data were acquired and processed using MassHunter GC/MS Software from Agilent.| GC parameters | AN | ANFO |
|---|---|---|
| Inlet temperature (°C) | 200 | 280 |
| Injection volume (μl) | 240 | 240 |
| Oven temperature program | 40 °C (hold for 1 min) to 150 °C @ 60 °C min−1 (hold for 2 min) | 40 °C (hold for 1 min) to 270 °C @ 60 °C min−1 (hold for 7 min) |
| Carrier gas and flow rate | Helium @ 1.2 ml min−1 | Helium @ 1.2 ml min−1 |
| Spilt ratio | 50![[thin space (1/6-em)]](https://www.rsc.org/images/entities/char_2009.gif) :1 :1 |
50:1 |
| Run time (min) | 10 | 18 |
| MS parameters | AN | ANFO |
| Ionisation mode | EI | EI |
| Transfer line temperature (°C) | 150 | 270 |
| Ionization source (°C) | 230 | 300 |
| MS quadrupole (°C) | 150 | 200 |
Headspace samples consisted of 1 g of ammonium nitrate or 1 g ANFO in a 10 mL headspace vial. Glass beads (4 mm diameter) were added to concentrate the headspace by reducing the available volume, but the glass beads were not desorbed into the inlet. The headspace was measured by adding water at room temperature and measuring the weight and using the corresponding density to calculate the available volume. The samples were sealed with an aluminium screw cap. The vials were incubated at 90 °C for 10 min with the agitator at 500 rpm on for 5 s and off for 2 s, to encourage more volatile components to be released into the headspace prior to sampling. The standard gas syringe on the GC/MS equipment was used to extract the headspace from the samples. The ammonia standard was made by repeatedly vacuuming and flushing an in-house GC vial with a certified ammonia gas. The 5-point calibration ranging from 6.5 ppm to 97.8 ppm was built by measuring the peak area at different split ratios.
Results and discussion
After sensor fabrication, each sensor was placed in the sensor testing chamber and left under N2 flow until a stable resistance baseline was reached. Then 1 g fertiliser was placed in the t-shaped sample holder and N2 was used to carry any vapours emitted by the fertiliser into the sensor testing chamber. Exposing the sensor to the fertiliser granules or prills in this way did not result in a measurable sensor response. However, when the fertiliser had been roughly crushed using a pestle and mortar before being placed in the t-shaped sample holder, a sharp increase in the resistance of the sensor was recorded (Fig. 2A). This is likely due to the highly porous nature of the fertiliser granules. Crushing the granules releases vapours stored in the pores, making it possible for the sensor to detect the fertiliser. Although crushing the granules also increases the exposed surface area of the AN fertiliser, we expect the effect of this on the amount of vapour released on the timescales of these experiments to be relatively minor. In a real-life ANFO detection scenario the vapour will be released gradually over time, and accumulate in the container or space in which the explosive device is contained, creating the headspace sample. Crushing the granules speeds up the vapour release, making it possible to conduct the experiment on a time scale compatible with a laboratory experiment. The sensor response is reversible, as demonstrated by the increase in resistance, gradually returning to its baseline once the vapour source is removed. | ||
| Fig. 2 (a) Sensing response to 1 g crushed fertiliser A (Nutribooster). The sensor was exposed twice for 5 minutes and left to recover under dry N2 flow for 10 minutes between exposures. (b) Sensing response of the same sensor to 2 ppm, 1 ppm, 500 ppb, and 100 ppb NH3. (c) Sensing response of the same sensor to 500 ppb, 1 ppm, and 2 ppm NO2. (d) Percentage resistance change vs. NH3 concentration for this sensor. The error bars give the standard deviation based on repeat measurements with the same sensor. Green indicates the start of fertiliser or ANFO vapour being carried into the sensing chamber by the N2 flow and red indicates the switch to a pure N2 flow without analyte vapour. | ||
The same sensor was also exposed to NO2 and NH3, at known concentrations (Fig. 2B and C). The PPy based sensor responds to both NO2 and NH3, however the type of response shown for the two gases is different. Upon exposure to NO2 the resistance of the sensor increased slowly and irreversibly. Exposing the sensor to NH3 resulted in a rapid and reversible increase in resistance because NH3 is a strong electron donor and causes a decrease in the majority charge carrier in p-type PPy.28 This is in agreement with previous results for higher concentrations of NH3.29,30 The type of resistance change measured when the sensor is exposed to NH3 looks very similar to that obtained for the crushed fertiliser. Ammonium nitrate (AN) itself is not volatile. However, it slowly degrades into NH3 and HNO3, resulting in vapour pressures similar to those of TNT.2 Therefore it is likely that when detecting the crushed fertiliser sample, the sensor is in fact responding to the emitted NH3. Using a calibration curve based on the sensor response to known NH3 concentrations it is possible to estimate the concentration of the NH3 measured when detecting the fertiliser sample (Fig. 2D). Using the calibration curve we can say that in the example given in Fig. 2A approximately 180 ppb was detected.
It was also found that our sensors do not respond to diesel, one of the materials most commonly used as the fuel oil component of ANFO. Since diesel can be a common background signal in the types of environments in which an ANFO sensor would be implemented, such as buried roadside locations, the lack of response of the sensor to diesel vapour is an advantage because it decreases the number of false positives.
To be able to compare the sensor responses to an established analytical method, GC/MS was used to analyse AN and ANFO samples based on the same fertilisers. Like in the case of our percolation sensors, the GC/MS results confirm that the presence of diesel or gasoline does not significantly interfere with the detection of NH3 in the GC/MS measurements (Fig. 3). This suggests that the fuel oil component, independent of which fuel oil is used, does not affect ANFO detection.
 | ||
| Fig. 3 Typical GC/MS chromatograms, displaying counts vs. acquisition time for AN, AN with diesel (b) and AN with gasoline (c). Contributions from AN, such as NH3, CO2 and H2O are indicated (a). The analytes associated with diesel elute much later than those of AN, meaning that the diesel does not interfere with the AN contributions. | ||
Next, 4 different PPy percolation network based sensors were exposed to 7 different fertilisers and ANFO mixtures based on those fertilisers. The AN to FO ratio typically used in ANFO-based IEDs is 94% AN and 6% FO,26,27 therefore ∼0.94 g crushed fertiliser was mixed with 0.06 mL diesel. As expected, the increase in sensor resistance is rapid and reversible for all fertiliser and ANFO samples. For each fertiliser the sensors were first exposed to 1 g crushed fertiliser and then to 1 g ANFO made with the same fertiliser. The typical sensor responses to a fertiliser and its ANFO shown in Fig. 4 correspond to 170 and 177 ppb NH3 respectively. The sensing responses to the fertilisers and the ANFOs were indistinguishable within error, as shown by the typical raw sensor responses shown in Fig. 4 and raw responses for 7 different fertilisers (Fig. 5) and a summary of responses of multiple sensors to 7 different fertilisers (Fig. 6). This is as expected because the sensors are sensitive to the fertilisers but not to the diesel. This also implies that if any vapour components exist that are unique to the ANFO mixture, they are not detected by our sensors. However, to our knowledge, such components have not been described in the scientific literature.
 | ||
| Fig. 4 Sensing response to 1 g crushed fertiliser A, Nutribooster, (first peak) and 1 g ANFO consisting of 94% crushed fertiliser A and 6% diesel (second peak). The sensor response to the fertiliser and the ANFO are indistinguishable within error. Here green indicates the start of fertiliser or ANFO vapour being carried into the sensing chamber by the N2 flow and red indicates the switch to a pure N2 flow without analyte vapour. | ||
 | ||
| Fig. 5 Sensing response of one sensor to a series of exposures to 1 g of each crushed fertiliser and 1 g ANFO made with each different fertiliser, consisting of 94% crushed fertiliser and 6% diesel. Where green indicates the start of fertiliser or ANFO vapour being carried into the sensing chamber by the N2 flow and red indicates the switch to a pure N2 flow without analyte vapour. For each different fertiliser the sensor response to the fertiliser and the ANFO are very similar. Furthermore, the sensing response is different for different fertilisers. At the end of the series the sensor was again exposed to 1 g of the first fertiliser as a control experiment to check that the sensor had not degraded during the series of exposures. The result indicates good sensor stability over time and after multiple exposure and recovery cycles. | ||
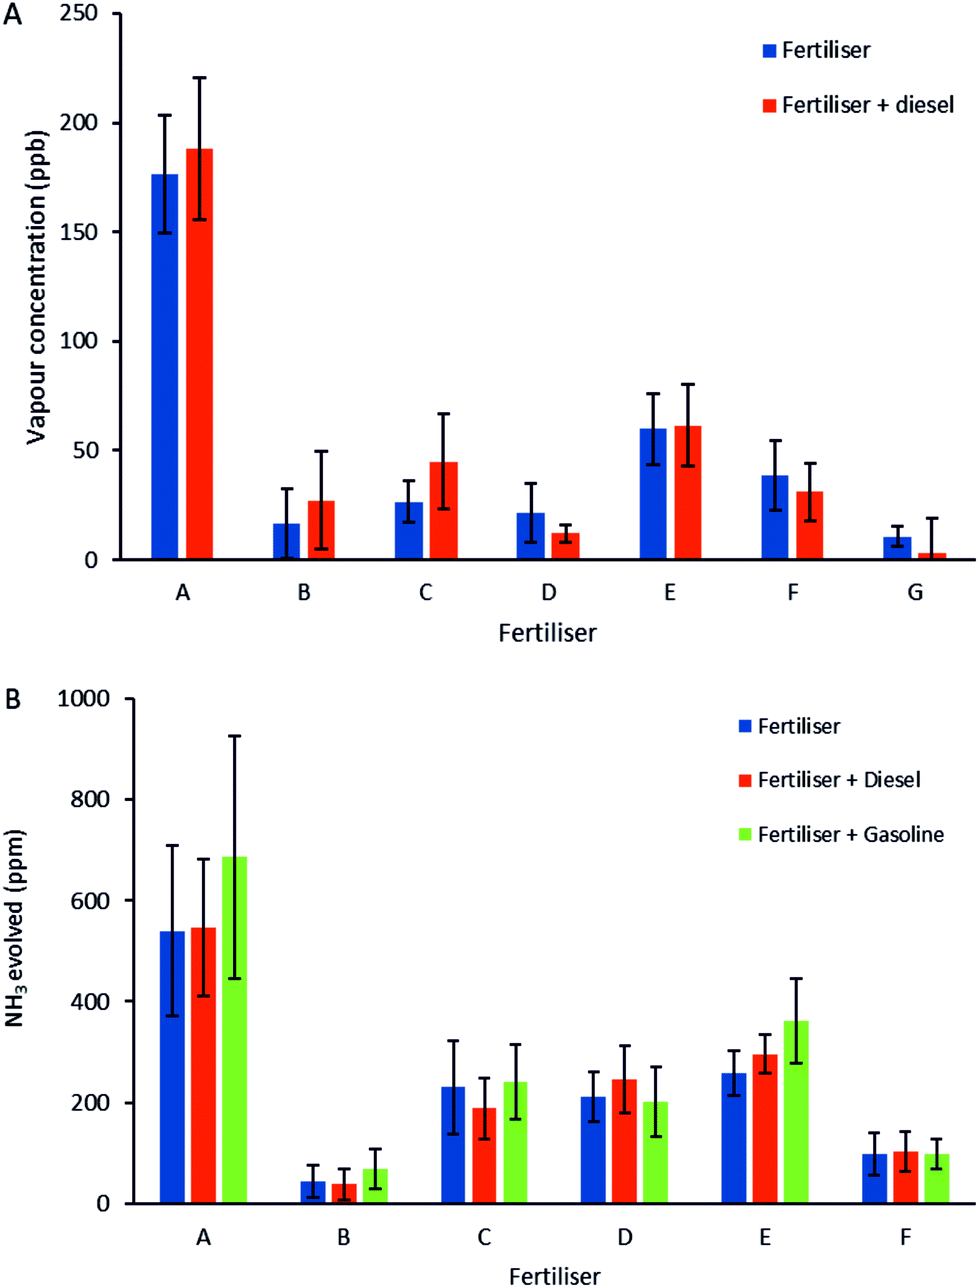 | ||
| Fig. 6 Comparison of the sensor responses in ppb (a) and GC/MS results in ppm (b) for various fertilisers and ANFO mixtures. The results are averages of 4 different sensors for the fertiliser exposures and 3 different sensor for the fertiliser-diesel mixture exposures (a), and 3 GC/MS measurements (b). The error bars represent the standard deviation. The equivalent vapour concentrations in ppb or ppm were calculated using a calibration curve of sensor responses and GC/MS measurements of known NH3 concentrations, respectively. The comparison between the responses to the fertilisers and ANFO mixtures shows that there is little difference between the response to a fertiliser and ANFO made with the same fertiliser. Furthermore, it shows clear differences between the different fertilisers. The pattern of which is similar for the sensor responses and the GC/MS measurements. | ||
Each of the 4 sensors was subjected to a series of consecutive exposures to the 7 different fertilisers and ANFO mixtures based on those fertilisers (Fig. 5). At the end of each series the sensor was exposed to the first fertiliser from the series for a second time, as a control experiment, to check that the sensor had not degraded during the experiment. The first exposure to fertiliser A and the control experiment in Fig. 5 correspond to the detection of 171 and 216 ppb NH3 respectively. This control experiment demonstrates that the sensors have good stability over time and after multiple exposure and recovery cycles. The series of exposures shows that, while the responses to a fertiliser and the ANFO made with the same fertiliser are very similar, the sensor responds differently to different fertilisers or ANFOs based on different fertilisers.
A series of exposures to the 7 different fertilisers and their ANFOs, as shown in Fig. 5, was repeated with 4 different sensors. A comparison between the 7 different fertilisers shows clear differences between the sensor responses to these fertilisers, with fertiliser A giving the strongest response (Fig. 6A). A similar pattern was observed when comparing the GC/MS results for the 7 different fertilisers and their ANFOs (Fig. 6B). One would expect that the AN content, and therefore the concentration of its decomposition product NH3, would directly influence the magnitude of the sensing response to each fertiliser. However, although the fertilisers have different compositions, the observed differences in sensor response cannot be explained by the nitrogen content of the fertilisers (Table 1). It is possible that other components impact the level of NH3 that is detected. Additives that behave as desiccants can prevent or slow down the breakdown of AN based fertilisers by removing moisture. Even in small quantities around 0.1% of common additives such as magnesium nitrate play an important role in the stability of the fertiliser.31 Additionally, it is possible that the porosity of the granules affects the amount of NH3 released and therefore the magnitude of the sensor response. The relationship between sensor response and granule porosity could provide valuable information for sensing applications because porosity is known to be one of the most important factors determining explosives properties such as detonation velocity.27
Because the sensors are based on percolation networks of PPy, a small variation in the PPy network can cause a relatively large change in the starting resistance and the sensitivity of the sensor, even for sensors produced using the same electrochemical recipe. This large effect caused by a small change in the network is the same phenomenon that causes the high sensitivity and is therefore inherent to the sensor. However, by calibrating each sensor, using known NH3 concentrations, each sensor can be used accurately and independently. Based on the calibration curve, the average sensing responses in Fig. 6A correspond to ∼13–176 ppb. This is significantly lower than NH3 and ANFO sensitivities previously reported in the literature using CP thin film based vapour sensors.13,14,29,32 The average amount of NH3 measured in the GC/MS experiments in Fig. 6B corresponds to ∼37–686 ppm. Although the sensor and GC/MS measurements were conducted under different experimental conditions and due to the limitations of the GC/MS equipment the average concentrations measured are significantly different, the comparison of the 2 methods demonstrates that both the patterns between different fertilisers and the similarity between the responses to a fertiliser and its ANFO is independent of the method. Furthermore, being able to detect much lower concentrations while operating at room temperature demonstrates the effectiveness of the percolation sensor.
Finally, it is important to note that the ANFO samples used in these experiments were only 1 g. ANFO-based IEDs detected in the field are likely to contain at least 1 kg ANFO,33 but due to safety constraints it was not possible to test our sensors in the presence of such large ANFO samples. However, it is expected that our sensors will give a much larger response to larger samples, similar to the elevated responses measured for increased ammonia concentrations. This larger response will also help compensate for any decreases in response due to for example concealment or interference of others vapours present in the environment.
Conclusions
In conclusion, sensors based on a percolation network of PPy on interdigitated electrodes were successfully used to detect various AN containing fertilisers and ANFO mixtures. The sensor response, an increase in resistance, was rapid and reversible. The high sensitivities achieved with this sensor design offer a significant improvement compared to previously reported CP-based explosives vapour sensors. Additionally, measuring vapour concentrations emitted from ANFO mixtures directly is an enabling step towards real-world IED detection. The sensor results were validated by GC/MS results for the same fertilisers and ANFOs, revealing similar patterns in response to the various samples assessed. Future work is aimed at the practical implementation of this sensor by developing an integrated device and investigating the effects of concealment. Environmental factors such as temperature, humidity and other vapours have to be taken into account, either by recalibrating for real world conditions or by using an electronic nose type set-up. Taking these factors into account as well as incorporating a different sampling method can further improve the sensor performance.Conflicts of interest
There are no conflicts to declare.Acknowledgements
We are grateful to Professor Cesar Sierra for his advice. We thank Yara UK for providing the fertilisers. This work was supported by the EPSRC Global Challenges Research Fund. The GC/MS work was supported by the British Council Newton Fund.References
- C. Kopp, Def. Today, 2008, 4649, 46–49 Search PubMed.
- F. L. Steinkamp, B. Giordano, G. Collins and S. Rose–Pehrsson, Propellants, Explos., Pyrotech., 2015, 40, 682–687 CrossRef CAS.
- J. C. Oxley, J. L. Smith, E. Rogers and M. Yu, Thermochim. Acta, 2002, 384, 23–45 CrossRef CAS.
- J. M. Hendrickx, A. Molina, D. Diaz, M. Grasmueck, H. Moreno and R. Hernández, SPIE Def. Secur. Symp., 2008, 6953, 9 Search PubMed.
- V. V. Hernandes, M. F. Franco, J. M. Santos, J. J. Melendez-Perez, D. R. d. Morais, W. F. d. C. Rocha, R. Borges, W. de Souza, J. J. Zacca, L. P. L. Logrado, M. N. Eberlin and D. N. Correa, Forensic Sci. Int., 2015, 249, 156–164 CrossRef CAS.
- P. Jander and R. Noll, Appl. Spectrosc., 2009, 63, 559–563 CrossRef CAS.
- T. N. Rudakov, Appl. Magn. Reson., 2012, 43, 557–566 CrossRef CAS.
- B. Lakard, S. Carquigny, O. Segut, T. Patois and S. Lakard, Metals, 2015, 5, 1371–1386 CrossRef.
- M. J. Lefferts and M. R. Castell, Anal. Methods, 2015, 7, 9005–9017 RSC.
- M. K. Ram, O. Yavuz and M. Aldissi, Synth. Met., 2005, 151, 77–84 CrossRef CAS.
- K. Dunst, J. Karczewski and P. Jasiński, Sens. Actuators, B, 2017, 247, 108–113 CrossRef CAS.
- Y. Wang, W. Jia, T. Strout, A. Schempf, H. Zhang, B. Li, J. Cui and Y. Lei, Electroanalysis, 2009, 21, 1432–1438 CrossRef CAS.
- P.-G. Su, C.-T. Lee and C.-Y. Chou, Talanta, 2009, 80, 763–769 CrossRef CAS.
- T. A. Ho, T.-S. Jun and Y. S. Kim, Sens. Actuators, B, 2013, 185, 523–529 CrossRef CAS.
- S. J. Toal and W. C. Trogler, J. Mater. Chem., 2006, 16, 2871–2883 RSC.
- S. Sheykhi, L. Mosca and P. Anzenbacher, Chem. Commun., 2017, 53, 5196–5199 RSC.
- B. I. Armitage, K. Murugappan, M. J. Lefferts, A. Cowsik and M. R. Castell, J. Mater. Chem. C, 2020, 8, 12669–12676 RSC.
- H.-J. Hübschmann, Handbook of GC/MS, Wiley Online Library, 2000 Search PubMed.
- P. Suppajariyawat, M. Elie, M. Baron and J. Gonzalez-Rodriguez, Forensic Sci. Int., 2019, 301, 415–425 CrossRef CAS.
- A. Chakrabortty, S. Bagchi and S. C. Lahiri, Aust. J. Forensic Sci., 2015, 47, 83–94 CrossRef.
- H. H. Maurer, in Acta Medicinæ Legalis Vol. XLIV 1994, Springer, 1995, pp. 489–492 Search PubMed.
- C. J. Kirchmer, M. C. Winter and B. A. Kelly, Environ. Sci. Technol., 1983, 17, 396–401 CrossRef CAS.
- A. L. Lubrano, B. Andrews, M. Hammond, G. E. Collins and S. Rose-Pehrsson, J. Chromatogr. A, 2016, 1429, 8–12 CrossRef CAS.
- C. J. Katilie, A. G. Simon and L. E. DeGreeff, Talanta, 2019, 193, 87–92 CrossRef CAS.
- K. Murugappan and M. R. Castell, Electrochem. Commun., 2018, 87, 40–43 CrossRef CAS.
- J. Rowland and R. Mainiero, Proc. Annu. Conf. Explos. Blasting Tech., 2000, 1, 163–174 Search PubMed.
- B. Zygmunt and D. Buczkowski, Propellants, Explos., Pyrotech., 2007, 32, 411–414 CrossRef CAS.
- H. Bai and G. Shi, Sensors, 2007, 7, 267–307 CrossRef CAS.
- H. Kharat, K. Kakde, P. Savale, K. Datta, P. Ghosh and M. Shirsat, Polym. Adv. Technol., 2007, 18, 397–402 CrossRef CAS.
- S. Carquigny, J.-B. Sanchez, F. Berger, B. Lakard and F. Lallemand, Talanta, 2009, 78, 199–206 CrossRef CAS.
- H. Kiiski, PhD Thesis, University of Helsinki, 2009.
- T. Shimanouchi, S. Morita, H.-S. Jung, Y. Sakurai, Y. Suzuki and R. Kuboi, Sens. Mater., 2004, 16, 255–265 CAS.
- L. Figuli, Z. Zvaková, V. Kavický, S. Jangl and M. Vandlícková, Sci. Mil. J., 2016, 11, 34 Search PubMed.
Footnote |
| † Current address: Nanotechnology Research Laboratory, Research School of Engineering, Australian National University, Canberra, ACT 2601, Australia. |
| This journal is © The Royal Society of Chemistry 2021 |