 Open Access Article
Creative Commons Attribution 3.0 Unported Licence
Mapping at the nanometer scale the effects of sea-salt derived chlorine on cinnabar and lead white by using delayed image extraction in ToF-SIMS†
M.
Iorio
ab,
A.
Sodo
*c,
V.
Graziani
ab,
P.
Branchini
ab,
A.
Casanova Municchia
c,
M. A.
Ricci
 c,
O.
Salvadori
d,
E.
Fiorin
d and
L.
Tortora
 *acb
*acb
aLASR3 Surface Analysis Laboratory Roma Tre, via della Vasca Navale 84, 00146 Rome, Italy. E-mail: luca.tortora@uniroma3.it
bNational Institute for Nuclear Physics INFN Roma Tre, via della Vasca Navale 84, 00146 Rome, Italy
cDepartment of Sciences, Roma Tre University, via della Vasca Navale 84, 00146 Rome, Italy. E-mail: armida.sodo@uniroma3.it
dScientific Laboratory of Gallerie dell'Accademia di Venezia, Cannaregio 3553, 30121 Venice, Italy
First published on 3rd March 2021
Abstract
In this work, an innovative analytical approach focused on the use of advanced imaging techniques for the chemical mapping of degradation and/or restoration products is proposed. A representative cross-section showing a very complex stratigraphy from the Saint Wilgefortis Triptych (Hieronymus Bosch), exhibited in the Galleria dell'Accademia di Venezia, was investigated. Time-of-flight secondary ion mass spectrometry (ToF-SIMS) experiments were performed using a time-of-flight detector operating in the so-called delayed extraction mode. The time delay applied during the extraction of the secondary ions permitted mass spectra to be obtained with an excellent mass resolution and chemical maps with nanometer scale spatial resolution. The painting's cross-section was also analysed at the micrometer scale by micro-Fourier transform infrared spectroscopy (micro-FTIR). The combined analytical approaches highlighted the colocalization of lead chloride, oxychloride, and hydroxychloride ions, suggesting the transformation of lead white ((PbCO3)2Pb(OH)2) into laurionite (PbClOH). Furthermore, chlorine appears evenly diffused in the cinnabar (HgS) layer, inducing the alteration of its more external part into calomel (Hg2Cl2). In fact, from the chemical maps the presence in the sample of an unaltered portion of the cinnabar layer is evident. Such degradation products were probably due to the exposure of the painting to a chloride-rich atmosphere for a long time. This led to a global blackening of the painting. To protect the painting from aggressive chemical species, siloxane compounds were probably used as a modern restorative treatment. ToF-SIMS chemical maps revealed permeation of the silicon-based consolidants within the sample's cracks and no interaction products with the other constitutive materials of the painting were found. Finally, the presence of different lead soaps was detected in correspondence with the lead white layer.
1. Introduction
Paintings are usually characterized by a complex multi-layered structure composed of mixtures of organic and inorganic substances.1 The chemical interaction among the painting constituents themselves and with the environment can lead to degradation and aging phenomena.2,3 For this reason, localization and identification of the compounds present in the painting system represent an issue of great importance. In particular, knowledge of the ongoing chemical processes is fundamental to preventing structural and aesthetic damage, especially for artworks stored in an aggressive environment.1,4This is the case of a Hieronymus Bosch painting, the Saint Wilgefortis Triptych, currently exhibited in the Galleria dell'Accademia di Venezia. The painting, between the seventeenth and eighteenth centuries, was housed in the Palazzo Ducale in Venice. Later, the opera was moved to Vienna in 1838 and it came back again to the Palazzo Ducale in 1919 as a property of the Gallerie dell'Accademia. The typical saline environment of the Venice lagoon could lead to some problems with the conservation state of this masterpiece. The presence of marine salt particles (NaCl) can be responsible for the chemical interactions among the original painting components, leading to several degradation phenomena.5,6 In fact, it is stated that inorganic salts are considered very dangerous agents for pigments since, sometimes, the blackening of the originally painted layer could take place.7–13
In a previous study,7 the authors proposed a preliminary approach to study samples from the Bosch painting using Raman spectroscopy and ToF-SIMS in the high mass resolution (HMR) mode to optimize the mass resolution. Raman and mass spectra were collected to answer some particular conservation questions still left open.7
In the present study, different spectroscopic and microscopic imaging techniques were performed to obtain highly resolved chemical maps. In particular, the use of micro-FTIR spectroscopy coupled to ToF-SIMS using the delayed extraction mode is proposed.
Micro-FTIR spectroscopy is at present one of the most used micro-analytical techniques for the analysis of the chemical distribution of materials in heterogeneous samples in the field of cultural heritage conservation.14–16 In addition to identifying the nature of pigments, binders, and fillers in a painting cross-section, FTIR mapping analysis can also be used to detect and localize degradation products (such as calcium oxalate, copper oxalate, metal soaps, etc.) within the painting layers.2–4,14,17,18
On the other hand, ToF-SIMS is a very sensitive surface analytical technique that has recently shown great potentiality as a diagnostic tool in the field of cultural heritage conservation.19–23 The main advantage of ToF-SIMS analysis is due to its capability to enable chemical mapping and collect mass spectra from the same region of interest with a sub-micrometer spatial resolution and a high mass resolution in a single run.24 This analytical technique was recently employed to study the chemical interactions between different constituent materials and the environment.19,20,25–28
It is well known in the literature that ToF-SIMS can be exploited for the identification of inorganic, organic, and biological materials used in paintings; pigments, colorants, and organic and biological binding media can be efficiently detected even when present at low concentrations.29,30 In the same way, degradation processes and past restoration intervention can be identified.10,19,20,29,31,32
In this work, attention is focused on the study of a painting cross-section by the ToF-SIMS imaging technique operating in the delayed extraction of secondary ions. This operation mode allows obtaining at the same time secondary ion images with both high mass and spatial resolution by the extraction of secondary ions from the sample surface having a certain delay after the arrival of the primary ions. A similar approach was first adopted by others24,33–35 in previous works to study several types of samples. ToF-SIMS operating in delayed extraction could help to better discriminate very small regions in painting cross-sections, providing precise chemical information on the spatial distribution of the different degradation products.
To clarify and explain interesting results obtained in the previous work of the authors,7 here a deeper study mainly focused on the localization of degradation and/or restoration products by micro-FTIR and ToF-SIMS imaging in high lateral resolution is proposed. For this purpose, based on the previous results,7 only a representative sample showing a very complex stratigraphy was selected.
2. Materials and methods
2.1 Sample description
The investigated sample is a fragment from the Saint Wilgefortis Triptych (oil on oak panel) by Hieronymus Bosch. During a past intervention for restoration carried out under the Bosch Research and Conservation Project,36 some micro-samples were collected from the painting. The analyses proposed in this work are mainly focused on the study of one of the painting cross-sections prepared and investigated in the previous study of the authors (sample labelled as S6).7 This fragment had been collected from the red dress of a male figure in the painting.7 The sample was detached from the paint surface and kept in a sterile Eppendorf tube. To prepare the polished cross-section (UNI 10922 (2001)), the painting sample, without any preparation, was embedded in polyester media, in which 2% of the catalyst was mixed with liquid polyester/styrene resin (Prochima 820). Initially, a mould was half-filled with the polyester medium and left to harden for 6 h. After the stereomicroscopic observation, the painting sample was transferred to the hardened base layer in the mould with an awl. Finally, the specimen was covered slowly with a freshly prepared polyester embedding medium. The embedment was cured for 24 h. The unrefined cross-section was polished using aluminium oxide abrasive discs (grit sizes: P800/P1200/P1500) on those sides of the sample until the entire painting section could be observed.Fig. 1a shows the painting cross-section areas investigated in this work by ToF-SIMS and micro-FTIR analysis and named Area I and Area II, respectively. In Fig. 1b and c, it is possible to better appreciate the structure of the sample under study. In particular, the SEM-BSE image (Fig. 1c) points out the presence of cracks (pointed by the arrows) in the outermost layers that could represent preferential pathways for the aggressive agents. Besides, a detailed description of the different layers characterizing the painting cross-section according to the previous results is shown in Fig. 1d. The analysis performed on sample S6 identified the presence of seven layers. As shown in Fig. 1d, starting from the bottom, the sample presents a first preparatory layer (∼100 μm) in which calcium carbonate (CaCO3) and a protein-based glue were found. The remaining six layers consist of a very thin oil-based layer (∼5 μm) with a trace of black pigment (second layer) followed by reddish and pinkish layers. The third layer (∼25 μm) was identified as cinnabar and the pinkish layer (fourth layer) above was recognized as lead white (∼60 μm) in which some red lake particles are dispersed. Traces of red lake particles were also observed in the fifth layer (∼15 μm) showing a reddish colour. Finally, a varnish and a grey alteration were observed respectively in the sixth (∼15 μm) and seventh (∼5 μm) layers.
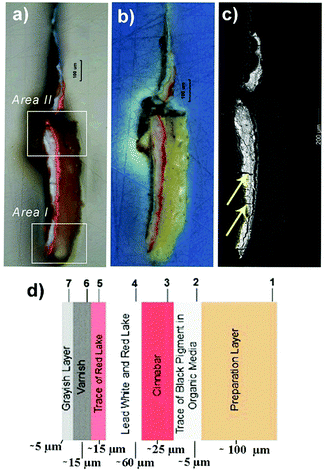 | ||
| Fig. 1 (a) Image of the areas of the painting cross-section (sample S6) under an optical microscope investigated by (i) Area I: ToF-SIMS and (ii) Area II: micro-FTIR analysis; (b) image of sample S6 obtained with UV light; (c) SEM-BSE image of sample S6; (d) stratigraphy of sample S6 according to the previous results.7 | ||
2.2 Scanning electron microscopy (SEM)
The sample was observed with a Philips 505 scanning electron microscope with a detector resolution of 132.34 eV, voltage 20 kV, and filament current (W) 20 mA. The section was spurred with gold under vacuum followed by an application of a silver-based fluid adhesive paste to establish the electrical connection between the section and the sample holder support (aluminium stub). SEM images were obtained in backscattered electrons (SEM-BSE images) with an acquisition spot of 200 nm.2.3 Time-of-flight secondary ion mass spectrometry (ToF-SIMS)
ToF-SIMS experiments were performed in the delayed extraction mode using a customized TOF-SIMS5-300 mass spectrometer (ION-TOF GmbH, Munster, Germany) equipped with a 30 keV Bi LMIG (liquid metal ion gun). It is reported in the literature that the ToF-SIMS apparatus can be used to sputter away the superficial contamination layers from different kinds of samples including biological37 and painting38 samples; this can be accomplished using Ar3000+, Bin+, and C60+ cluster ion beams. In this work, the surface of the painting cross-section was cleaned using a 30 keV Bin+ cluster ion beam on a 500 × 500 μm2 sample area. This was performed to remove adventitious surface contaminants. The ion dose density used for the surface cleaning was calculated to be 2.6 × 10¹⁴ ions per cm2. ToF-SIMS spectra were obtained after the surface cleaning. A Bi3++ ion beam was selected with an incidence angle of 45°. The emitted secondary ions were accelerated to the kinetic energy of 2 keV toward the field-free region. Secondary ions were post-accelerated to the kinetic energy of 10 keV before hitting the detector. Charge neutralization was obtained by using low-energy electrons supplied by a pulsed flood gun. The extraction voltage was set to 1 kV and the delay time was 1.1 μs, operating in the high mass resolution bunched mode. The mass resolution of the Pb+ ion peak in these conditions was 2500.The ion beam was rastered over an area of 200 × 200 μm2 with an ion dose density below the static limit (10−12 ion per cm2). Both positive and negative polarity spectra and images (512 × 512 pixels) of elemental and molecular fragment distributions were recorded. Mass spectra were internally calibrated using both lighter (m/z < 20) and heavier ions (m/z > 20) since in the delayed extraction acquisition mode lighter ions are poorly collected using the mass spectrometer. In particular, C+, CH+, CH2+, CH3+, Pb+, Pb2+, Pb3+, and Pb4+ in the positive ion mode and C−, CH−, CH2−, Cl−, Pb2−, Pb3− and Pb4− in the negative mode were used. The data were acquired and processed using SurfaceLab 6.4 software (ION-TOF GmbH, Munster, Germany). Mass spectra related to the heavier ions used for the calibration are presented in the ESI and shown in Fig. S1 and S2†.
All secondary ion images shown in this paper were normalized to the total ion image. The spatial resolution was determined via a line scan (84%/16% method) on a very small section of a representative ion map (red line, Fig. S3a†). The line scan plot is shown in Fig. S3b† in which the high lateral resolution (0.20 μm) obtained by ToF-SIMS operating in the delayed extraction mode can be appreciated.
2.4 Micro-FTIR spectroscopy
The measurements were performed using a Thermo Scientific Nicolet Continuum FT-IR microscope (15×, 0.58 NA objective) with a liquid-nitrogen-cooled mercury–cadmium–telluride (MCT) detector. The analyses were performed in the reflection mode and the spectra were obtained in the range between 4000 cm−1 and 650 cm−1. The background spectrum was obtained on the gold reference mirror. A total of 200 scans for each spectrum was accumulated and a resolution of 8 cm−1 was used. For all spectra, Kramers–Kronig (KKT) corrections were applied. The data were acquired and processed using Thermo Scientific OMNIC Atlμs software. Raman measurements were performed on Area I after the ToF-SIMS analysis. Some damage probably induced by the laser during Raman measurements was observed. Therefore, micro-FTIR maps were acquired from a very close area (Area II).3. Results and discussion
3.1 Degradation products from painted layers
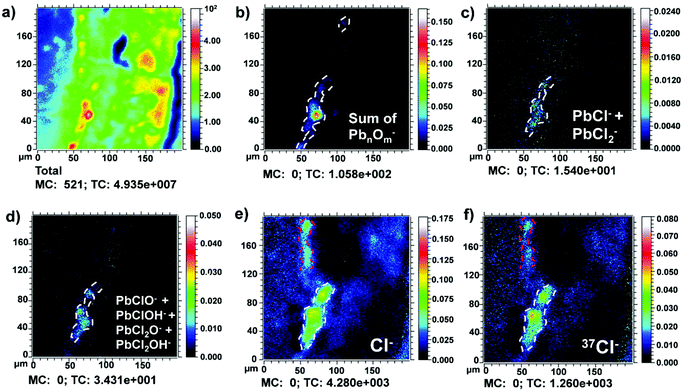
Positive and negative secondary ion maps of the main organic and inorganic compounds and related degradation products detected in the painted layers are explained here. The dashed white and red lines in the ion maps (Fig. 2, 3 and Fig. 5–7) are used to highlight the contour of the chemical maps. Fig. 2a shows the total ion image recorded in the negative mode in sample S6 Area I. Clusters of lead oxide ions were detected (Fig. 2b) in the fourth layer previously recognized as lead white (Fig. 1c). The lead white layer is distributed in the cross-section with a thickness of about 10–20 μm. Furthermore, lead chloride ions (PbCl− and PbCl2−) and lead oxychloride and hydroxychloride ions (PbClO−, PbClOH−, PbCl2O− and PbCl2OH−) were detected and found to be localized in the same area (Fig. 2c and d). The corresponding mass spectra are presented in the ESI and shown in Fig. S4.† The lead chloride and oxychloride ions detected may belong to the mineral laurionite (PbClOH−). It occurs as an oxidation product in lead ore deposits and it is also produced on lead-bearing slag by reaction with saline solutions.12,13 The chlorination of lead white could be correlated to the high concentration of chlorides that characterize the atmosphere of the Venetian lagoon.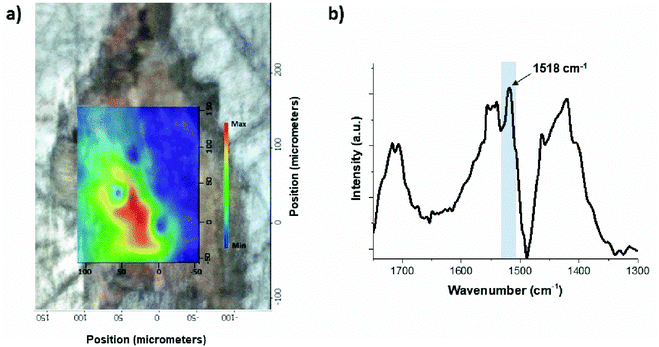 | ||
| Fig. 4 (a) Micro-FTIR map showing the distribution of lead soaps detected in the fourth layer of sample S6 Area II; (b) FTIR spectrum showing the lead carboxylate absorption band (1518 cm−1). | ||
It is interesting also to report that Noun et al.29 have recently given an alternative explanation for the chlorine associated with lead white. Chlorine seems to be related to a historical method of production of the white pigment known as the Dutch process. This process consists in putting metallic lead in specific clay pots containing a solution of acetic acid. They were stored for a prolonged period in a pile of fermenting horse manure (it is rich in sodium chloride) in which heat and carbon dioxide were generated. The combination of acetic acid, heat, and carbon dioxide leads to the transformation of the lead into white basic lead carbonate.29,39
However, in this case, as shown in Fig. 2e and f, the presence of chlorine was distributed even in the underlying layer (dashed white lines), as it often happens during a contamination process. In the sample under study, the outermost layer of varnish seems to be cracked (Fig. 1c), allowing the permeation of dangerous chemical species inside the sample. This suggests that the presence of chlorine, in this case, is mainly related to a degradation phenomenon and not to a production process of the lead white. Besides, chlorine is localized also in the reddish external layer (dashed red lines). It will be commented on later.
In the fourth layer of sample S6 Area I, weak peaks likely attributed to lead soaps were also detected in the positive ion mode (Fig. 3). In general, in ToF-SIMS imaging experiments, the ion distribution recorded in the positive ion mode could appear slightly different compared to the ion distribution recorded in the same area in the negative ion mode. Here, to verify these signals, a region of interest (ROI) in correspondence with the Pb+ area was drawn to avoid the matrix effect of the surrounding area and to collect only the signal arising from the lead white layer. In fact, in Fig. 3b and c, the sum of lead soaps of palmitic acid (m/z 461–463) and the sum of lead soaps of stearic acid (m/z 489–491) are observed respectively in correspondence with the area where also the Pb+ positive ion originates (Fig. 3a). Lead soap characteristic ion signals are shown in Fig. S5.†
Fig. 4a shows the corresponding micro-FTIR map in which the distribution of the lead soaps in the fourth layer is represented. Their presence was confirmed by the identification of the lead carboxylate absorption band at 1518 cm−1 (asymmetric COO− stretch vibration) (Fig. 4b).4,40
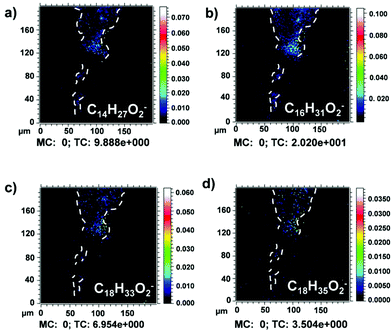
The detection of lead soaps is of great importance since they represent a buffing problem during conservation of artworks because they can produce cracks, white aggregates, and discontinuities on the painting layers, causing aesthetic and chemical damage.41–43 Deprotonated myristic (m/z 227), palmitic (m/z 255), oleic (m/z 281), and stearic (m/z 283) acid ion signals were found in the same area (Fig. 5a–d). High-resolution mass spectra of deprotonated fatty acids were reported in the literature.7,29,44
In addition, several fatty acid characteristic fragment ions at m/z 71, 85, 99, 113, 127, 141, 155, 169, 183, 197, 207, 211, 225, 227, 239, 253, 255, 281, 282, 283, 284, and 285 were detected and mapped in all the painted layers (Fig. S3a†). Their attribution is presented in the literature.23,44
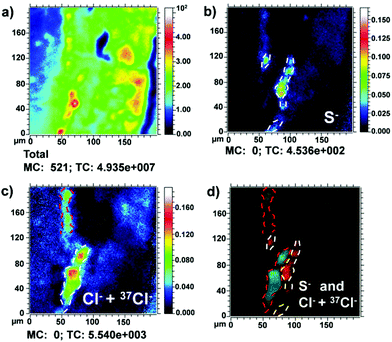
Fig. 6a shows the total ion image recorded in the negative mode in sample S6 Area I. In Fig. 6b and c, the negative ion maps of S− and the sum of Cl− and 37Cl− are shown. The presence of S− ion (dashed white lines) confirms the presence of cinnabar, HgS, in the third layer (10–20 μm) as the authors reported in their previous work.7 Furthermore, here it is possible to better appreciate the presence of the S− ion also in the outermost reddish layer (dashed white lines) (10 μm). This result suggests the use of cinnabar also in the fifth layer (10 μm).
Instead, as mentioned above, the presence of chlorine ions is probably due to the chloride-rich atmosphere typical of the climate in Venice. In Fig. 6d, the effects of these aggressive chemical species over time are shown. The gradual penetration of Cl− and 37Cl− ions within the sample was observed. Moreover, it is shown that these signals (dashed red lines) are immediately superimposed on the innermost cinnabar layer (dashed white lines), suggesting the alteration of the more external part of the cinnabar layer (HgS) into calomel (Hg2Cl2).10 This hypothesis is supported by previous studies using Raman spectroscopy that have revealed the presence of calomel (Hg2Cl2).7
3.2 Restoration products
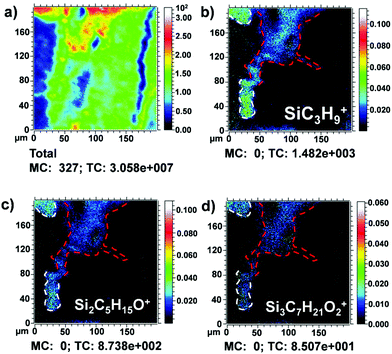
Siloxane ion fragments were observed in the outermost layer (Fig. 7), suggesting the use of a silicon compound (PDMS) as a restoration product.45Fig. 7a shows the total ion image recorded in the positive mode in sample S6 Area I. In Fig. 7b–d, the typical PDMS fragments SiC3H9+ (m/z 73), Si2C5H15O+ (m/z 147) and Si3C7H21O2+ (m/z 221) are shown.46 In Fig. 7b, Pb+ ion signal distribution (dashed red lines) was added in an overlay as a reference signal to better identify the relative position of PDMS ion signals in the complex stratigraphy.
It should be highlighted that polydimethylsiloxane (PDMS) is known as one of the main contaminant species in ToF-SIMS studies.47 However, in this case, the distribution of the ion peaks was mapped as a defined layer, localized homogenously in the most external part of the investigated cross-section (dashed white lines in Fig. 7c and d). This is indicative of an additional layer superimposed after the painting was completed as a conservative intervention. The thickness of the siloxane layer was measured as approximately 10–20 μm.
As shown in Fig. 7c and d, PDMS signals seem also to penetrate the innermost layers (dashed red lines) of the painting. However, also in this case, it was observed in a precise localization of the PDMS-based material within the sample and no interactions with the surrounding material were revealed from the chemical point of view. In the 1990s, siloxane products were usually used as consolidating materials, especially in the treatment of stones.48 For the conservation and restoration of wood and wood-based artifacts, the use of organo-silicon compounds as protective agents is a well-known procedure.49–52 These compounds can be used as wood preservatives to improve the hydrophobicity and weathering performance and to protect against wood-destroying fungi. In the case of this oil on oak panel, it seems reasonable to think that these products have been applied on the damaged areas to protect both the painting and the wooden support against decay. In this way, the presence of the siloxane compound could be attributed to a past intervention of restoration.
4. Conclusions
Based on the obtained results, it is concluded that FTIR mapping analysis and ToF-SIMS experiments performed with high spatial resolution have proved to be very useful to study the complex stratigraphy in a painting cross-section. The multi-analytical approach highlighted the degradation effects that a wood painting can undergo in a marine environment.It was found that chlorine gradually penetrated within the sample, interacting with the more reactive constituent materials of the painting layers in different ways and with different kinetics. The compounds characterizing the outermost layers were subjected to alteration faster than the innermost ones. In particular, the transformation of the outermost lead white ((PbCO3)2Pb(OH)2) layer into laurionite (PbClOH) and the alteration of the more external part of the innermost cinnabar (HgS) layer into calomel (Hg2Cl2) were observed.
Finally, ToF-SIMS chemical maps revealed materials attributable to past restoration interventions. The permeation of a silicon-based compound was observed, and no interaction products with the other constitutive painting materials were detected. In fact, no silicon adducts due to the presence of the consolidant were recognized, suggesting the potential use of these materials for the consolidation of the painting.
Funding
L. T. would like to thank Fondazione Roma (Grant 5229441F37) for research funding. We also acknowledge the funding from Regione Lazio under the Project “MUSA” n. B86C17000280002 and Project ADAMO n. B86C18001220002 of the Excellence Centre at the Lazio Technological District for Cultural Heritage (DTC).Conflicts of interest
There are no conflicts to declare.Acknowledgements
The Surface Analysis Laboratory Roma Tre is part of laboratories within the Italian Institute for Nuclear Physics (INFN) network CHNet and the Excellence Centre at the Lazio Technological District for Cultural Heritage (DTC).References
- E. Joseph, S. Prati, G. Sciutto, M. Ioele, P. Santopadre and R. Mazzeo, Anal. Bioanal. Chem., 2010, 899–910 CrossRef CAS PubMed.
- R. Mazzeo, E. Joseph, S. Prati and A. Millemaggi, Anal. Chim. Acta, 2007, 599, 107–117 CrossRef CAS PubMed.
- F. Bordignon, P. Postorino, P. Dore, M. L. Tabasso, F. Bordignon, P. Postorino, P. Dore and M. L. Tabasso, Stud. Conserv., 2019, 53, 158–169 CrossRef.
- E. J. Henderson, K. Helwig, S. Read and S. M. Rosendahl, Heritage Sci., 2019, 1–15 CrossRef CAS PubMed.
- E. Kotulanová, P. Bezdǐ, D. Hradil, J. Hradilová and S. Svarcová, J. Cult. Herit., 2009, 10, 367–378 CrossRef.
- T. Palomar, A. Chabas, D. M. Bastidas, D. de la Fuente and A. Verney-Carron, J. Non-Cryst. Solids, 2017, 471, 328–337 CrossRef CAS.
- A. Sodo, L. Tortora, P. Biocca, A. Casanova Municchia, E. Fiorin and M.A. Ricci, J. Raman Spectrosc., 2018, 150–160, DOI:10.1002/jrs.5479.
- M. Radepont, W. de Nolf, K. Janssens, G. Van derSnickt, Y. Coquinot, L. Klaassen and M. Cotte, J. Anal. At. Spectrom., 2011, 26, 959 RSC.
- M. Radepont, Y. Coquinot, K. Janssens, J. Ezrati, W. De Nolf and M. Cotte, J. Anal. At. Spectrom., 2015, 30, 599–612 RSC.
- K. Keune and J. J. Boon, Anal. Chem., 2005, 77, 4742–4750 CrossRef CAS PubMed.
- E. Kotulanová, P. Bezdička, D. Hradil, J. Hradilová, S. Švarcová and T. Grygar, J. Cult. Herit., 2009, 10, 367–378 CrossRef.
- S. Švarcová, D. Hradil, P. Bezdička and T. Grygar, Acta Res. Rep., 2009, 18, 27–31 Search PubMed.
- S. Regenspurg, D. Legesse and D. Carolin, Environ. Earth Sci., 2016, 75, 1–10 CrossRef CAS.
- S. Prati, I. Bonacini, G. Sciutto, A. Genty-Vincent, M. Cotte, M. Eveno, M. Menu and R. Mazzeo, Appl. Phys. A, 2016, 122, 1–16 CrossRef CAS.
- M. F. La Russa, S. A. Ruffolo, G. Barone, G. M. Crisci, P. Mazzoleni and A. Pezzino, Int. J. Spectrosc., 2009, 893528 Search PubMed.
- A. Rizzo, Anal. Bioanal. Chem., 2008, 392, 47–55 CrossRef CAS PubMed.
- E. Pięta, J. Olszewska-Świetlik, C. Paluszkiewicz, A. Zając and W. M. M. Kwiatek, Vib. Spectrosc., 2019, 103, 102928 CrossRef.
- M. Spring, C. Ricci, D. A. Peggie and S. G. Kazarian, Anal. Bioanal. Chem., 2008, 37–45 CrossRef CAS PubMed.
- M. Iorio, V. Graziani, S. Lins, S. Ridolfi, P. Branchini, A. Fabbri, G. Ingo, G. Di Carlo and L. Tortora, Appl. Sci., 2019, 9, 3016 CrossRef CAS.
- V. Graziani, M. Iorio, M. Albini, C. Riccucci, G. Di Carlo, P. Branchini and L. Tortora, Front. Mater., 2020, 7, 32 CrossRef.
- G. M. Ingo, C. Riccucci, M. Pascucci, E. Messina, C. Giuliani, P. Biocca, L. Tortora, G. Fierro and G. Di Carlo, Appl. Surf. Sci., 2018, 446, 168–176 CrossRef CAS.
- L. Tortora, F. Notaristefani and M. Ioele, Surf. Interface Anal., 2014, 46(10–11), 807–811, DOI:10.1002/sia.5450.
- P. Biocca, P. Santopadre, G. Sidoti, G. Sotgiu, F. Notaristefani and L. Tortora, Surf. Interface Anal., 2016, 48, 404–408 CrossRef CAS.
- Q. P. Vanbellingen, N. Elie, M. J. Eller, S. Della-Negra, D. Touboul and A. Brunelle, Rapid Commun. Mass Spectrom, 2015, 29, 1187–1195 CrossRef CAS PubMed.
- G. M. Ingo, S. Balbi, T. De Caro, I. Fragalà, E. Angelini and G. Bultrini, Appl. Phys. A: Mater. Sci. Process., 2006, 83, 493–497 CrossRef CAS.
- A. El Menjra, A. Seyeux, D. Mercier, I. Beech, Z. Makama and P. Marcus, Appl. Surf. Sci., 2019, 484, 876–883 CrossRef CAS.
- B. Zhang, A. I. Ikeuba, B. Zhang, J. Wang, E. Han and W. Ke, Appl. Surf. Sci., 2019, 490, 535–545 CrossRef.
- A. Marzec, B. Szadkowski, J. Rogowski, W. Maniukiewicz, M. I. Szynkowska and M. Zaborski, Materials, 2019, 12, 360 CrossRef CAS PubMed.
- M. Noun, E. Van Elslande, D. Touboul, H. Glanville, S. Bucklow and A. Brunelle, J. Mass Spectrom., 2016, 51, 1196–1210 CrossRef CAS PubMed.
- M. Smoluch, G. Grasso, P. Suder and J. Silberring, Mass Spectrometry An Applied Approach, John Wiley & Sons, Inc., 2nd edn, 2019 Search PubMed.
- Z. E. Voras, K. DeGhetaldi, M. B. Wiggins, B. Buckley, B. Baade, J. L. Mass and T. P. Beebe, Appl. Phys. A, 2015, 121, 1003–1018 CrossRef PubMed.
- J. Sanyova, S. Cersoy, P. Richardin, O. Lapr, P. Walter and A. Brunelle, Anal. Chem., 2011, 753–760 CrossRef CAS PubMed.
- A. Henss, S. Otto, K. Schaepe, L. Pauksch, K. S. Lips and M. Rohnke, Biointerphases, 2018, 13, 03B410 CrossRef PubMed.
- H. K. Shon, S. Yoon, J. H. Moon and T. G. Lee, Biointerphases, 2016, 11, 02A321 CrossRef PubMed.
- J. L. S. Lee, I. S. Gilmore, I. W. Fletcher and M. P. Seah, Appl. Surf. Sci., 2008, 255, 1560–1563 CrossRef CAS.
- M. Ilsink, J. Koldeweij, R. Spronk, L. Hoogstede, R. G. Erdmann, R. K. Gotink, H. Nap and D. Veldhuizen, Hieronymus Bosch, Painter and Draughtsman Catalogue Raisonné, 2015 Search PubMed.
- J. Park, H. Min, Y. Kim, K. Shon, J. Kim, W. Moon and T. Geol, Surf. Interface Anal., 2009, 41, 694–703 CrossRef CAS.
- M. Vermeulen, C. Poleunis, A. Delcorte, P. Bertrand and J. Sanyova, Surf. Interface Anal., 2014, 781–785 CrossRef CAS.
- R. J. Gettens, H. Kuhn and W. T. Chase, Studies in Conservation, 1967, vol. 12, pp. 125–139 Search PubMed.
- M. J. Plater, B. De Silva, T. Gelbrich, M. B. Hursthouse, C. L. Higgitt and D. R. Saunders, Polyhedron, 2003, 22, 3171–3179 CrossRef CAS.
- K. Keune and J. J. Boon, Stud. Conserv., 2007, 52, 161–176 CrossRef CAS.
- C. Higgitt, M. Spring and D. Saunders, Natl. Gall. Tech. Bull, 2003, vol. 24, pp. 75–95 Search PubMed.
- G. Chiavari, D. Fabbri and S. Prati, J. Anal. Appl. Pyrolysis, 2005, 74, 39–44 CrossRef CAS.
- K. Keune and J. J. Boon, Anal. Chem., 2004, 76, 1374–1385 CrossRef CAS PubMed.
- X. Dong, A. Proctor and D. M. Hercules, Macromolecules, 1997, 9297, 63–70 CrossRef.
- P. S. Hale, P. Kappen, W. Prissanaroon, N. Brack, P. J. Pigram and J. Liesegang, Appl. Surf. Sci., 2007, 253, 3746–3750 CrossRef CAS.
- F. Reich, in ToF-SIMS: Materials Analysis by Mass Spectrometry, ed. J. C. Vickerman and D. Briggs, IM Publications LLP and SurfaceSpectra Limited, UK, 2013, pp. 397–416 Search PubMed.
- E. Doehne and C. A. Price, Stone conservation An Overview of current Research, Getty Conservation Institute, 2nd edn, 2010 Search PubMed.
- D. Panov and N. Terziev, Int. Biodeterior. Biodegrad., 2009, 63, 456–461 CrossRef CAS.
- C. Mai and H. Militz, Wood Sci. Technol., 2004, 37, 339–348, DOI:10.1007/s00226-003-0205-5.
- C. A. S. Hill, M. R. M. Farahani and M. D. C. Hale, Holzforschung, 2004, 58, 316–325 CAS.
- S. Donath, H. Militz and C. Mai, Holzforschung, 2006, 60, 210–216 CAS.
Footnote |
| † Electronic supplementary information (ESI) available. See DOI: 10.1039/d0an02350g |
| This journal is © The Royal Society of Chemistry 2021 |

