DOI:
10.1039/D0AN02118K
(Paper)
Analyst, 2021,
146, 2653-2663
In situ characterisation of phytohormones from wounded Arabidopsis leaves using desorption electrospray ionisation mass spectrometry imaging†
Received
26th October 2020
, Accepted 3rd February 2021
First published on 25th February 2021
Abstract
Phytohormones (plant hormones) are a group of small signalling molecules that act as important endogenous regulators in plant development and stress responses. Previous research has identified the phytohormone species, jasmonates, auxins and abscisic acid, and their related compounds in stressed leaf extracts. However, in situ visualisations of endogenous phytohormones from intact plant tissues remain elusive without the usage of labels or reporters. Mass spectrometry imaging is a label-free analytical technique that has been successfully applied for the direct detection of plant proteins, lipids, carbohydrates and many other biomolecules. In this study, desorption electrospray ionisation mass spectrometry imaging (DESI-MSI) was used for high throughput visualisation and evaluation of wound-induced phytohormones inside Arabidopsis thaliana leaves. The results showed higher levels of jasmonates, salicylic acid, abscisic acid and indole-3-acetic acid in their ion intensity maps established from wounded leaves compared to control leaves, which have been validated in the parallel liquid chromatography–mass spectrometry quantification, and the untainted distributions of the identified phytohormones in leaves were confirmed by mass spectrometry imaging of instant leaf imprinted thin-layer chromatography plate samples. Further statistical analysis has not only demonstrated a significant increase of jasmonic acid and its precursor compounds in wounded leaves/regions but also highlighted a potential correlation in different phytohormone species. Our results suggest that DESI-MSI can be used to in situ characterise multiple phytohormone compounds from intact leaves with 200 μm spatial resolution to provide insight into phytohormone distributions in wounded leaves, along with their correlated precursors and metabolites under mechanical stress.
Introduction
Phytohormones are widely present small molecules that frequently serve as important signalling compounds in almost all plant organs.1 Unlike other endogenous compounds, such as polysaccharides and proteins, phytohormones are produced in very low amounts by plant cells; yet, they are key regulators of seed germination, leaf development, flowering, biotic and abiotic stress responses and many other biological activities.2–4 Major phytohormone species, including jasmonic acid (JA), abscisic acid (ABA), auxins (mainly indole-3-acetic acid, IAA), salicylic acid (SA), ethylene, and cytokinins (CKs), have been identified from mechanically stressed plants, and they are responsible for mediating downstream metabolic pathways.5,6 For example, JA, as the key wound-induced phytohormone, stimulates the crosstalk with other endogenous molecules and triggers the expression of wound-induced genes, such as coronatine-insensitive 1 (COI-1) and jasmonate ZIM-domain (JAZ).7 Currently, many phytohormone metabolites have been visualised separately in tissues; however, a comprehensive picture to reveal the connection of phytohormones with precursors and metabolites inside the wounded plant tissue is still a blind spot in the field of phytohormone studies and a higher throughput analytical imaging method is required to address it.
Mass spectrometry (MS) is a high-throughput analytical technique, which has been applied to plant research for biomolecule profiling and quantification for many years.8 When compared to other analytical methods, MS has higher sensitivity and reproducibility in distinguishing low-abundance compounds and functional metabolites from complex molecular backgrounds.9 In a recent study, liquid chromatography–tandem mass spectrometry (LC-MS/MS) has been applied to Arabidopsis thaliana to quantify the wound-induced phytohormones in stressed and distal leaves.10 However, the spatial details of targeted compounds are missing as all the morphological structures were homogenised during sample preparation. Aiming to retain the important regional morphology, mass spectrometry imaging (MSI) has been developed to detect proteins, lipids, metabolites and other small molecules from the sample surface or sections.11 This method, which combines spectral data with tissue morphological analysis, provides a new opportunity to observe phytohormone changes at the microscopic scale. Considering necessary spatial resolutions of the leaf morphology (at least 200 μm) and low-molecular-weight target analytes in phytohormone analysis, desorption electrospray ionisation mass spectrometry imaging (DESI-MSI), which is an ambient imaging technique, has been chosen to ensure that the molecular images of plant samples are close to those present in the natural state.12 Moreover, DESI-MSI can also detect compounds indirectly from the thin-layer chromatography (TLC) plate or the polytetrafluoroethylene (PTFE) membrane, extending its application in the field of plant chemical studies.13,14 Notably, TLC plates have been used for phytohormone separation and TLC-MS analysis for many years, which makes them an ideal base material for tissue imprinting MSI experiments.15,16
In the presented research, we utilised DESI-MSI to examine the spatial distribution and abundance differences of phytohormones and their precursors and metabolites from wounded leaves and leaf-imprinted TLC plates. Our results not only demonstrate the different levels of JA, SA, IAA and ABA between wounded and unwounded leaves that were detected in the LC-MS/MS analysis but also further show their heterogeneous distributions and high correlations inside the wounded regions. These results prove that DESI-MSI is a valuable technique for the in situ characterisation of phytohormones and their metabolites from the same area and provides more comprehensive evidence of hormone crosstalk during abiotic stress.
Experimental
Standard infusion
Stable isotope-labelled and unlabelled standards, including (±)-JA, 3-oxo-2-(2-pentenyl)-cyclopentane-1-butyric acid (OPC-4), 3-oxo-2-(2-pentenyl)-cyclopentane-1-hexanoic acid (OPC-6), 3-oxo-2-(2-pentenyl)-cyclopentane-1-octanoic acid (OPC-8), dinor-12-oxo-phytodienoic acid (dn-OPDA), cis-(+)-12-oxo-phytodienoic acid (OPDA), 11/12-hydroxyjasmonic acid (OH-JA), SA, IAA, (+)-cis,trans-ABA and phaseic acid (PA), were purchased from OlChemIm Ltd (Olomouc, Czech Republic) and used for peak assignment, mass calibration, and quantification of endogenous phytohormones and related compounds.
Unlabelled standards were diluted to a concentration of 1 μM in 95% MeOH (v/v) containing 0.1% ammonia (Merck, Darmstadt, Germany) and infused into the MS instrument using Harvard Syringe Pumps (Cambridge, UK) at a flow rate of 3 μL min−1. The MS and MS/MS spectra of all standards were acquired using a Synapt G2-Si MS instrument coupled to a DESI ion source (Waters, Milford, MA, USA). The optimised collision energies for analyte fragmentation were between 10 and 20 eV, accordingly. Precursors and major fragment ions of the standard compounds were identified using MassLynx™ software (v4.1, Waters), after which the Human Metabolome Database (HMDB 4.0) and NIST Standard Reference Database (version: 2018-08-10) were consulted to confirm the molecular formulas.17,18
Plant samples
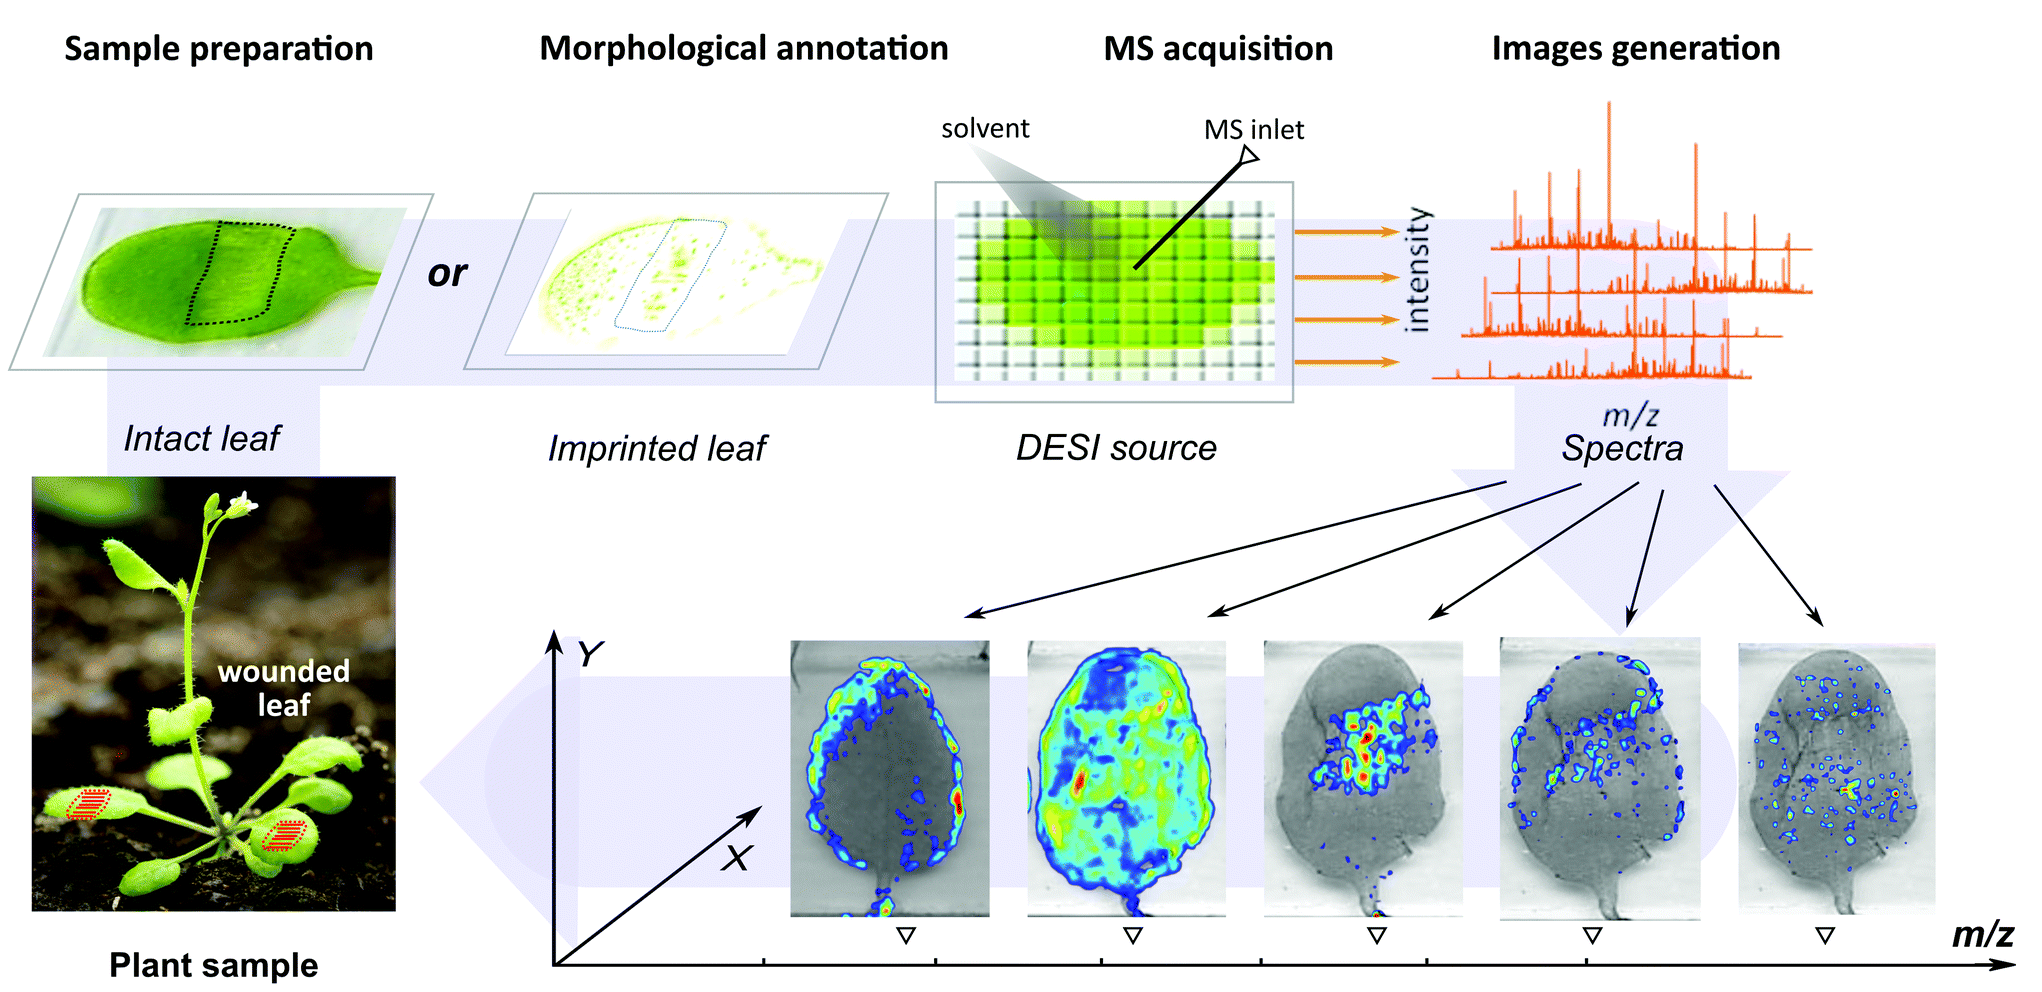
Arabidopsis thaliana (ecotype Columbia, Col-0) plants were cultivated in a growth chamber under short-day conditions (light 24 °C, 8 h; dark 18 °C, 16 h) for five weeks after seeding for in situ detection. To induce mechanical stress, the middle regions of Arabidopsis leaves were wounded using a jaw tweezer press and harvested together with unwounded control leaves in the 30 min time point after wounding for subsequent analysis. Individual leaves weighing between 5 and 8 mg (fresh weight) were collected and cleaned using ultrapure water for DESI-MSI and LC-MS/MS analyses. The surface cuticle of intact leaves was removed using a 30 s petroleum ether wash and the leaves were mounted on Superfrost glass slides (Thermo Fisher Scientific, Waltham, MA, USA) using non-conductive double-sided tape (Plano GmbH, Wetzlar, Germany). Sample slides were rapidly dried in a vacuum desiccator (Merck), scanned and subjected to direct DESI-MSI analysis. Leaves used for imprinting experiments were quickly washed with ultrapure water and directly placed on TLC plates (Merck), which were pre-wetted with petroleum ether. A pair of aluminium plates were placed on the side of the plate and high pressure was applied for 30 s using a bench vice. Next, the imprinted TLC plates were attached to glass slides with double-sided tape, scanned, and subjected to DESI-MSI analysis. The schematic workflow for the DESI-MSI experiment is shown in Fig. 1.
 |
| | Fig. 1 Analytical workflow for the in situ DESI-MSI analysis of wound-induced phytohormones and other targeted analytes from intact and imprinted leaf samples. | |
DESI-MSI
DESI-MSI for in situ visualisation of phytohormones was performed using a Synapt G2-Si MS instrument coupled to a DESI source (Waters). The spray solvent (95% methanol (v/v) with 0.1% ammonia for intact leaves; 100% ACN (v/v) with 0.1% ammonia for imprints) was delivered at 3 μL min−1 and nebulised with 0.45 Mbps ultrapure nitrogen on sample slides. The DESI source was optimised as follows: tip-to-surface distance: 2 mm; tip-to-inlet distance: 5 mm; incidence angle: 55°; collection angle: 10°; capillary voltage: 4 kV; cone voltage: 30 eV; m/z range: 100–300, with 16![[thin space (1/6-em)]](https://www.rsc.org/images/entities/char_2009.gif) 000–17000 full width at half-maximum (FWHM) mass resolution. Data were acquired in the negative mode using MassLynx™ software (v4.1, Waters, Milford, MA, USA). Spectra, with a spatial resolution of 200 μm, were acquired every second. All acquired spectra were then re-calibrated with the exact mass of the internal standard, palmitic acid (m/z 255.2324), while the standards that were added as spots on the edge of the sample slide served as external mass calibrations. DESI-MS/MS was performed on intact and imprinted samples with a 5–20 eV collision energy scanning of the wounded regions. The acquired MS/MS spectra were processed into peak lists, and the correct molecular formulas were first calculated using MassLynx™ software (v4.1) and then identified by their masses acquired from the standard solution.
000–17000 full width at half-maximum (FWHM) mass resolution. Data were acquired in the negative mode using MassLynx™ software (v4.1, Waters, Milford, MA, USA). Spectra, with a spatial resolution of 200 μm, were acquired every second. All acquired spectra were then re-calibrated with the exact mass of the internal standard, palmitic acid (m/z 255.2324), while the standards that were added as spots on the edge of the sample slide served as external mass calibrations. DESI-MS/MS was performed on intact and imprinted samples with a 5–20 eV collision energy scanning of the wounded regions. The acquired MS/MS spectra were processed into peak lists, and the correct molecular formulas were first calculated using MassLynx™ software (v4.1) and then identified by their masses acquired from the standard solution.
LC-MS/MS
Arabidopsis thaliana (Col-0) leaves were freshly collected and preserved on dry ice before phytohormone quantification. The untainted wounded and control leaves, and wounded and unwounded regions of the stressed leaves were separately harvested in Eppendorf tubes, each of them containing at least 10 mg of tissues. The samples were extracted in 1 mL of ice-cold 10% MeOH (v/v) extraction buffer containing a cocktail of labelled standards, and then homogenised in a vibration mill (MM301, Retsch GmbH & Co. KG, Haan, Germany). The homogenised sample solution was purified using Oasis HLB columns (30 mg per 1 ml, Waters) and eluted in 80% MeOH (v/v) for LC-MS/MS analysis, which was performed according to the method reported by Floková et al.10 using an Acquity UPLC I-Class system coupled to a Xevo TQ-S MS system (all from Waters).
Data analysis
The acquired spectra were recalibrated using the mass of palmitic acid (m/z 255.2324) and processed into an imzML format using HD imaging software (Waters, UK). Subsequently, it was analysed using msIQuant 2.x (Uppsala University, Sweden), where the data were processed for baseline removal, total ion count (TIC) normalisation, peak assignments and ion intensity map creation. The peaks assigned as phytohormones and precursor compounds acquired from wounded and control leaves, and regions of interest (ROIs), containing wounded regions and unwounded regions, of the wounded samples, were selected to determine the average signal intensities for each studied compound with a 0.1 mDa binning window in every comparison group. Differences in the normalised intensities of the studied compounds between different ROIs (leaves and regions) were analysed using an in-house R script, which provided the mean, standard deviation, and statistical significance in the bar plots (based on Student's t-test). Image correlation was performed based on the Pearson correlation coefficient of peak TIC intensities.
Results and discussion
Targeted phytohormones
The predicted peak masses assigned as JA and other major wound-induced phytohormone compounds were established by DESI-MS infusion. The unlabelled standards were diluted to 1 μM in the spray solvent and introduced into the DESI source. Although small molecules like phytohormones are frequently measured in the positive mode in LC-MS/MS analysis, a majority of phytohormone species and related metabolites showed higher intensities in the negative mode rather than the positive mode in the DESI source.19 For JA and its precursor compounds, they displayed low signal intensities and limited mass resolutions in the positive-mode spectra acquired from DESI-MS analysis (ESI†). Considering the very small amount of phytohormones inside Arabidopsis leaves, the positively charged ions were not suitable for this in situ characterisation study. The deprotonated ions of all targeted compounds were detected within the 10 ppm range from their calculated masses, and the peak list is shown in Table 1. The double-charged ions were not presented in the standard infusion spectra; for this reason, the theoretical masses of targeted phytohormones were calculated according to the respective molecular formulas. Therefore, the ion peak detected at m/z 209.1176 corresponded to the deprotonated mass [M − H]− of JA, while other phytohormone peaks, m/z 137.0240, 174.0543 and 263.1292, corresponded to key wound-induced phytohormones identified in this analysis, namely, SA, IAA and ABA, respectively. Besides, the expected phytohormone precursors and metabolites in leaves were also assigned with their standard peaks in this analysis (Table 1). Noteworthily, cytokinins and JA-Ile are not included in this study due to their complicated detection together with other studied compounds in the negative mode. The molecular structures assigned for the fragment ions in DESI-MS/MS were clarified by matching the measured peak mass values with previous records in online databases (HMDB and NIST).17,18
Table 1 Molecular formulas and predicted masses assigned for the endogenous wound-induced phytohormone compound peaks in DESI-MSI and DESI-MS/MS analyses
| Compound names |
Molecular formula |
Theoretical massa |
[M − H]− calculatedb |
Infusion standard massc |
Mass shiftd |
| (ppm) |
mDa |
|
The theoretical weights of the phytohormone compounds were calculated based on their molecular formulas using ACD/ChemSketch (v2018.12.1).
The calculated monoisotopic masses of the studied compounds in the negative mode.
The deprotonated masses of standard compounds were measured in the negative ion mode with over 15000 FWHM mass resolution.
The mass error was calculated as the differences between peak centres measured for standard compounds and their calculated mass.
|
| JA |
C12H18O3 |
210.26952 |
209.1178 |
209.1176 |
−1.0 |
−0.2 |
| OPC-4 |
C14H22O3 |
238.32268 |
237.1491 |
237.1494 |
1.3 |
0.3 |
| OPC-6 |
C16H26O3 |
266.37584 |
265.1804 |
265.1797 |
−2.6 |
−0.7 |
| OPC-8 |
C18H30O3 |
294.42900 |
293.2117 |
293.2126 |
3.7 |
0.8 |
| dn-OPDA |
C16H24O3 |
264.35996 |
263.1647 |
263.1650 |
0.4 |
0.1 |
| OPDA |
C18H28O3 |
292.41312 |
291.1960 |
291.1962 |
0.7 |
0.2 |
| OH-JA |
C12H18O4 |
226.26892 |
225.1127 |
225.1129 |
0.9 |
0.2 |
| IAA |
C10H9NO2 |
175.18396 |
174.0555 |
174.0543 |
−6.9 |
−1.2 |
| ABA |
C15H20O4 |
264.31690 |
263.1283 |
263.1292 |
3.4 |
0.9 |
| PA |
C15H20O5 |
280.31630 |
279.1232 |
279.1241 |
3.2 |
0.9 |
| SA |
C7H6O3 |
138.12074 |
137.0239 |
137.0240 |
0.7 |
0.1 |
Direct DESI-MSI
To ensure that the signals of the phytohormones extracted from a single leaf can be detected by the MS instrument, 0.1% (v/v) ammonia was added into the spray solvent to improve the ionisation and signal intensities of the studied compounds.20,21 In total, twelve five-week-old Arabidopsis plants whose individual leaf weights were between 5 and 8 mg were selected for this imaging study. A total of six wounded and six unwounded control leaves were freshly harvested and the front side of intact leaves was subjected to DESI-MSI analysis (Fig. 1). The annotated morphology of the leaves, with the wounded and unwounded regions delimited, is shown in Fig. 2a and b. This direct DESI-MSI study focused on the differences in the levels of specific phytohormones and metabolites between wounded and control leaves, and further investigated the regional differences inside the wounded leaf. DESI-MSI data from intact samples were acquired with a spatial resolution of a few cell length scale (200 μm), and deprotonated molecular ions were detected in the m/z 100–300 range with over 15000 FWHM mass resolution. Peaks assigned as the wound-induced phytohormones were found within the 10 ppm window of the masses determined for the standard compounds using MassLynx™ software (Table 1). Aiming to avoid overlapping peaks, raw spectra were further processed using msIQuant (v2.x), and ion intensity maps were produced using the mean peak intensities within the 0.1mDa binning range of all target standard masses (Fig. 2c–j).22 The peak lists of all targeted compounds processed from the DESI-MSI data of leaves are shown in the ESI.†
 |
| | Fig. 2 Direct DESI-MSI images describing the localisation of phytohormones (JA, SA, IAA and ABA) in a pair of sample leaves. Leaf morphology patterns are shown in the (a) annotated image of the wounded and unwounded regions delimited inside the stressed leaf and (b) image of a control leaf. Distribution of JA in the wounded (c) and control (d) leaves; distribution of SA in the wounded (e) and control (f) leaves; distribution of IAA in the wounded (g) and control (h) leaves; and distribution of ABA in the wounded (i) and control (j) leaves. The peak intensity levels are displayed in the nearby scale bar. | |
In the ion intensity maps created from the representative pair leaves, phytohormone peaks m/z 209.1176, 137.0240 and 174.0543 assigned as JA, SA, and IAA, respectively, were mainly observed from the wounded leaf, in contrast to almost no signal detected in the control leaf in the given intensity ranges (Fig. 2c–h). Importantly, the JA peak displayed a significantly high intensity in the middle of the leaf that was co-registered as the wounded region (Fig. 2c). Similar spatial distributions appeared in the ion intensity map of m/z 263.1292, assigned as ABA, but the peak was also observed in the unwounded region and control sample, which might be unable to differentiate the stressed area from the rest of the samples. In this study, phytohormone species, SA, JA, ABA and IAA, showed their unique distributions inside wounded leaves. JA, which is a well-studied wound-induced compound, highlighted the regions damaged by the tweezer, providing strong evidence that JA biosynthesis starts from the wounded cells rather than from undamaged cells.
Furthermore, the ion intensity maps of the assigned peaks demonstrate that JA precursors OPC-4 and dn-OPDA (detected at m/z 237.1494 and 263.1650, respectively) were also accumulated in the wounded region in comparison with the unwounded region (Fig. 3c and k) and the control leaf (Fig. 3d and l). While the spatial distribution of two other precursors, OPC-6 (m/z 265.1797) and OPC-8 (m/z 293.2126), also showed more abundances (higher intensity levels) in the wounded regions of the stressed leaf, OPC-6 and OPC-8 peaks were also present in the midribs and margins of the control samples (Fig. 3e–h). As one of the most abundant phytohormone-related compounds in Arabidopsis leaves, the OPDA peak (m/z 291.1962) was detected from both wounded and control leaves without any obvious intensity difference (Fig. 3i and j). In general, all JA precursors involved in the octadecanoid pathway were present in high intensities in the wounded region except for OPDA, the first precursor derived from linolenic acid, which had a relatively higher abundance in the unwounded region (Fig. 3). Instead, the localization of another suspected JA precursor, dn-OPDA, was quite similar to JA and other precursor peaks in their ion intensity maps. Many phytohormone metabolites could be assigned and showed unique distributions in the DESI-MSI results. For example, the assigned peaks of wound-induced JA metabolite OH-JA (m/z 225.1129) showed no difference inside the wounded leaf and were evenly spread on the whole leaf surface, even though its average intensity was still higher than that in the control leaf (Fig. 3m and n). Another ABA-related metabolite was assigned as PA (m/z 279.1241) that is highlighted in the same position of ABA in pair samples that did not show any significant difference (Fig. 3o and p). Noteworthily, based on the peak list data acquired from the rest of the plant samples, each of the tested compounds had a consistent pattern in each pair of wounded and control leaves.
 |
| | Fig. 3 Direct DESI-MSI images describing the localisation of phytohormone-related compounds in a pair of sample leaves. Annotated images of the wounded (a) and control (b) leaves; (c) annotated image of the OPC-4 distribution in a sample leaf with the wounded region delimited and (d) image of the OPC-4 distribution in a control leaf; distribution of OPC-6 in the wounded (e) and control (f) leaves; distribution of OPC-8 in the wounded (g) and control (h) leaves; distribution of OPDA in the wounded (i) and control (j) leaves; distribution of dn-OPDA in the wounded (k) and control (l) leaves; distribution of OH-JA in the wounded (m) and control (n) leaves; and distribution of PA in the wounded (o) and control (p) leaves. The peak intensity levels are displayed in the nearby scale bar. | |
DESI-MSI of imprinted samples
Considering the potential degradation of endogenous compounds during the course of sample preparation and data acquisition, additional pairs of wounded and control leaves were cultivated and treated in the same way as described above but rapidly imprinted on TLC plates. In general, freshly harvested leaf samples were directly set onto pre-wetted TLC plates and subsequently pressed using a bench vice for 30 s (Fig. 1). Six pairs of leaves were imprinted on TLC plates and subjected to indirect DESI-MSI analysis. The annotated images of the imprinted TLC plates, including wounded and unwounded regions, are shown in Fig. 4a and b. These images were used for co-registration with the ion intensity maps. The detected compounds were measured from the imprinted TLC plates at a spatial resolution of 200 μm and in the m/z range of 100–300 with over 15000 FWHM mass resolution. The peaks assigned as wound-induced phytohormones and other targeted compounds were also detected within the 10 ppm range of their standard masses and are presented in Table 1. It should be noted that all phytohormone peak intensity levels acquired from leaf-imprinted TLC plates were relatively weaker than those from the analysis of intact samples. The DESI-MSI data from imprinted samples were processed using msIQuant (v2.x), and the ion intensity maps of JA and other phytohormones were created using the peak intensities acquired within the 0.1 mDa binning range of the corresponding masses.
 |
| | Fig. 4 Imprint DESI-MSI images from a pair of sample leaves that had been imprinted on TLC plates. (a) Annotated image of an imprinted sample leaf with the wounded and unwounded regions delimited and (b) image of a control leaf imprint; distribution of JA in the wounded (c) and control (d) leaf imprint; distribution of SA in the wounded (e) and control (f) leaf imprint; distribution of IAA in the wounded (g) and control (h) leaf imprint; and distribution of ABA in the wounded (i) and control (j) leaf imprint. The peak intensity levels are displayed in the nearby scale bar. | |
An expected, a relatively high peak intensity for the mass m/z 209.1176 (JA) was detected from wounded region imprints of the TLC plate (Fig. 4c), in contrast with the lower intensities detected from the unwounded area and control imprints in the same intensity range (Fig. 4c and d). Similar patterns were also found in the ion intensity maps created for SA and ABA, whose assigned peaks m/z 137.0240 and 263.1292 were mainly found in the wounded and nearby regions (Fig. 4e and i) as is apparent from the comparison with their peaks in the intact leaves. The peak assigned as IAA, m/z 174.0543, was identified from the wounded leaf imprint with a relatively low intensity, which was still stronger than that of the control imprint (Fig. 4g and h). In MSI analysis, the in situ degradation of the target compounds can alter their locations from the natural state during long-term data acquisition.23 Thus, imprinting the sample surface onto a PTFE membrane or TLC plate is a convenient way to rescue phytohormones from degradation and avoid cuticles in MSI experiments, especially TLC-MSI analysis that has been used for chemical separation and identification for many years.24 It is important to state that almost all studied compound peaks suffered from different levels of fading in their quality after imprinting, but in the present study, the TLC plates were pre-wetted with organic solvents to further improve the signal-to-noise ratios of the imprinted samples.16 Although some of the targeted compounds showed weak signals in the imprinted wounded and control samples, the phytohormone peaks of JA, SA, ABA and IAA acquired from the indirect analysis of the wounded leaf and the wounded region were generally in agreement with the in situ DESI-MSI characterisation result of intact leaves, suggesting that minor phytohormone degradation occurred in the DESI-MSI experiment.
In situ MS/MS validation
A DESI-MS/MS analysis was performed on Arabidopsis leaves after the DESI-MSI analysis of intact and imprinted samples to validate the peaks assigned as phytohormone compounds. The leaf samples used in the in situ DESI-MS/MS experiment were cultivated and prepared by the same method as described above. Precursor masses of targeted compounds were selected based on their standard infusion results and fragmented in MS with a collision energy between 5 and 20 eV. Most fragmented ions of endogenous compounds could be picked from the MS/MS spectra in their predicted mass range, and their standard and in situ fragmentation spectra are shown in the ESI.† Here, representative MS/MS spectra of endogenous JA, SA, IAA and ABA acquired from the wounded leaf samples are shown in Fig. 5, and their major fragmentation ions are included with their molecular formula. The ion intensity maps created by the targeted phytohormone parent and product peaks are shown on the right side of their MS/MS spectra (Fig. 5b, d, f and g). The JA parent peak (C12H17O3−; m/z 209.1176) and its standard fragment ions C11H17O− (m/z 165.1021) and C2H3O2− (m/z 59.0515) were detected from the wounded leaf and were mainly highlighted inside the wounded region. Also, the MS/MS spectra of endogenous SA (m/z 137.0240), IAA (m/z 174.0543) and ABA (m/z 263.1292) acquired from the wounded leaves revealed similar spatial distributions to those of their major fragment ions, which had also been detected in the fragmentation spectra of the standard compounds. Therefore, peaks of the key endogenous wound-induced phytohormone fragmentation ions matched previous records in the standard infusion, and their spatial distributions were compatible with the ion intensity maps established from the parent peaks and the DESI-MSI analysis of intact samples, which further confirmed the presence of targeted phytohormones in the wounded leaves.
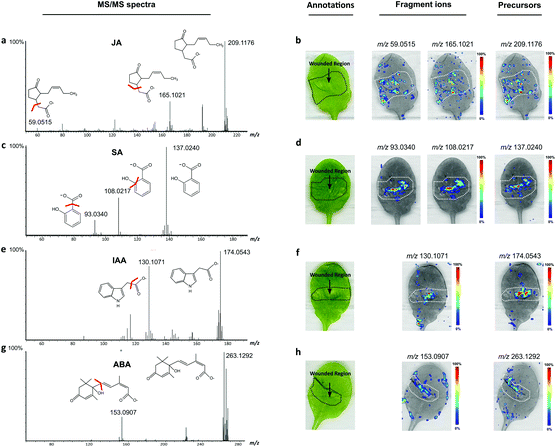 |
| | Fig. 5 DESI-MS/MS spectra (left) and images (right) of phytohormones (JA, SA, IAA and ABA) and their major fragmented ions acquired from the wounded leaf samples together with leaf annotations. The molecular formulas for the identified fragments are also shown. (a) The MS/MS spectrum of endogenous JA and (b) images created from the JA precursor and two fragmented peaks; (c) the MS/MS spectrum of endogenous SA and (d) its two major fragmented peak images; (e) the MS/MS spectrum of endogenous IAA and (f) its major fragmented peak image; and (g) the MS/MS spectrum of endogenous ABA and (h) its major fragmented peak image. | |
LC-MS/MS validation
After DESI-MSI characterisation, the phytohormone species, JA, SA, IAA and ABA, and related compounds, identified in the mechanically stressed Arabidopsis leaves, were further quantified by LC-MS/MS analysis. Briefly, twenty leaf samples of Arabidopsis thaliana (Col-0) (10 wounded plants and 10 unwounded controls) were harvested in the 30 min time point after sample leaves were wounded using a tweezer press. All leaf samples prepared for the LC-MS/MS experiments were collected at the same time, after which homogenised leaves were subjected to analyte purification according to the solid phase extraction (SPE) protocol published before.10 The eluted compounds were then loaded onto a reverse-phase column for quantitative analysis, and the results were compared using the unpaired t-test. In total, 11 phytohormone compounds highlighted in the DESI-MSI analysis were detected and quantified (Table 2), and significant accumulation of JA and its related compounds was reported in the wounded leaves. ABA was found in a significantly high amount in the wounded leaves, and ABA metabolites, for instance, PA, also showed obvious differences between wounded and control samples. Apart from JA and ABA, a slightly higher amount of IAA was found in the wounded leaves than in the controls, although changes of auxin levels were not as significant as the amount of JA in these LC-MS/MS quantification results. However, compared with unwounded leaves, SA did not show any obvious increase in the wounded leaves after 30 min. Interestingly, two of the key precursor compounds of JA biosynthesis, OPDA and dn-OPDA, also did not differ in any of the analysis performed. Further quantification of targeted phytohormones was performed on the wounded and unwounded regions of stressed leaves that have been separated using in-needle dissection, purified and again analysed by the same LC-MS/MS protocol.10 The regional quantification results showed that JA and its precursors were predominantly accumulated in the wounded regions of the sample leaves rather than in the unwounded regions (ESI†), and similar results were revealed in previous ion intensity maps. In summary, the well-established LC-MS/MS analysis performed on the leaf samples delivered an important reference for the profiles of wound-induced phytohormones, and this quantification result could help to validate the phytohormone differences highlighted in in situ DESI-MSI characterisation.
Table 2 Abundances of endogenous phytohormones and related compounds in the homogenised wounded and control leaf samples. Leaves (harvested after wounding for 30 min, 10 mg FW per sample) were extracted, purified using the SPE procedure and quantified by LC-MS/MS
| Total phytohormone profile in wound-induced leaves (pmol g−1) |
| Targeted compounds |
Control |
Wounded |
Fold change |
Significancea |
|
The significance level was calculated by P values in the unpaired t-test result between two comparison groups, * p < 0.05, ** p < 0.01, *** p < 0.005.
|
| JA |
1876.9 ± 575.9 |
3035.4 ± 149.9 |
1.62 |
0.0280* |
| OPC-4 |
1721.8 ± 808.4 |
2217.5 ± 356.0 |
1.29 |
0.3861 |
| OPC-6 |
87.2 ± 23.9 |
240.4 ± 22.8 |
2.76 |
0.0013** |
| OPC-8 |
27.3 ± 16.3 |
97.2 ± 28.8 |
3.56 |
0.0216* |
| dn-OPDA |
7219.0 ± 3486.9 |
8024.0 ± 2061.0 |
1.11 |
0.7480 |
|
cis-OPDA |
7812.0 ± 4973.5 |
6771.2 ± 3173.0 |
0.87 |
0.7752 |
| OH-JA |
36.7 ± 7.3 |
126.5 ± 9.0 |
3.45 |
0.0002*** |
| IAA |
11.1 ± 1.7 |
13.3 ± 1.2 |
1.20 |
0.1372 |
| ABA |
2.9 ± 0.4 |
4.8 ± 0.2 |
1.66 |
0.0017** |
| PA |
11.2 ± 1.5 |
19.5 ± 0.4 |
1.74 |
0.0008*** |
| SA |
100.1 ± 13.7 |
101.4 ± 8.1 |
1.01 |
0.8924 |
Evaluation of the phytohormone changes in wounded leaves
Aiming to evaluate the quantification power of DESI-MSI in wound-induced phytohormone analysis, all assigned peaks were processed using msIQuant, and their intensities were normalised according to the spectra collected from the regions of interest (ROIs).22 Here, the levels of phytohormones, represented as the mean intensities of the 0.1 mDa bins in this DESI-MSI, were compared using Student's t-test to determine whether significant differences existed between the control and wounded leaves, as well as unwounded and wounded regions. Four phytohormones and seven related compound peaks have been identified from the intact leaves by DESI-MSI analysis that were individually involved in the mechanical stress response in leaves. The average intensities of phytohormone compounds in the four comparison groups mentioned above are presented in the bar plots (Fig. 6). In the LC-MS/MS-based quantification, homogenised wounded leaf samples showed significantly higher JA and ABA abundances than the control leaf mixture, while their peak intensity levels averaged from the DESI-MSI analysis of the whole leaf areas demonstrated similar changes together with IAA and SA whose intensity levels show more significant increases in the wounded leaves (Fig. 6a–d). Besides, almost all identified phytohormone-related compounds showed relatively higher abundances in the wounded leaves than the controls (Fig. 6e–k). A recent study suggested ABA increased after mechanical stress, but the DESI-MSI analysis of the stressed leaves in our study did not show any significant difference inside the wounded region.25 More importantly, the average intensity levels between wounded and unwounded regions suggested that JA and SA were primarily accumulated inside the stressed area rather than the entire leaves (Fig. 6a and c). Similar differences were also shown in the evaluation results of JA precursors, OPC-4, OPC-6, dn-OPDA and metabolite OH-JA; their peak intensities were much higher inside the wounded regions (Fig. 6e, g, k and h). However, the regional comparisons did not differ in terms of OPC-8, OPDA and PA abundances in any of the performed analyses (Fig. 6i, f and j), yet the DESI-MS results showed relatively lower intensity levels in the wounded tissues but with large standard deviations in whole analyses.
 |
| | Fig. 6 Abundance differences of JA (a), IAA (b), SA (c), ABA (d) and other phytohormone-related compounds (e–k) in the four comparison tissue types, including the overall control leaves (green), wounded leaves (red), and unwounded (grey) and wounded regions (yellow). The t-test results (n = 6) evaluated at the whole leaf and regional levels, including mean, standard deviation and significance values, are shown in the bar plots. | |
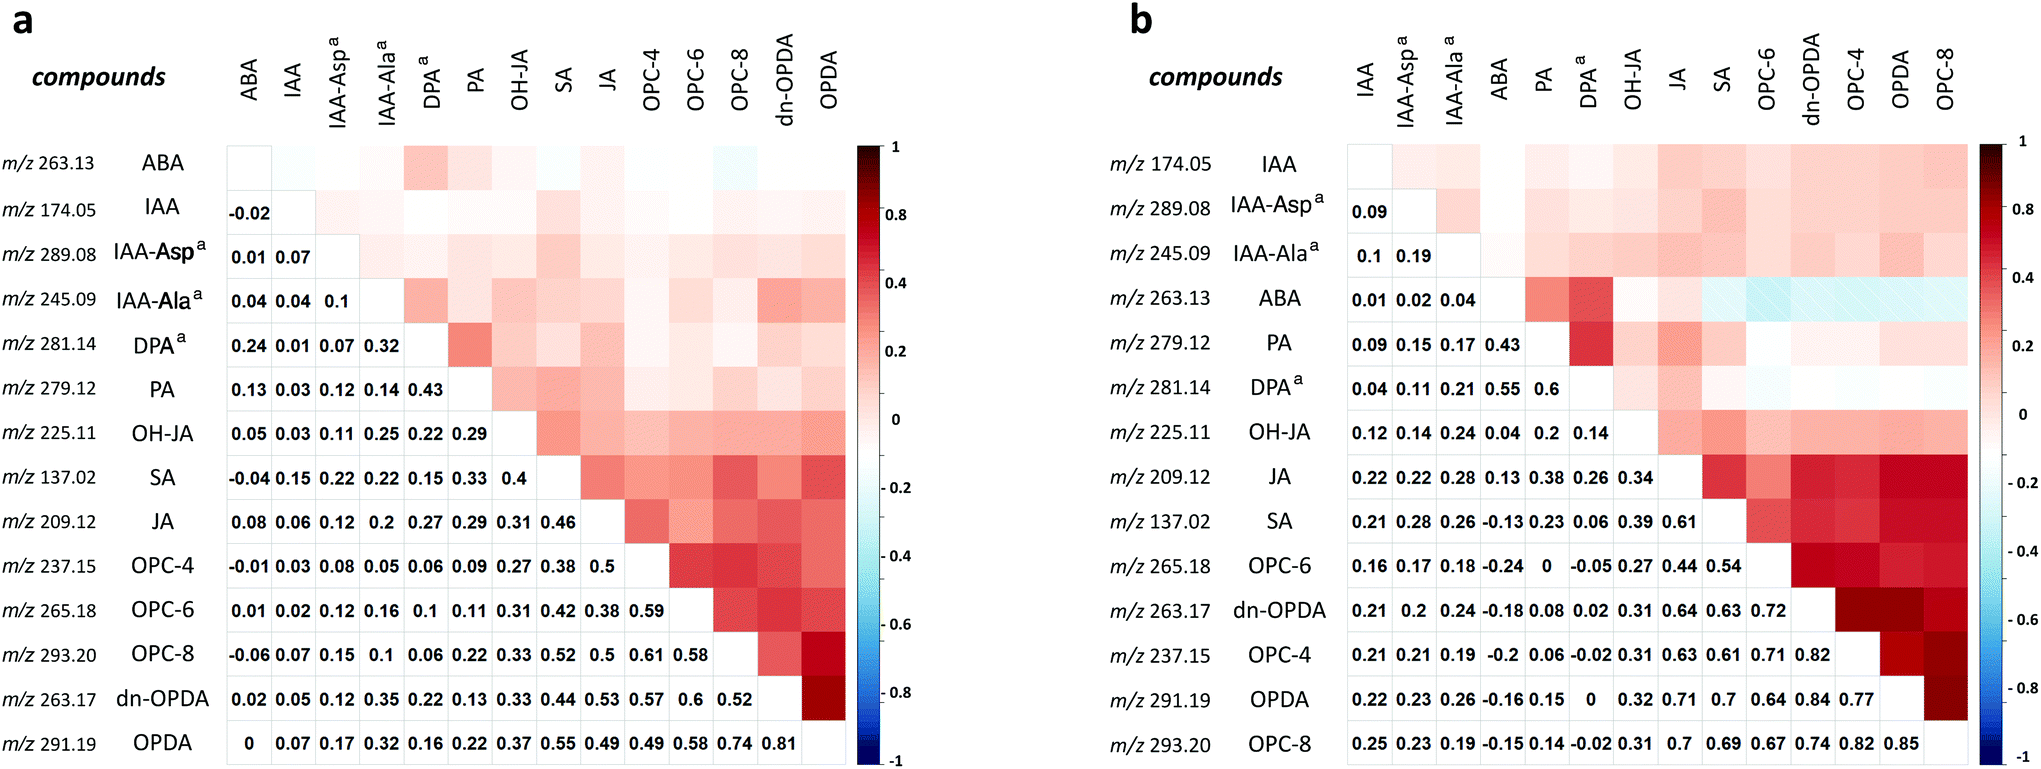
Further correlation analysis (Pearson product–moment correlation coefficient) of the DESI-MSI dataset revealed potential connections of the studied compounds in mechanical stress. In total, 11 identified phytohormone peaks acquired from all six wounded samples were separated by their tissue types and imported into the local R script for coefficient matrix generation. Another three peaks, m/z 289.0819, 245.0936 and 281.1393, predicated as phytohormone metabolites, indole-3-acetyl-L-alanine (IAA-Ala), indole-3-acetyl-L-aspartic acid (IAA-Asp) and dihydrophaseic acid (DPA), respectively, were also imported for this correlation analysis. Therefore, two matrix tables representing correlation levels of 14 studied compounds in data points collected from the wounded leaves and regions are shown in Fig. 7. Here, each correlation matrix, including 14 self-correlation blank entries (value = 1), and the studied compounds have been re-ordered according to the hierarchical clustering rank. When considering the phytohormone correlation in the wounded leaves, a majority of phytohormones demonstrated positive coefficient values with other species, except for ABA and its metabolites, which did not show any correlation with the JA species at both whole leaf and regional levels (Fig. 7). The abundances of ABA and IAA were not strongly correlated with other phytohormone species, indicating potential regional differences in wound-induced phytohormone accumulations inside leaves. The precursor family of JA (OPC-4, OPC-6, OPC-8, dn-OPDA and OPDA) demonstrated the highest coefficient values in these wounded regions, and other phytohormone metabolites, including predicted ones, were closer to each other than the rest of the studied compounds. The correlation analysis also indicated that the abundance of dn-OPDA is more close to the accumulation of JA. It matched the previous hypothesis that dn-OPDA is a rapid wounding signal and takes the role of bridging OPDA to JA biosynthesis at the beginning of the stress.26 Besides, the co-existence of SA and JA in the wounded tissue was also revealed in the correlation analysis and can be visualised from their images. Interestingly, we found that SA had potential connections with JA and its precursors, but auxins demonstrated low efficiency with JA and SA in this DESI-MSI dataset. The interaction between JA and SA has been addressed before.27 Many enzymes in JA biosynthesis, such as allene oxide synthase (AOS) and lipoxygenase 2 (LOX2), are regulated by the SA concentration in the cells.28 While the homeostasis of JA and auxins is an important mechanism in the plant abiotic wounding response, genetic evidence shows that both auxin– and JA–amino acid conjugation shared a common substrate of amidohydrolase.29 Therefore, the correlation analysis suggested that the abundance changes of SA and JA may increase dependently in the wounded regions, whereas ABA and auxin metabolism seemed to not directly depend on other phytohormones in the wounded leaves.
 |
| | Fig. 7 Correlation analysis in determining the similarities of 14 studied compounds in their spatial distributions in the wounded leaves (a) and wounded regions (b). The correlation results are summarised in hierarchical clustering heatmaps (top) and the coefficient values of the peaks assigned as targeted compounds are shown inside the 14 × 14 data cubes (bottom). aPeaks predicted as phytohormone related compounds based on their standard masses. | |
Conclusions
In the past decades, many plant studies used MSI as their visualisation tool, and this method has been successfully used for the in situ detection of numerous biomolecule targets from various types of samples, whereas only a few papers have considered MSI in the field of phytohormone studies. The endogenous abundance of phytohormones in plants normally is much lower than that of other biomolecules, and this along with their low molecular weights makes the unlabelled visualisation of them from plant tissues nearly impossible. Therefore, the application of mass spectrometry imaging in phytohormone research delivers a new high-throughput analytical method for phytohormone visualisation and potential quantification that is characterised as a reliable, low-cost and non-invasive imaging method. The performance of MSI on plant organs, leaves as an example, also results in hundreds of peaks representing endogenous compounds, including phytohormones and other metabolites, that demonstrate unique patterns on the tissue surface. In conclusion, the results presented in this paper provide strong evidence of spatial distributions and abundance of jasmonic acid, salicylic acid, indole-3-acetic acid, abscisic acid and related compounds inside mechanically stressed leaves and show that DESI-MSI is an emerging tool for the in situ characterisation of phytohormones in plant research.
Author contributions
Chao Zhang: investigation; conceptualization; methodology; software; writing – original draft. Asta Žukauskaitė: writing – review & editing; visualization. Ivan Petřík: formal analysis. Aleš Pěnčík: formal analysis. Martin Hönig: resources. Jiří Grúz: data curation. Jitka Široká: validation. Ondřej Novák: funding acquisition; project administration; supervision; writing – review & editing. Karel Doležal: funding acquisition; project administration; supervision; writing – review & editing.
Conflicts of interest
All authors declare that there is no competing financial, professional, or personal interest that might have influenced the performance or presentation of the work described in this manuscript.
Acknowledgements
This work was supported by Palacký University (IGA_PrF_2021_011 and IGA_PrF_2021_016), by the Ministry of Education, Youth and Sports of the Czech Republic via the European Regional Development Fund – Project “Plants as a tool for sustainable global development” (CZ.02.1.01/0.0/0.0/16_019/0000827) and by the Czech Science Foundation (19-10464Y and 20-26232S). The authors are thankful to Ota Blahoušek for assistance with image preparation and Alexander Muck from Analytical Professional Services Group (Waters Corporation) for the technical solutions.
References
-
P. J. Davies, Plant hormones: physiology, biochemistry and molecular biology, Springer Science & Business Media, 2013 Search PubMed.
-
P. J. Davies, in Plant Hormones: Biosynthesis, Signal Transduction, Action!, ed. P. J. Davies, Springer Netherlands, Dordrecht, 2010, pp. 1–15 Search PubMed.
- G. Kudoyarova, T. N. Arkhipova, T. Korshunova, M. Bakaeva, O. Loginov and I. C. Dodd, Front. Plant Sci., 2019, 10, 1368 CrossRef PubMed.
- S. I. Gibson, J. Exp. Bot., 2004, 55, 253–264 CrossRef CAS PubMed.
- S. Forcat, M. H. Bennett, J. W. Mansfield and M. R. Grant, Plant Methods, 2008, 4, 16 CrossRef.
- M. Schäfer, I. D. Meza-Canales, A. Navarro–Quezada, C. Brütting, R. Vanková, I. T. Baldwin and S. Meldau, J. Integr. Plant Biol., 2015, 57, 198–212 CrossRef PubMed.
- A. Gfeller, R. Liechti and E. E. Farmer, Sci. Signaling, 2010, 3, cm4–cm4 Search PubMed.
- R. C. De Vos, S. Moco, A. Lommen, J. J. Keurentjes, R. J. Bino and R. D. Hall, Nat. Protoc., 2007, 2, 778 CrossRef CAS.
- T. F. Jorge, J. A. Rodrigues, C. Caldana, R. Schmidt, J. T. van Dongen, J. Thomas-Oates and C. António, Mass Spectrom. Rev., 2016, 35, 620–649 CrossRef CAS PubMed.
- K. Floková, D. Tarkowská, O. Miersch, M. Strnad, C. Wasternack and O. Novák, Phytochemistry, 2014, 105, 147–157 CrossRef PubMed.
- B. A. Boughton, D. Thinagaran, D. Sarabia, A. Bacic and U. Roessner, Phytochem. Rev., 2016, 15, 445–488 CrossRef CAS PubMed.
- J. M. Wiseman, D. R. Ifa, A. Venter and R. G. Cooks, Nat. Protoc., 2008, 3, 517 CrossRef CAS.
- Y. Liao, X. Fu, H. Zhou, W. Rao, L. Zeng and Z. Yang, Food Chem., 2019, 292, 204–210 CrossRef CAS.
- J. Thunig, S. H. Hansen and C. Janfelt, Anal. Chem., 2011, 83, 3256–3259 CrossRef CAS PubMed.
-
Y. Su, S. Xia, R. Wang and L. Xiao, Hormone metabolism and signaling in plants, 2017, vol. 13, pp. 431–470 Search PubMed.
- E. C. Cabral, M. F. Mirabelli, C. J. Perez and D. R. Ifa, J. Am. Soc. Mass Spectrom., 2013, 24, 956–965 CrossRef CAS.
- D. S. Wishart, Y. D. Feunang, A. Marcu, A. C. Guo, K. Liang, R. Vázquez-Fresno, T. Sajed, D. Johnson, C. Li and N. Karu, Nucleic Acids Res., 2017, 46, D608–D617 CrossRef PubMed.
- K. W. Phinney, G. Ballihaut, M. Bedner, B. S. Benford, J. E. Camara, S. J. Christopher, W. C. Davis, N. G. Dodder, G. Eppe, B. E. Lang, S. E. Long, M. S. Lowenthal, E. A. McGaw, K. E. Murphy, B. C. Nelson, J. L. Prendergast, J. L. Reiner, C. A. Rimmer, L. C. Sander, M. M. Schantz, K. E. Sharpless, L. T. Sniegoski, S. S. C. Tai, J. B. Thomas, T. W. Vetter, M. J. Welch, S. A. Wise, L. J. Wood, W. F. Guthrie, C. R. Hagwood, S. D. Leigh, J. H. Yen, N.-F. Zhang, M. Chaudhary-Webb, H. Chen, Z. Fazili, D. J. LaVoie, L. F. McCoy, S. S. Momin, N. Paladugula, E. C. Pendergrast, C. M. Pfeiffer, C. D. Powers, D. Rabinowitz, M. E. Rybak, R. L. Schleicher, B. M. H. Toombs, M. Xu, M. Zhang and A. L. Castle, Anal. Chem., 2013, 85, 11732–11738 CrossRef CAS.
- D. R. Ifa, C. Wu, Z. Ouyang and R. G. Cooks, Analyst, 2010, 135, 669–681 RSC.
- E. Honarvar and A. R. Venter, J. Am. Soc. Mass Spectrom., 2018, 29, 2443–2455 CrossRef CAS.
- H. M. Leskinen, J.-P. Suomela and H. P. Kallio, Rapid Commun. Mass Spectrom., 2010, 24, 1–5 CrossRef CAS.
- P. Källback, A. Nilsson, M. Shariatgorji and P. E. Andrén, Anal. Chem., 2016, 88, 4346–4353 CrossRef PubMed.
- N. H. Patterson, A. Thomas and P. Chaurand, J. Mass Spectrom., 2014, 49, 622–627 CrossRef CAS.
- G. J. Van Berkel, M. J. Ford and M. A. Deibel, Anal. Chem., 2005, 77, 1207–1215 CrossRef CAS PubMed.
- M. S. Hillwig, N. D. LeBrasseur, P. J. Green and G. C. MacIntosh, Mol. Genet. Genomics, 2008, 280, 249 CrossRef CAS PubMed.
- H. Weber, B. A. Vick and E. E. Farmer, Proc. Natl. Acad. Sci. U. S. A., 1997, 94, 10473–10478 CrossRef CAS PubMed.
- C. M. Pieterse, D. Van der Does, C. Zamioudis, A. Leon-Reyes and S. C. Van Wees, Annu. Rev. Cell Dev. Biol., 2012, 28, 489–521 CrossRef CAS PubMed.
- A. Robert-Seilaniantz, M. Grant and J. D. Jones, Annu. Rev. Phytopathol., 2011, 49, 317–343 CrossRef CAS PubMed.
- T. Zhang, A. N. Poudel, J. B. Jewell, N. Kitaoka, P. Staswick, H. Matsuura and A. J. Koo, J. Exp. Bot., 2015, 67, 2107–2120 CrossRef PubMed.
Footnote |
| † Electronic supplementary information (ESI) available. See DOI: 10.1039/d0an02118k |
|
| This journal is © The Royal Society of Chemistry 2021 |
Click here to see how this site uses Cookies. View our privacy policy here. 
 Open Access Article
 This Open Access Article is licensed under a Creative Commons Attribution-Non Commercial 3.0 Unported Licence
 *ab,
Asta
Žukauskaitė
*ab,
Asta
Žukauskaitė